How much slower is +5Kg (11 lbs)

Due to a very serious spinal injury, myWindsock founder Ben, had 12 months without cycling. He returns to cycling 5Kg (11 lbs) heavier. How much slower can he expect to be? See the Instagram post below.

A bit more detail

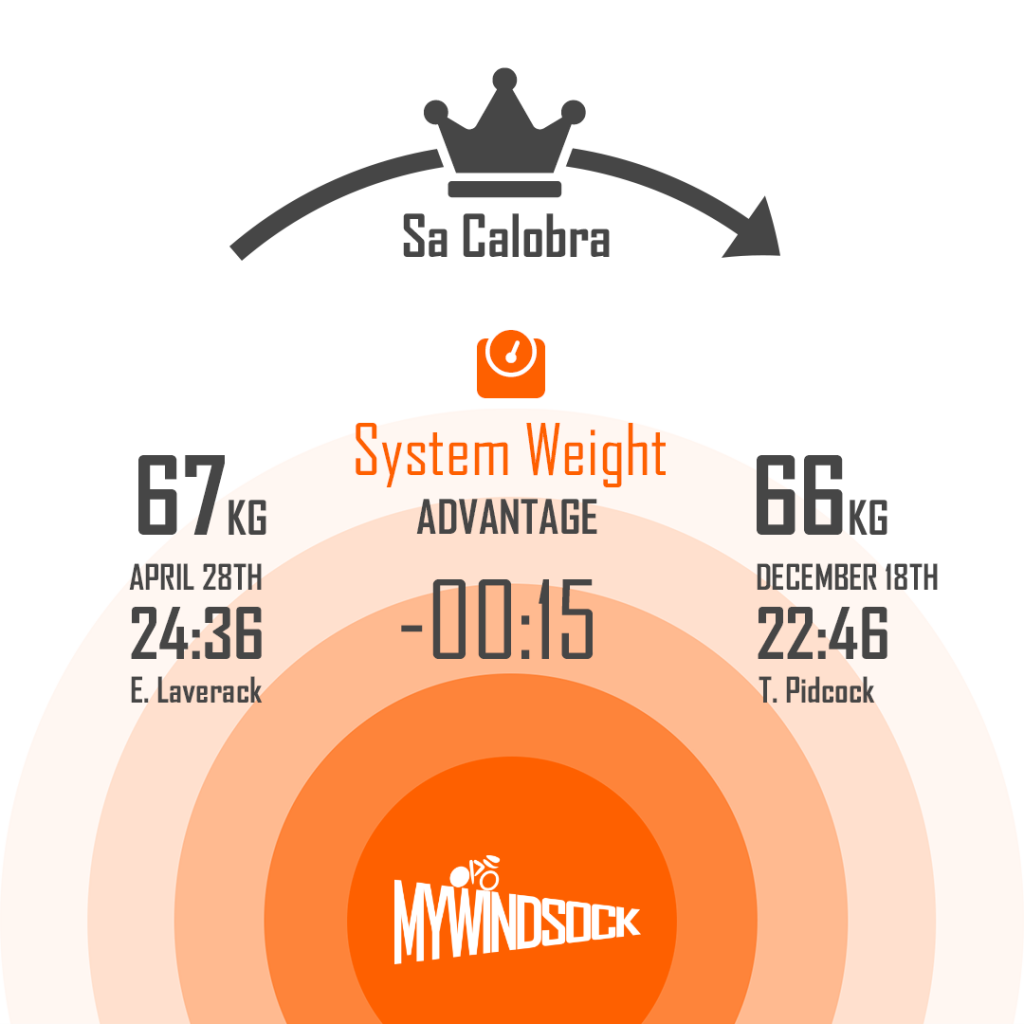
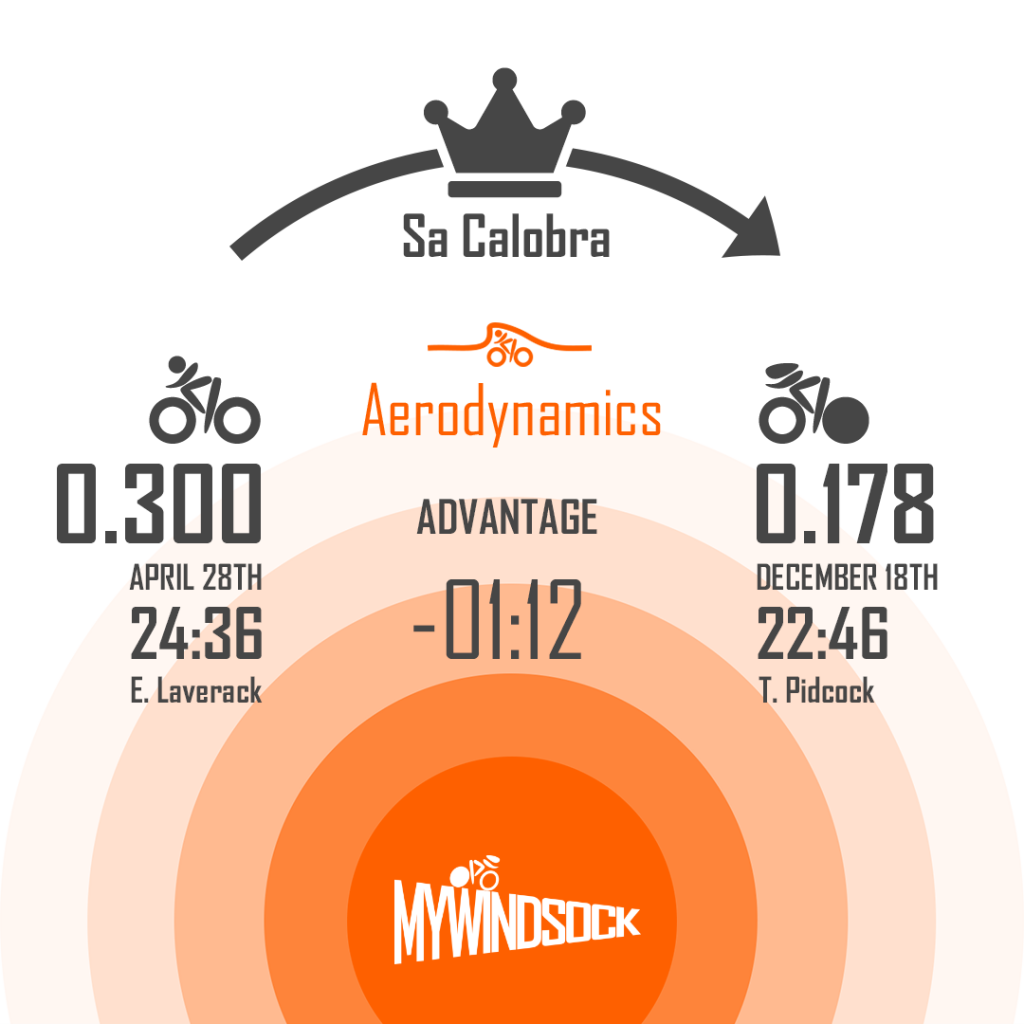
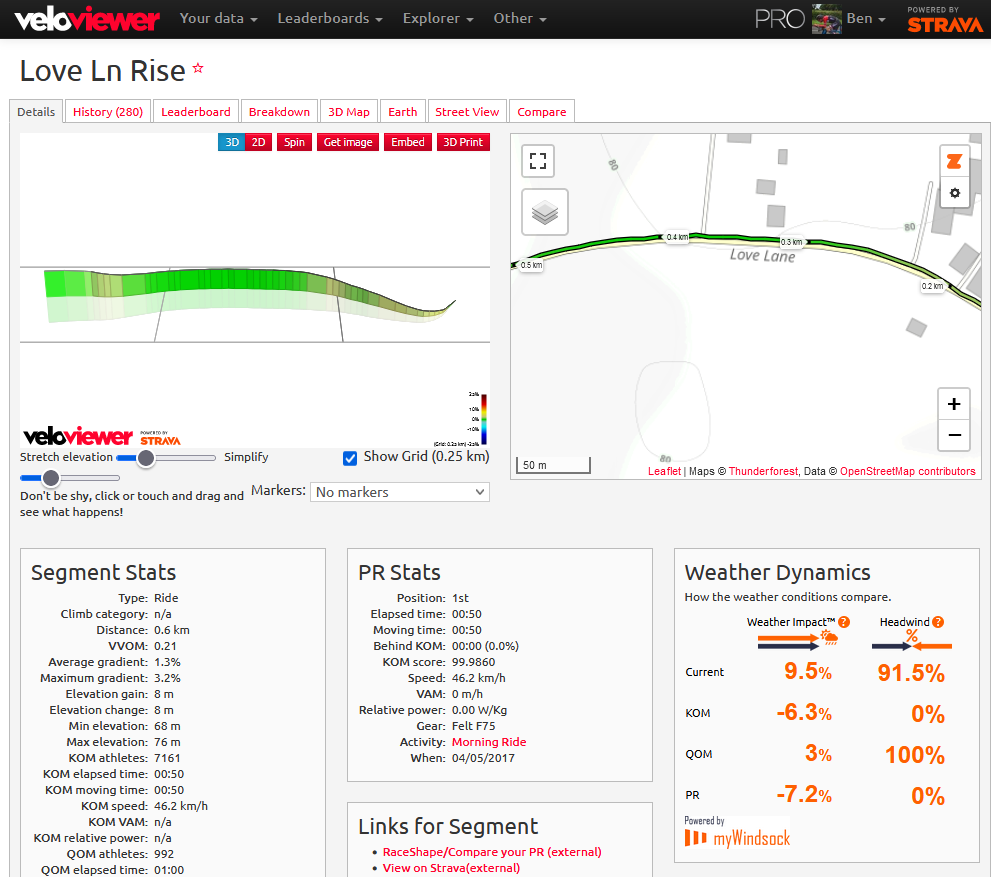
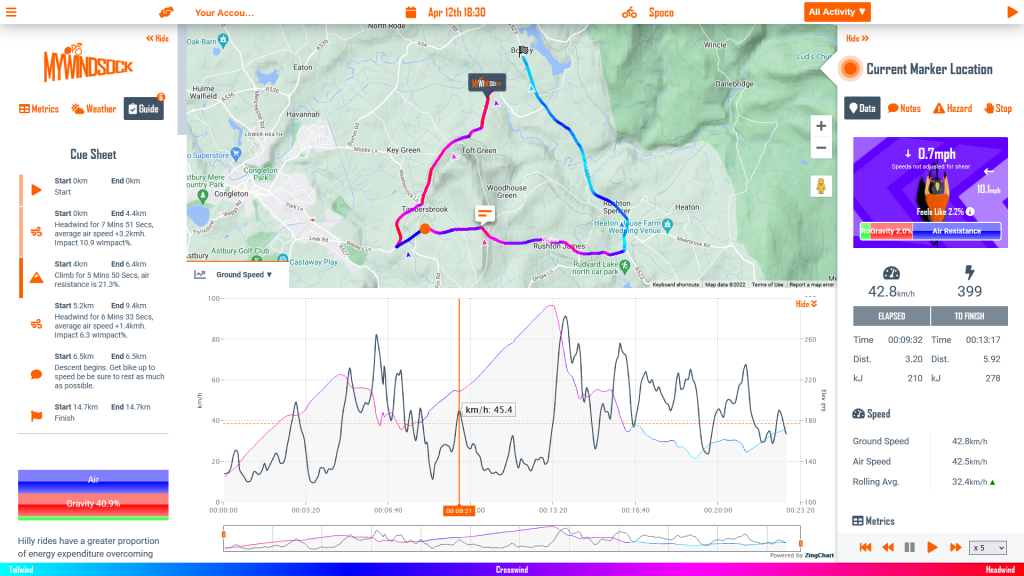
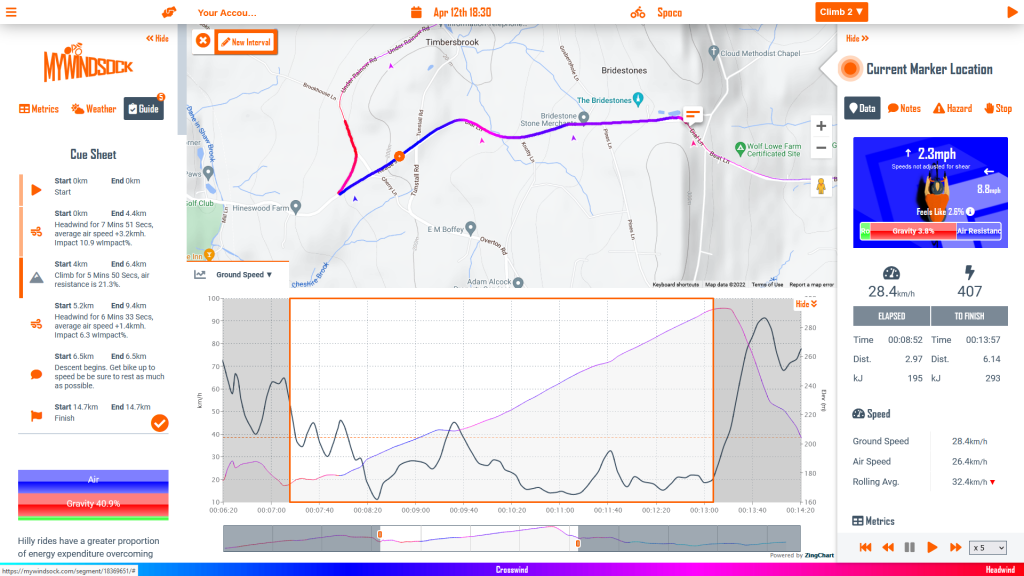
We are all about real world riding, so we picked a very typical 25 mile course, on an average UK spring day. This course has some small ups and downs but would be categorised as flat. You can try the course yourself here, J4/8.

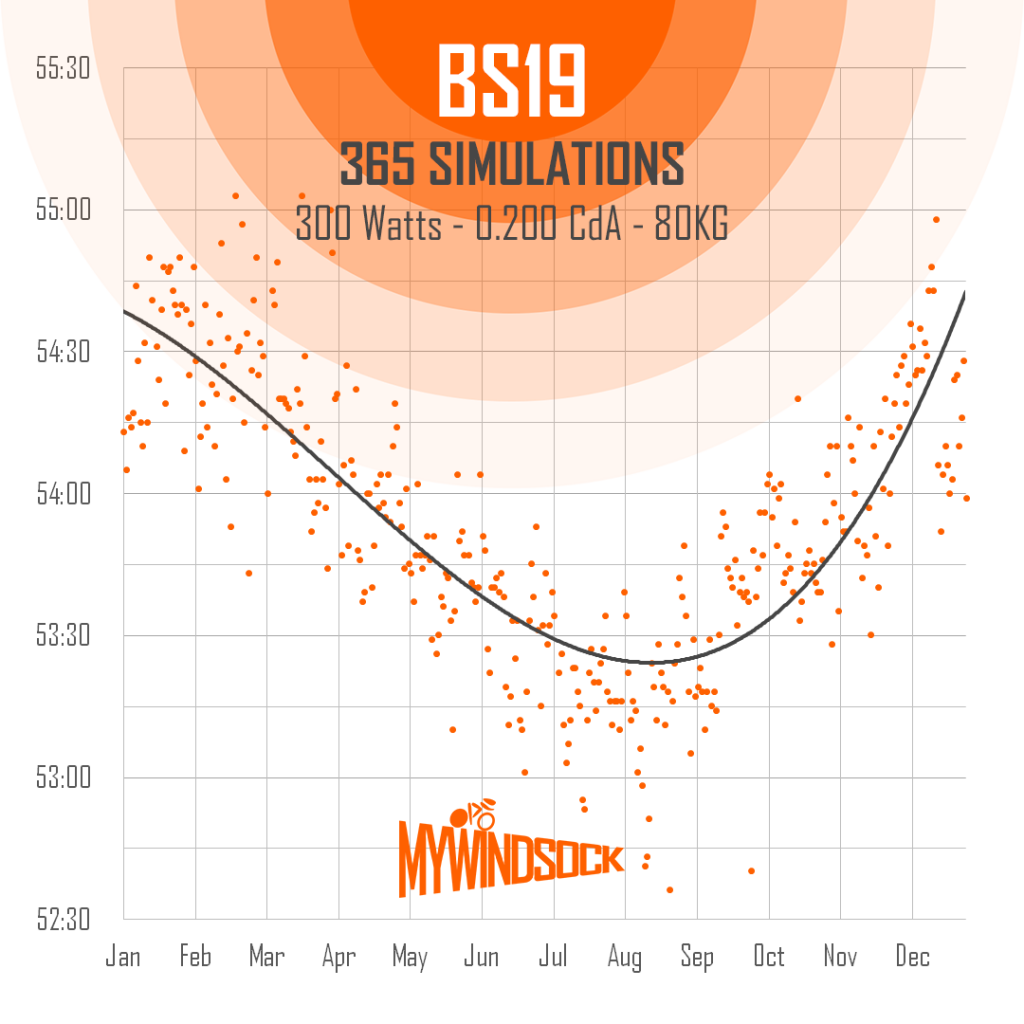
Our experiment was acrross 3 power ranges, 100, 200 and 300 Watts. Look at the chart below to see the differences between the powers. The differences are considerable. Remember, the time affect of a resistance compounds the slower you are moving. Less power, greater cost. No more, “I’m too slow for that upgrade” 😉

Often cyclists are surprised by how little time weight costs on a flat course. We are told lighter is always better and to upgrade to the lightest components. As you can see losing weight will have an affect on your speed, but we hope this will keep everything in perspective when making lifestyle and financial choices.

How to try your own experiments

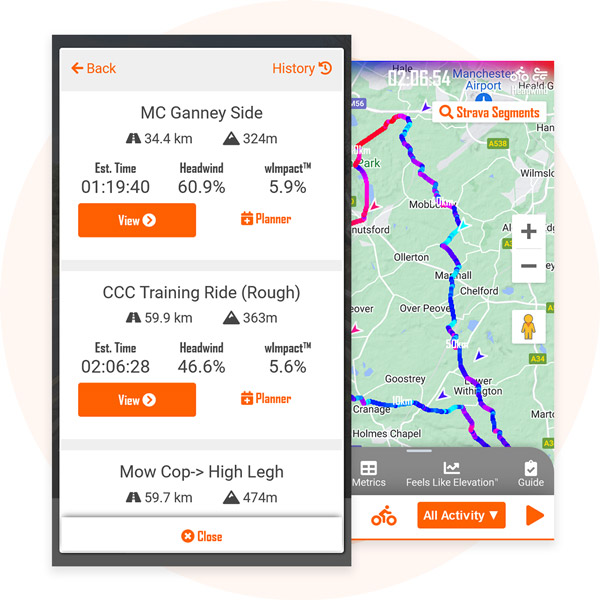
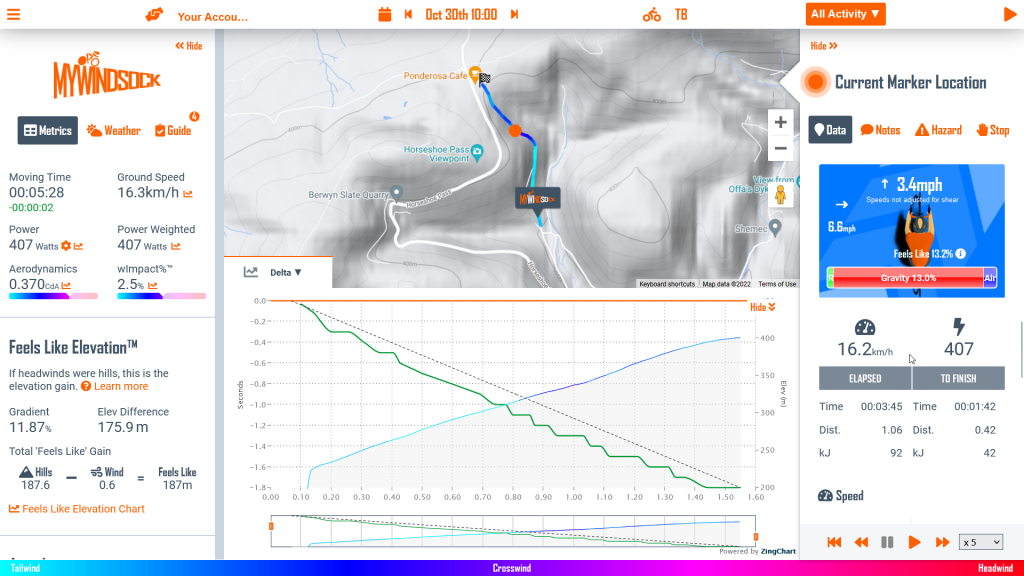
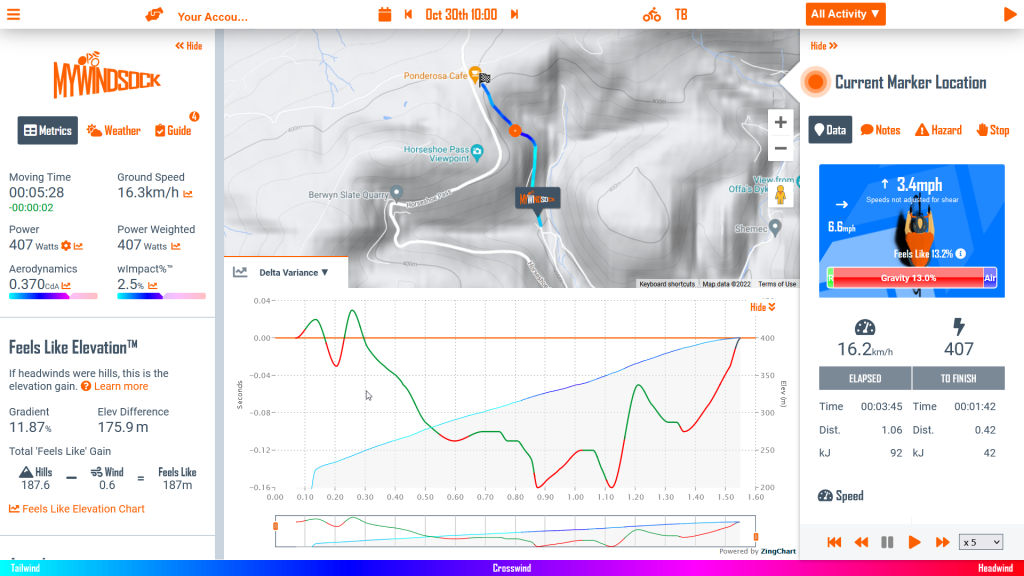
The beauty of myWindsock is that all the variables are accounted for, Physics, Weather & Performance. This allows you to get real world test results in a virtual environment.

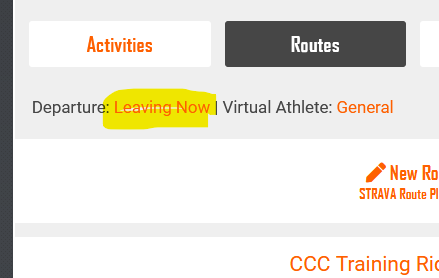
  1. Simply pick any route from your “Activities & Routes” menu.
  2. Set the date and time of your experiment for the most accurate cycling weather.
  3. Make changes to your Virtual Athlete profile.

Have a try yourself here.

How will a ride feel?

Take a look at the below graphic for this week’s Manchester District 10 mile. If you subscribe to myWindsock Strava Activity emails you may have already seen a similar graphic for your own rides. If not, activate your emails here.

https://mywindsock.com/modules/shareables/map.php?source=strava_segment&id=22428508&time=1677938400

56.4% headwind isn’t good news! However it is only through viewing the Feels Like Elevation graph beneath that we begin to see what affect the wind will have on the course.

Relating the wind to it’s equivalent elevation gain is one of the ways we are helping to describe the weather for cyclists. Learn more about Feels Like Elevation.

So what does this tell us? Initially we see an easing of the course profile due to the tailwind start. Then, once the headwind begins, the road begins to feel harder than the traditional elevation profile would suggest.

Graphs like Feels Like Elevation can be found for any past activity and any future ride forecast. Simply select the route from you Activities & Routes menu to begin.

If you haven’t already signed up for myWindsock Weather & Analysis, start here.

How much slower are Winter Time Trials?

To mark the first British Open time trial of the 2023 season, we were happy to help Cycling Time Trials, the British governing body for time trials, with a bit of data.

> Read the Cycling Time Trials article

> BS19 Ely & District myWindsock Forecast

What is the difference between Winter and Summer?

To find out the difference between Winter and Summer, we ran a simulation for every day of 2022. That’s 365 times around the Ely & District course! We ran the myWindsock simulations at 300 Watts, 80kg, 0.200 CdA. Here’s what we found.

Each orange dot is a simulated time based on weather conditions. Each day of 2022 represented.

You can see from the above graph the day to day the variability of times for the BS19 course due to the weather. Time range from 55 minutes in Winter Months to 53 minutes in the Summer.

Another thing to note is the seasonal day to day variability, that is the difference between two days of the same week or month. In the Winter we can see this is around 60 seconds, however times are a little more consistent in the Summer at around 30 seconds. Good job myWindsock give’s you the tools to measure the impact of the Weather.

> Find your Open and Club Time Weather and Analysis

We have more information about how weather impacts cycling speeds, here are some more articles.

Why do you ride slower in Winter: GCN Tech Show

Slow vs Fast Riders who suffers more in Winter Kit

Why do you ride faster when it’s warmer?

Why you are slow this Winter

Pidcock’s Sa Calobra KOM Analysis

Last month we did a bit of Sa Calobra analysis for the GCN Tech Show. So when we saw the KOM time tumble, we had to do some analysis!

Surprisingly, it wasn’t a gift day. In fact it was around 1 second slower than Ed Laverack’s KOM day! We’ll call that one even. Air Speed is the speed of the airflow around the rider. We’ve shown the speed difference from ground speed here.

Overall power was 8 Watts higher, giving Tom a 24 second advatange. That’s a huge 6.6Watts/kg!

Next an assumption on System Weight. That is the weight of rider, bike and kit. Rider stats show Tom as 1 kg lighter. This finds Tom another 15 seconds.

Now the big one, Aero! Tom finds a massive 72 seconds. Reducing air resistance from 14.3% down to 10%. The aero Tom has here, is the equivalent to a very well tuned Time Trial Bike position. So we’d assume some assistance here.

How fast would your Sa Calobra time be?

You can find your own time on Sa Calobra, simply by loading the myWindsock forecast. Check out the Sa Calobra Strava Segment

New feature: Live forecast stats on your Strava Routes menu

Picking the best route has just become a little easier. New to the Activities & Routes menu, time estimates, headwind percentages, and Weather Impactsâ„¢ for each Strava Route and Segment.

Setting departure time

If you are not leaving for your bike ride immediately, you can set the departure time as desired.

How to view Strava Routes and Segments

It’s easy to view all of your Strava Routes and Segments on myWindsock. From the dashboard, go to “Activities & Routes”, select “Strava” to begin.

GCN Tech Show, National Hill Climb Winning Margin

For GCN, we were asked to look at the 2.36s Winning Margin, between Andrew Feather and Tom Bell. Check the GCN tech show out. Below the video, we I’ll show you how you can do similar experiments.

How you can discover stats like these with myWindsock

A myWindsock Virtual Athlete, rides the course just like you. However, they ride at any power, any aero, at any weight and never get tired. Just like you, they have to battle the weather and terrain. Virtual Athletes collect insightful data as they ride, meaning we can give you an exceptional level of detail about your activities.

Once you have customised your Virtual Athlete, you can now make changes to see how that impacts the time. In this example we have increased the Virtual Athlete’s Power by a couple of Watts. Not only can we see how much time has been gained, we can also see where on the course the time was gained. Notice how this isn’t a linear line, time is gained at differing rates.

Time gained by a couple of extra Watts

If you want to get super optimised, we can see where this extra power had the greatest impact on time. The Delta Variance shows this to us by colouring the line green. We’d prioritise these green sections when formulating a power plan.

Why not Predict what your National Hill Climb Time would have been, view forecast.

More about the National Hill Climb

>> National Hill Climb: The Winning Margin
>> National Hill Climb 2022 Weather Forecast

Adding Cycling Weather Dynamics to VeloViewer

We’re excited to announce, you can now find myWindsock cycling weather on the VeloViewer Strava Segment pages. Discover the weather conditions for every Strava Segment QOM and KOM. We love the additional insights and challenges, VeloViewer add to Strava activities. Now with a splash of myWindsock in there, we love it even more!

About VeloViewer

VeloViewer connects to your Strava account and pulls across your activities, segments and routes to provide you with a whole new world of dashboards, charts, 3D graphics, filterable lists, leaderboards, motivational goals along with your up-to-date leaderboard positions on all of the segments you have covered (Strava subscription required for segment positions).

What you now see on VeloViewer

For every Strava Segment, you can view the wImpact (Weather Impact) and Headwind percentage. Discover these metrics for the Current Time, KOM, QOM and your own PR Effort. Want to find out more? click on the metric to load the full myWindsock weather analysis.

wImpact is paticularly insightful for Strava KOM and QOMs. Taking into account all the weather conditions, myWindsock provides a comparative metric for how favourable to conditions are. A positive number indicates additional power is required to achieve the sames speeds on a weatherless day. Minus numbers, indicate favourable conditions.

About the data

These metrics are powered by myWindsock cycling weather analysis. Data is calculated for the every point along the route, ensuring the most accurate and relevant weather data possible.

myWindsock’s mission, is to remove uncertainty from athletic endeavours.​ By removing uncertainty, we enable athletes to dream big and achieve their own greatness. 

Latest Update: New Cue Sheet Features

To improve pre race preparation, we have developed a few additional features for your forecasts. These features are Desktop and Tablet features.

Cue Sheet Markers

Markers at the side of the Cue Sheet display where your Virtual Athlete is up to.

The Cue sheet will indicate which Cue Item is currently active based on your current Virtual Athlete’s location. Update your Virtual Athlete’s location by clicking on the map Windlines, hovering over the active chart, or by playing the activity.

Your Cue Sheet is now Interactive

Clicking on the Icon next to a Cue Item will highlight or zoom to the region on the forecast. Use this to view an interactive breakdown of the activity.