Ben Norbury is four times Manchester & District Middle Distance and Best All Rounder Time Trial Champion from 2016-2019. During this time he developed software to eliminate uncertainty of the weather conditions out of his pre-race preparation.
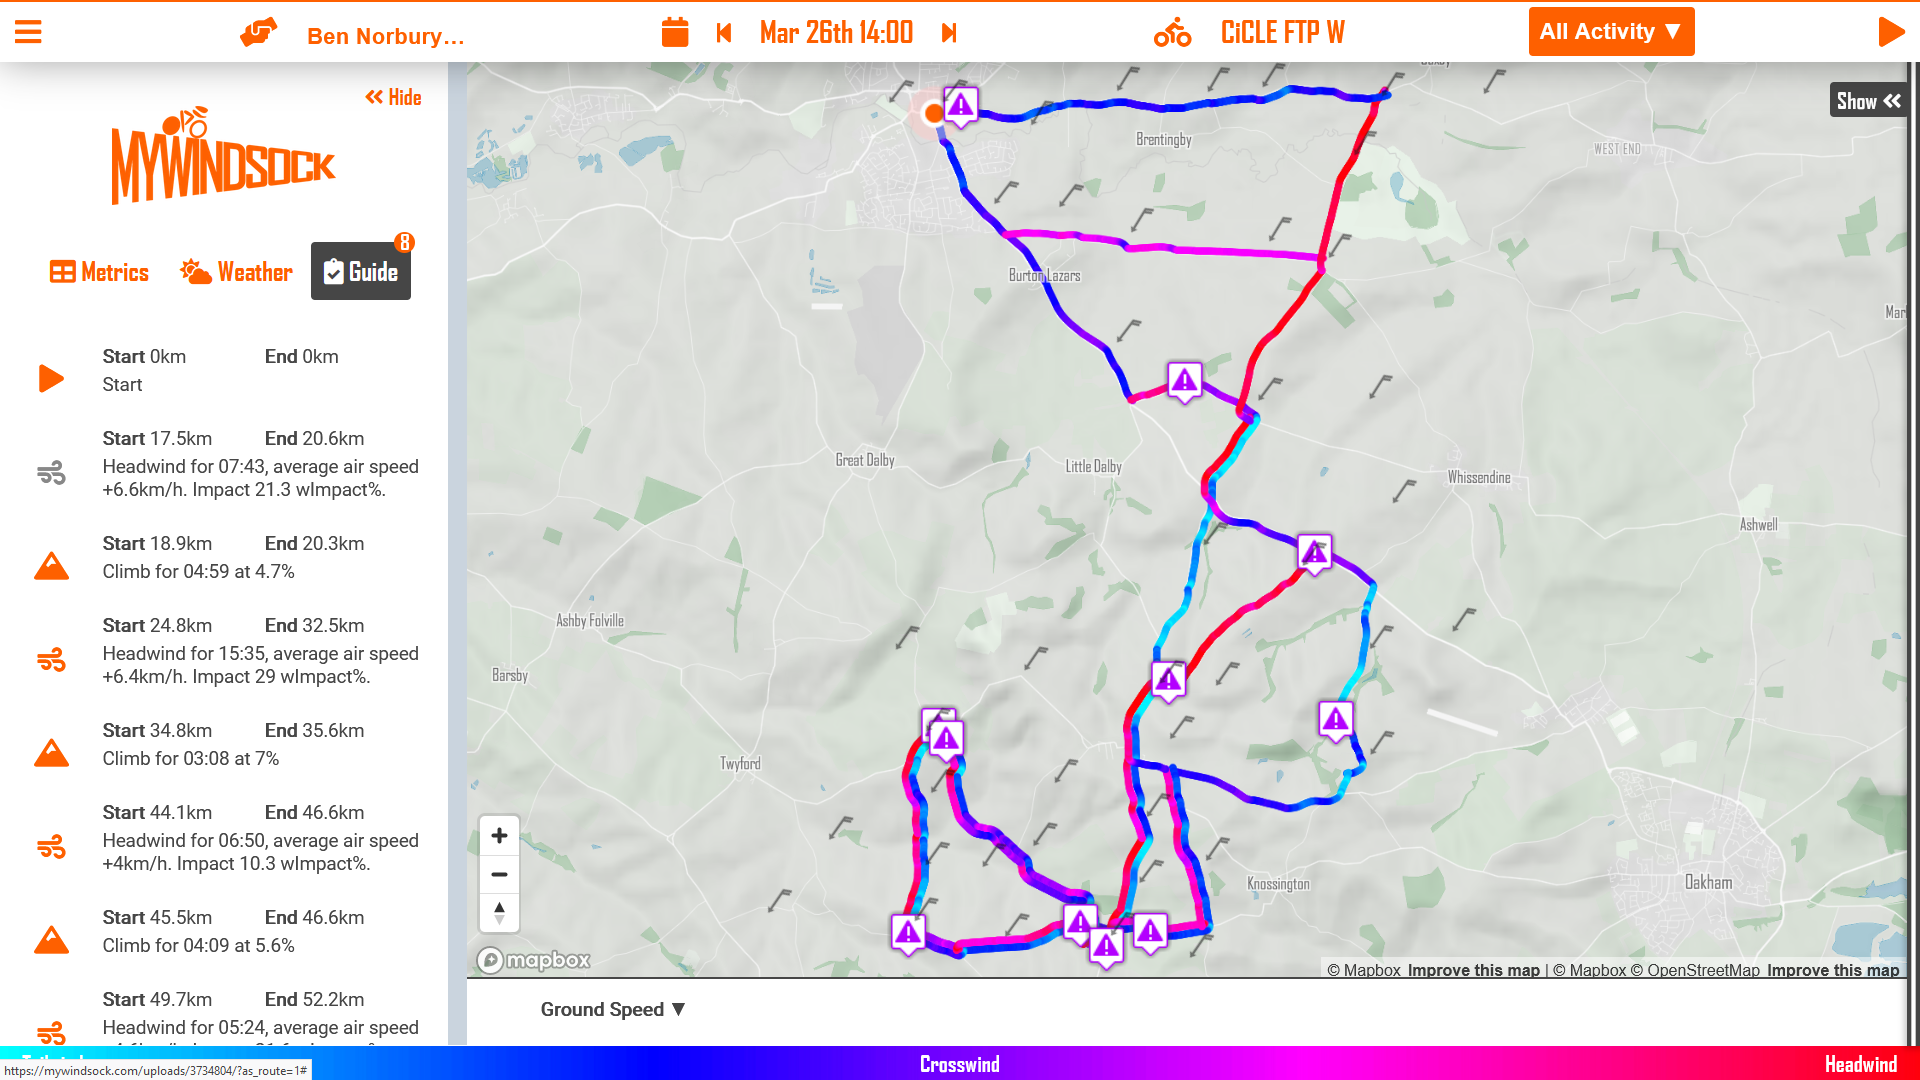
Looking to outsmart the wind? Now you can with live aerodynamic insights from myWindsock, available directly on your Hammerhead device.
Real-Time Insights, Right on Your Handlebars
Take control of your ride with myWindsock’s Hammerhead extension with in-ride data, giving you real-time visibility into key environmental forces:
Wind Visualization – A colour-coded wind field shows real-time wind direction and speed so you can plan ahead.
Forces – Tells you whether to focus on raw power or aerodynamics.
Feels Like Gradient™ – Combines wind and gradient data to reveal how the road actually feels.
Beyond these core features, myWindsock also provides valuable insights into accumulated headwind and current headwind time, allowing riders to track how much they’ve battled the wind and adjust their energy management accordingly. Additionally, yaw angle analysis helps cyclists understand the aerodynamic impact of crosswinds, while Air Speed displays your actual speed through the air, factoring in terrain roughness for precise effort measurement.
How to install
Turn on your Karoo and install the latest app update
You may have seen the headlines describing Strava as “shutting down” their API. As far as we are concerned this is not the case.
What will change
The major change that we are preparing for is removing your ability to share with your friends Strava Activity maps on myWindsock. You will continue to be able to view your own Strava Activity maps on myWindsock.
We are clarifying a few things
We will be clarifying some aspects of the API terms and conditions with Strava. As we get more details we will update you here.
Most importantly, we will always find a way for you to connect your data with us and use our cycling weather and prediction tech.
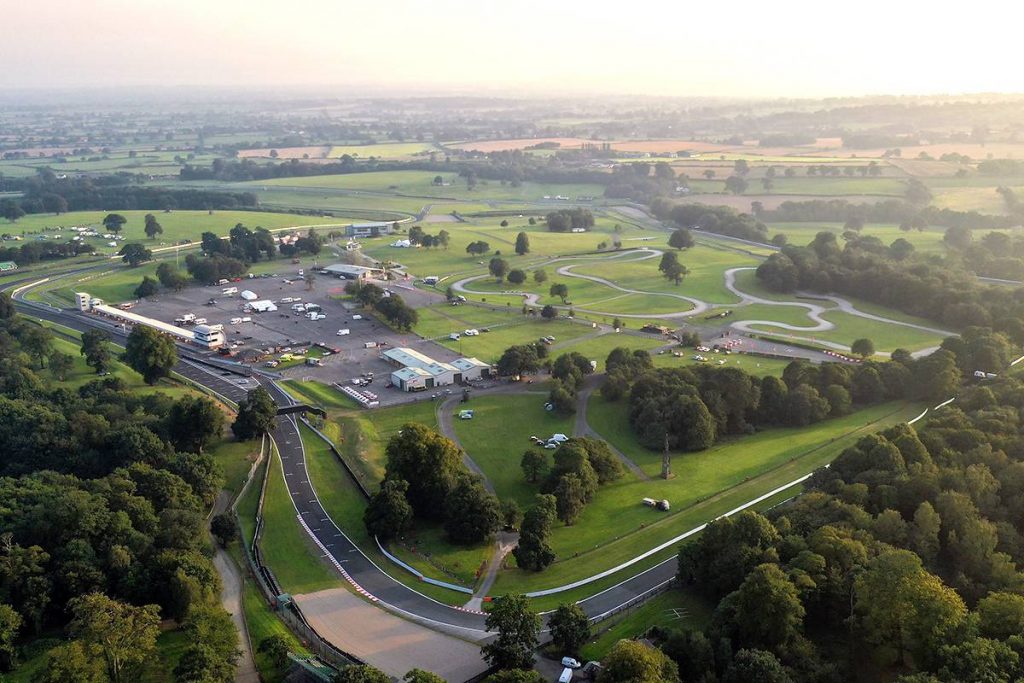
Enjoy your Track Pass ride on the historic, silky smooth, Oulton Park tarmac.
Then, the tension builds, for an “all out”, lung busting, Hot Lap competition.
Proudly supported by
Weather and Predictions for CyclingFor the runners and riders, built on connection and adventure.With over 20 years of experience, GS-JJ specializes in the manufacture of custom promotional products. Our products range from custom medals, enamel pins, coins, keychains, belt buckles, stickers, to lanyards, and many more.
Cycling CdA, also known as Aerodynamic Drag Coefficient (CdA) in the context of cycling, is a crucial concept in the study of aerodynamics that plays a significant role in determining a cyclist’s performance and speed. CdA is a measure of the resistance a cyclist experiences due to air while riding, and it directly affects the energy required to maintain a certain speed.
The CdA value represents the aerodynamic efficiency of a cyclist and their equipment. A lower CdA indicates a more aerodynamic posture and equipment, resulting in reduced air resistance and improved cycling performance. On the other hand, a higher CdA signifies higher air resistance, leading to a decrease in speed and increased energy expenditure.
The CdA equation involves a complex combination of various factors, including the cyclist’s body position, the shape of the bike frame, wheels, and even clothing. Each of these factors contributes to the overall aerodynamic drag that the cyclist experiences while cycling. To determine a cyclist’s specific CdA value, researchers and cyclists often perform CdA tests in controlled environments, such as wind tunnels or virtual simulations.
To simplify the process of calculating CdA, cycling enthusiasts and professionals use myWindsock’s CdA calculator to estimate the aerodynamic drag coefficient based on a ride FIT, TCX or Strava Activity data. As this is myWindsock, environmental factors like wind speed and direction, and air density are included in the calculation.
myWindsock simplifies CdA analysis for every activity
MyWindsock combines weather dynamics and ride data to produce a CdA value for cyclists. By considering real-time weather conditions like wind speed and direction, along with data collected during a ride, such as speed, power output, and elevation, myWindsock can estimate the CdA value more accurately.
Road bike CdA optimization has become a crucial aspect of professional cycling, as even small improvements in aerodynamics can lead to significant advantages in competitive races. Cyclists, coaches, and engineers work together to find the most aerodynamic positions and equipment setups to maximize performance and reduce energy expenditure during races.
In summary, CdA in cycling refers to the Aerodynamic Drag Coefficient, a measure of the resistance a cyclist encounters due to air while riding. It determines how efficiently a cyclist can move through the air, and lower CdA values are sought after to enhance performance. The myWindsock CdA calculator incorporates weather dynamics and ride data, helping cyclists optimize their riding positions and equipment to minimize drag and improve their overall cycling performance. By continually refining their CdA, cyclists can gain a competitive edge and achieve better results in their races.
The UCI Gran Fondo World Championships provide an opportunity for amateur cyclists to compete at a global level and earn the title of world champion in their respective age categories.
The time trial event consists of multiple age categories for both men and women. The participants typically qualify for the UCI Gran Fondo World Championships through national or regional qualifying events, which take place in various countries.
This year’s Championship is East of Dundee in Scotland.
To begin our analysis, we’ll set up our Virtual Athlete as a fairly competitive male age group rider.
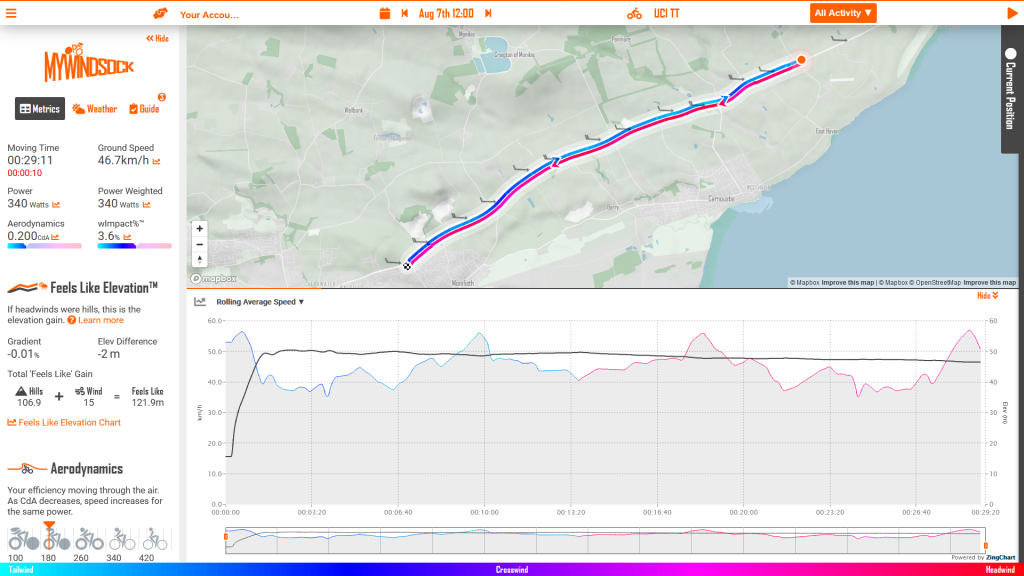
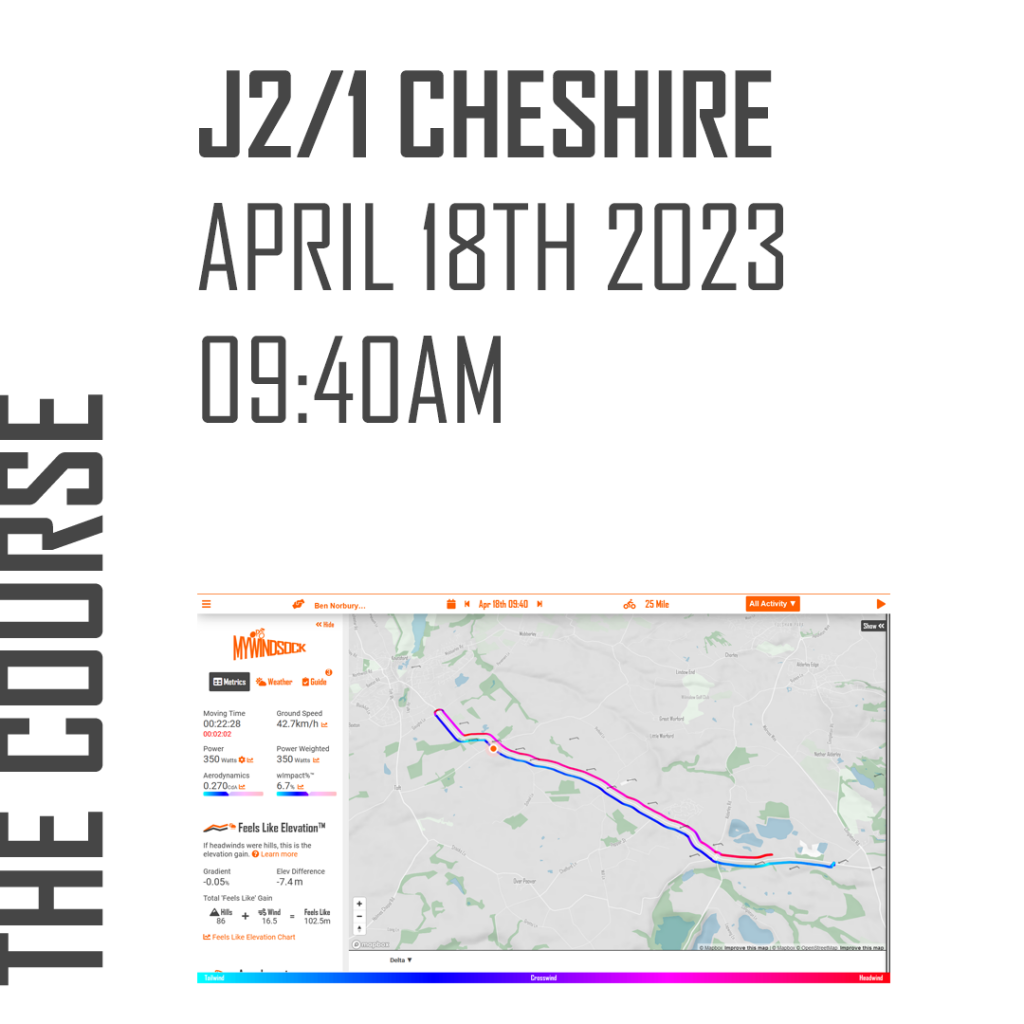
The Course
A 22.7km simple out and back course makes this a straightforward fight of power and aerodynamics between the riders. For riders at mid day the current forecast is a Westerley wind averaging 10mph gusting to 20mph. In some ways this simplifies things further for the riders, tailwind out, headwind back. For the British riders, who are used to their local cycling club time trials and the British weather, there will be a very familiar feel to the event. However, the question that will be high on the riders minds right now is “how do I extract speed from this course for that wind direction?”.
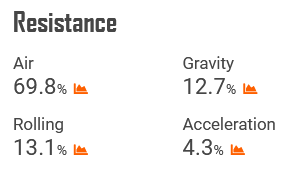
Firstly, is it hilly?
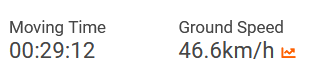
No. Our resistance analysis shows for our virtual rider the most significant force acting against the rider is Air Resistance. That said, in the final 2 minutes of the ride the slope brings our virtual rider down to 30kph, from averaging 47kph this will no doubt feel torturous.
For couple of occasions on the return the speeds will drop.
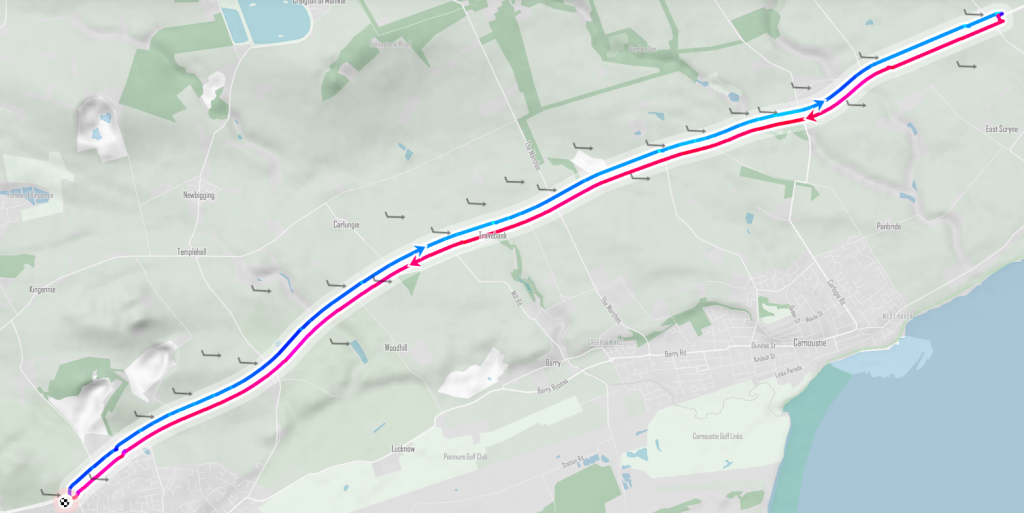
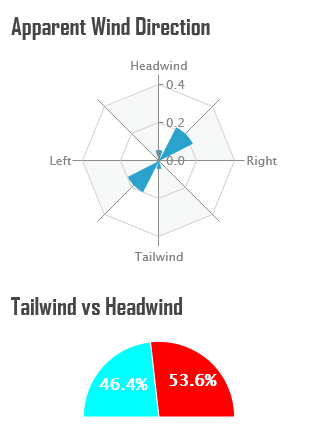
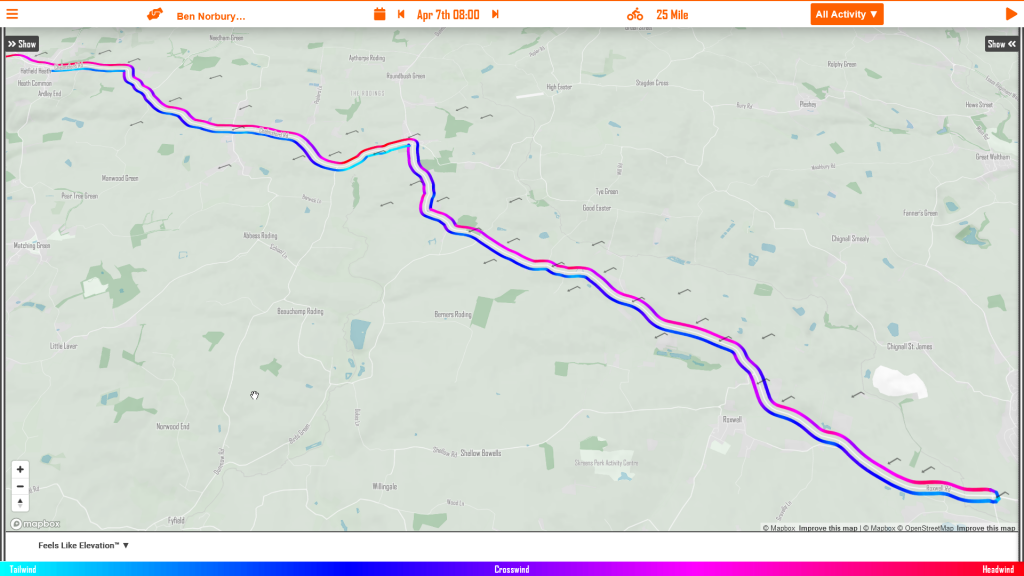
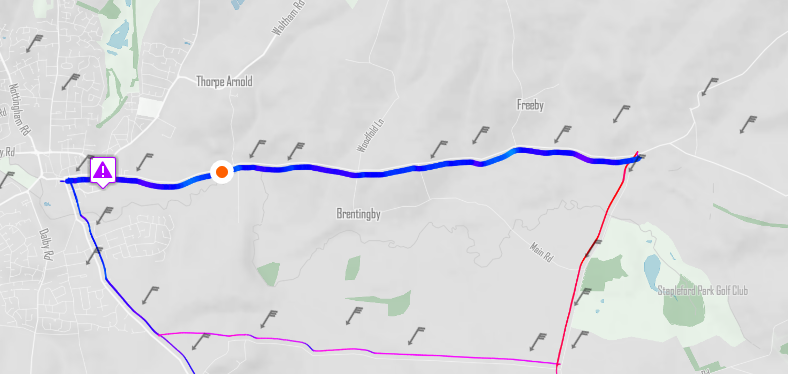
Let’s look at the wind
Blue indicates the outbound tailwind. Red is the return leg, into the wind.A slower return into the wind increases the time spent battling the headwind.
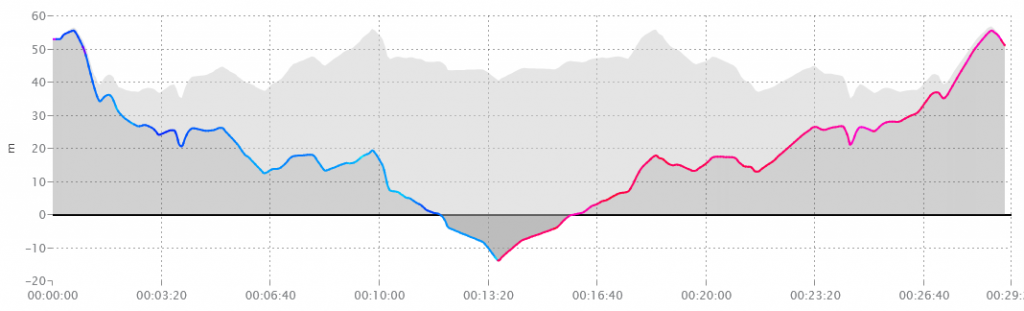
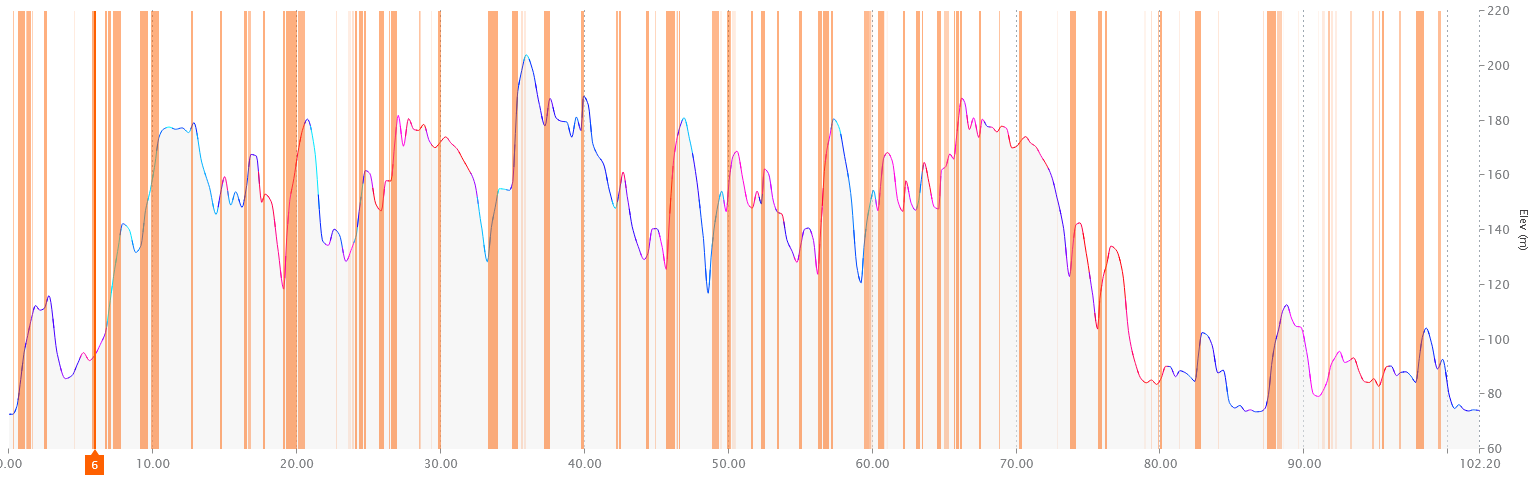
Okay, but how will the ride feel?
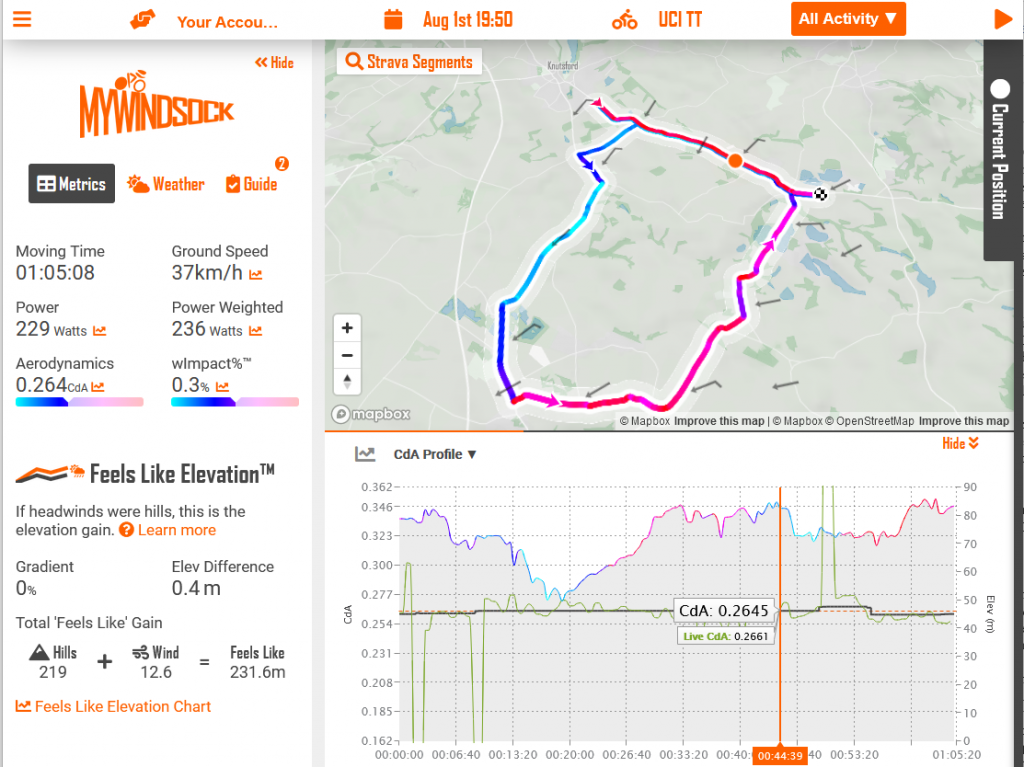
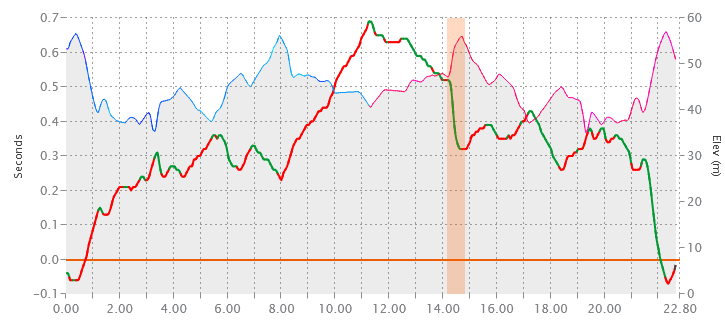
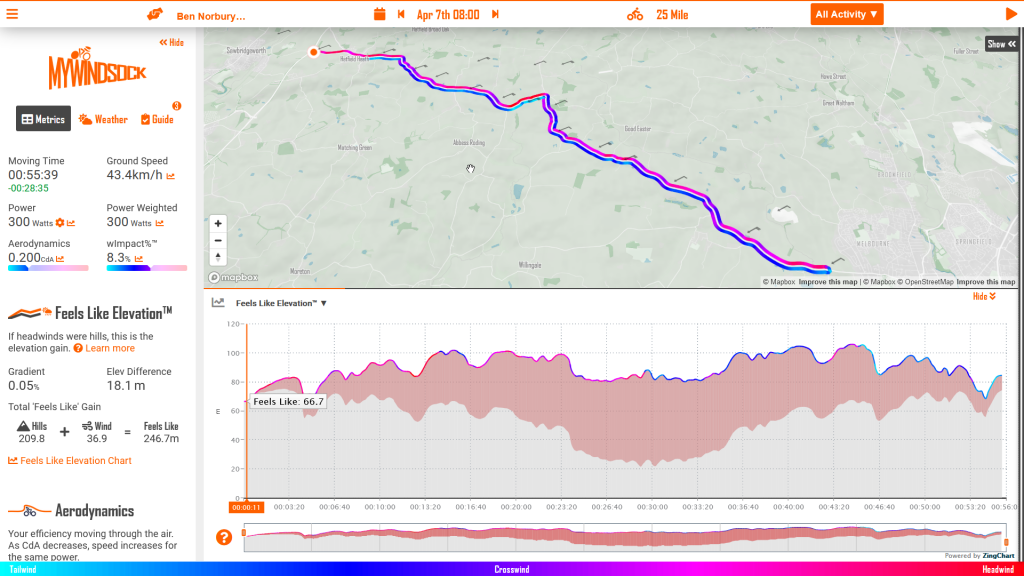
This is where will pull out the myWindsock Feels Like Elevation chart. We’ve combined the wind with the elevation profile to give you an ‘on the bike’ feel when all resistances are considered. Here is what the Feels Like profile looks like. In light grey is the elevation, the coloured profile is the Feels Like Elevation profile. The tailwind start gives a significantly easier feel to the road than the traditional profile suggests.
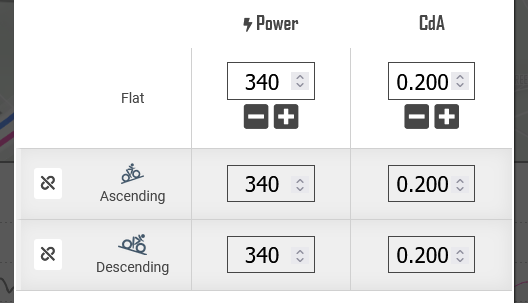
Using a typical time trial positions of 0.200 CdA and 340 Watts, your own setup my give a different graph.
Pacing
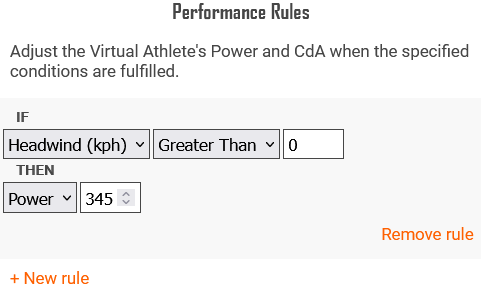
Now we turn to that crucial question for the competitors, “how do I pace it?”. To do this let’s use some myWindsock rules.
Performance rules enable you to experiment with various cycling scenarios.
Firstly an evenly paced ride at 340 Watts.
Next, more power during tailwind
Our virtual rider is averaging 340 Watts. Let’s add a rule to push an extra 5 Watts during the tailwind and 5 Watts less for the Headwind. A difference of 10 Watts. The result…
No difference. (We did have to double check that)
Next, more power during the headwind
So this time we flip the scenario and put out the extra 10 Watts during the headwind. Let’s see what this does to our virtual rider’s time.
A small advantage of 3 seconds. So if in doubt an evenly paced ride with a slight bias to the return leg would be our recommendation.
Increasing power on the slopes
Next we look at the advantages of adding more power during the slopes. In our analysis there are two locations you want to be strong. Both occur on the return leg.
We increased our Virtual riders power by 5 Watts. The Delta Variance chart shows in green where these 5 Watts return the greatest reduction in time. On the return leg, there is more green. Thiw was anticipated by our previous experiment which increased our power on the return into the headwind and gave us a 3 second advantage for the same overall power.
However we now see where the gains are (in green). Our advice, be strong at 14km and in the final 2km give it everything.
Delta Variance. Time is saved at the greatest rate where green.
In Summary
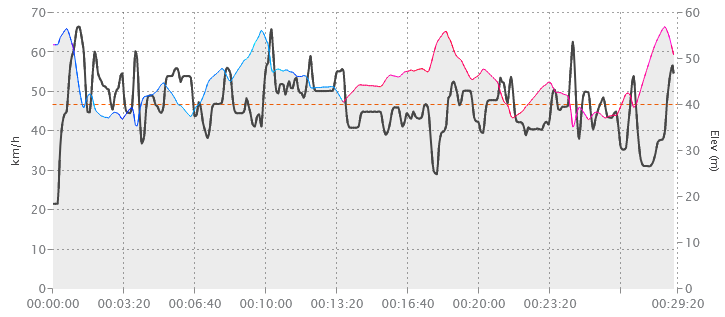
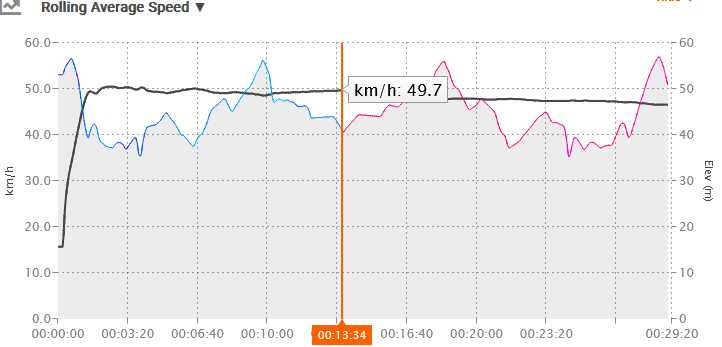
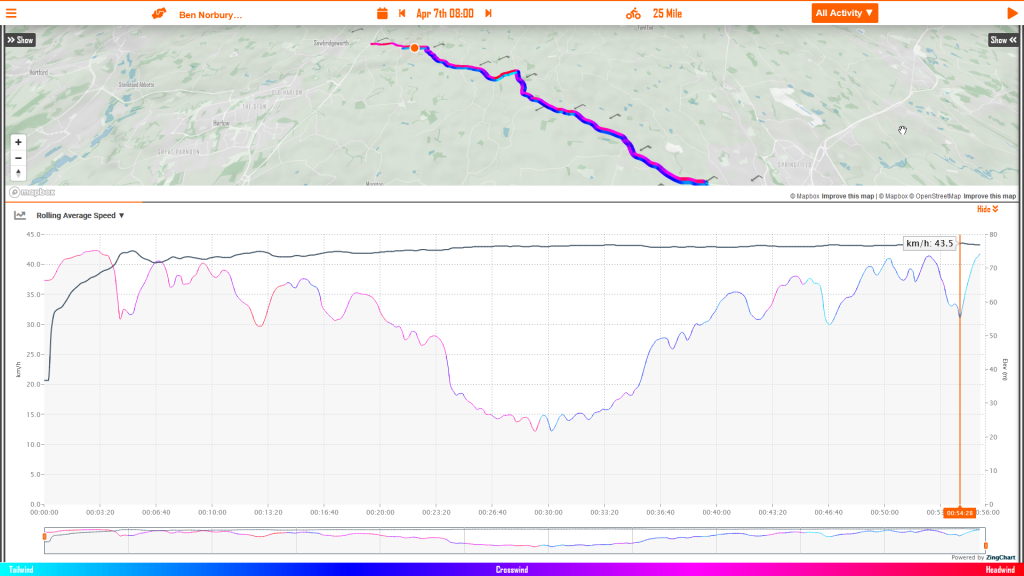
To finish off our analysis, we turn to the rolling average speed graph. This gives us a picture of how our average speed will evolve during the time trial. This way we know what to anticipate speed wise.
The Rolling Average Speed graph shows the evolution of your average speed during your ride
A rapidly increasing average speed peaking at the turn. The return into the headwind sees the average speed drop by around 2kph by the finish.
So overall our recommendation is to ‘bide your time’ on the out leg and ensure there is something left for the final couple of km. If you are competing on Monday, view the current forecast and have a fantastic ride!
Imagine a world where every pedal stroke you take not only captures data on your cycling performance but also unveils deeper insights into your future rides. With myWindsock’s revolutionary weather modeling technology, your power meter’s data becomes a gateway to enhanced weather forecasts and performance insights.
Unveiling the Power of Weather Modeling
At the heart of myWindsock lies its advanced weather modeling capabilities. By combining cutting-edge artificial intelligence algorithms with real-time weather data, myWindsock creates a comprehensive picture of atmospheric conditions specifically tailored to the locations and routes where you ride. But what sets myWindsock apart is its unique integration with your power meter data, elevating the weather modeling process to new heights.
The Marriage of Power Meter Data and Weather Modeling
myWindsock analyzes your performance data with key external factors like wind, temperature, and elevation. This sport specific analysis enhances its weather models, resulting in highly accurate forecasts customized for your unique cycling conditions.
Unlocking your Aerodynamics
The true magic happens when myWindsock leverages the power of your power meter data and refined weather models to provide aerodynamic insights. Using your power meter to improve your aerodynamics is the single biggest return on your investment.
The benefits of Premium
Enhance your rides by adding aerodynamics analysis to every Strava activity or uploaded file. Benefit from AI-powered forecasting, leveraging your past data to plan and optimize future activities. Gain valuable insights and improve your performance as you ride faster and explore new horizons. Embrace myWindsock’s features and unlock the full potential of your cycling experience.
Get all this data from a myWindsock Premium account. Learn more here
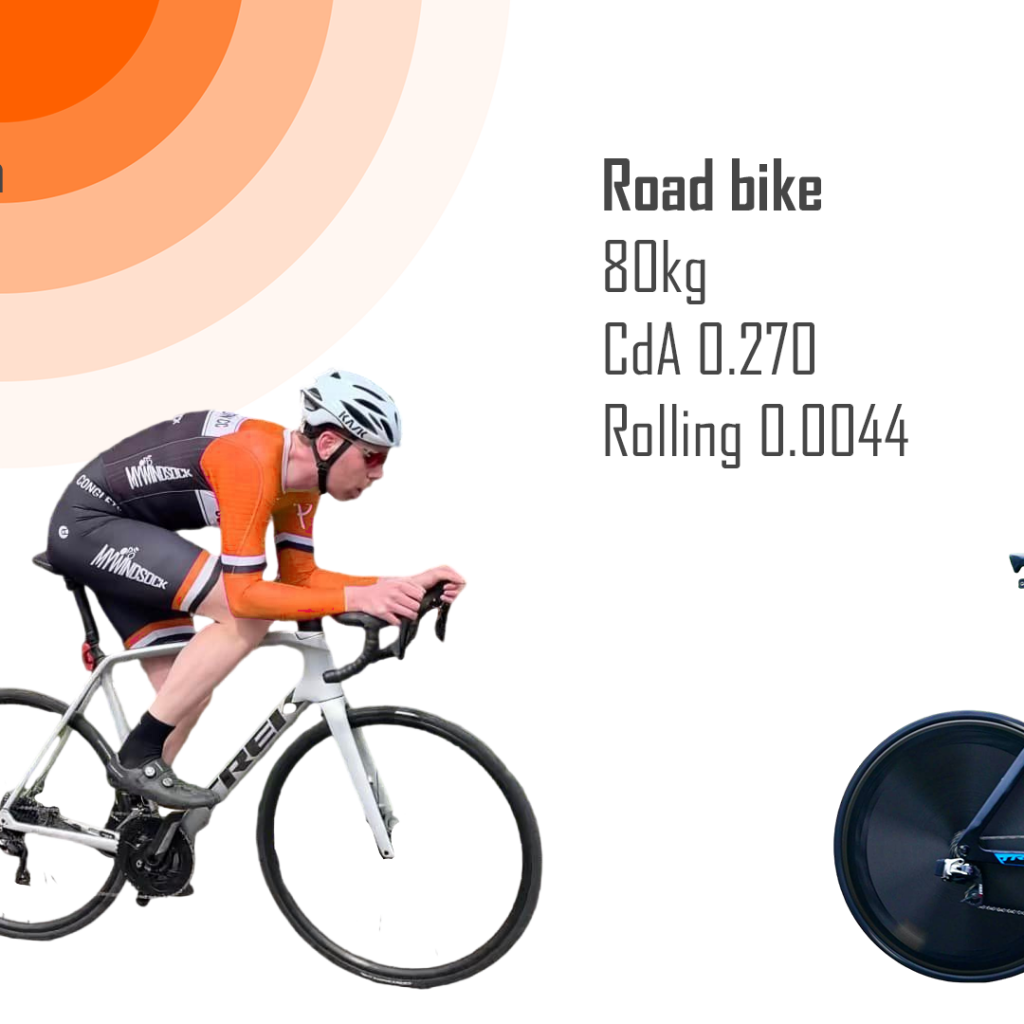
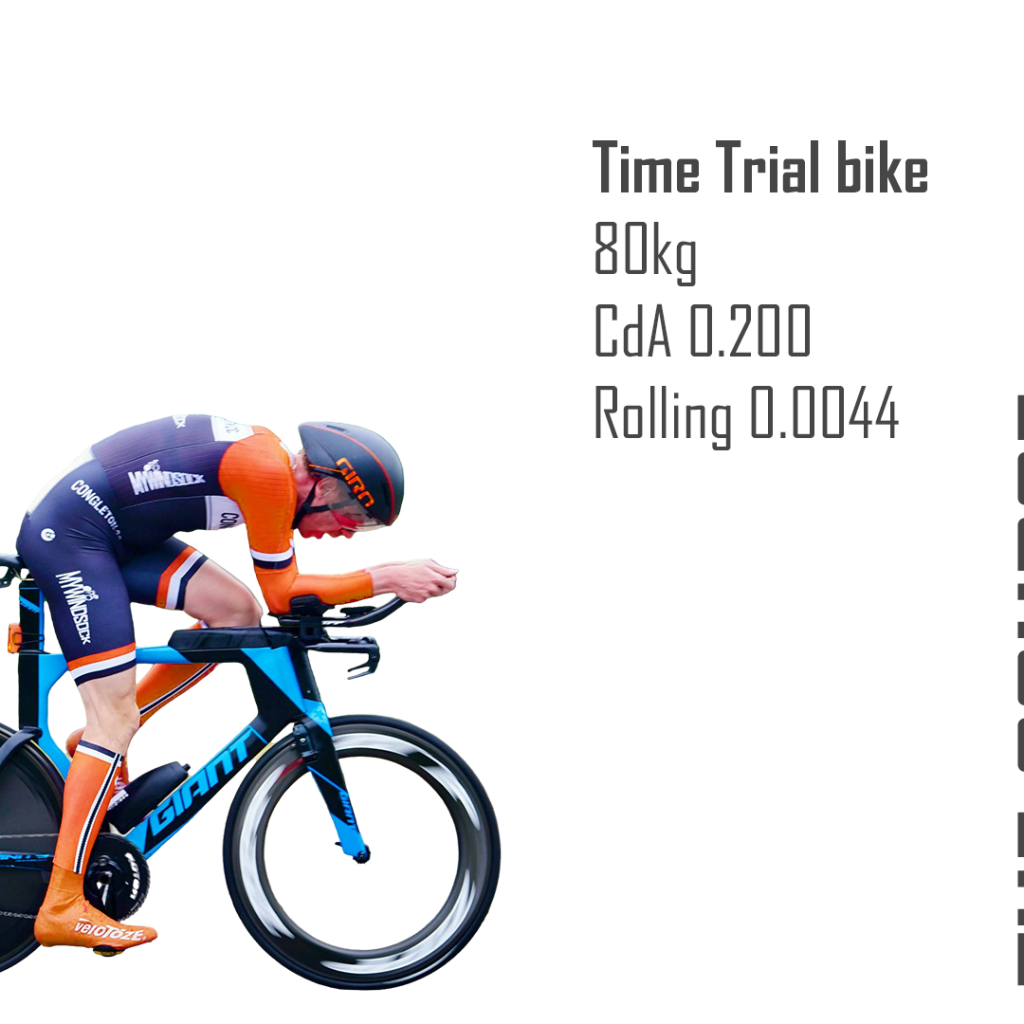
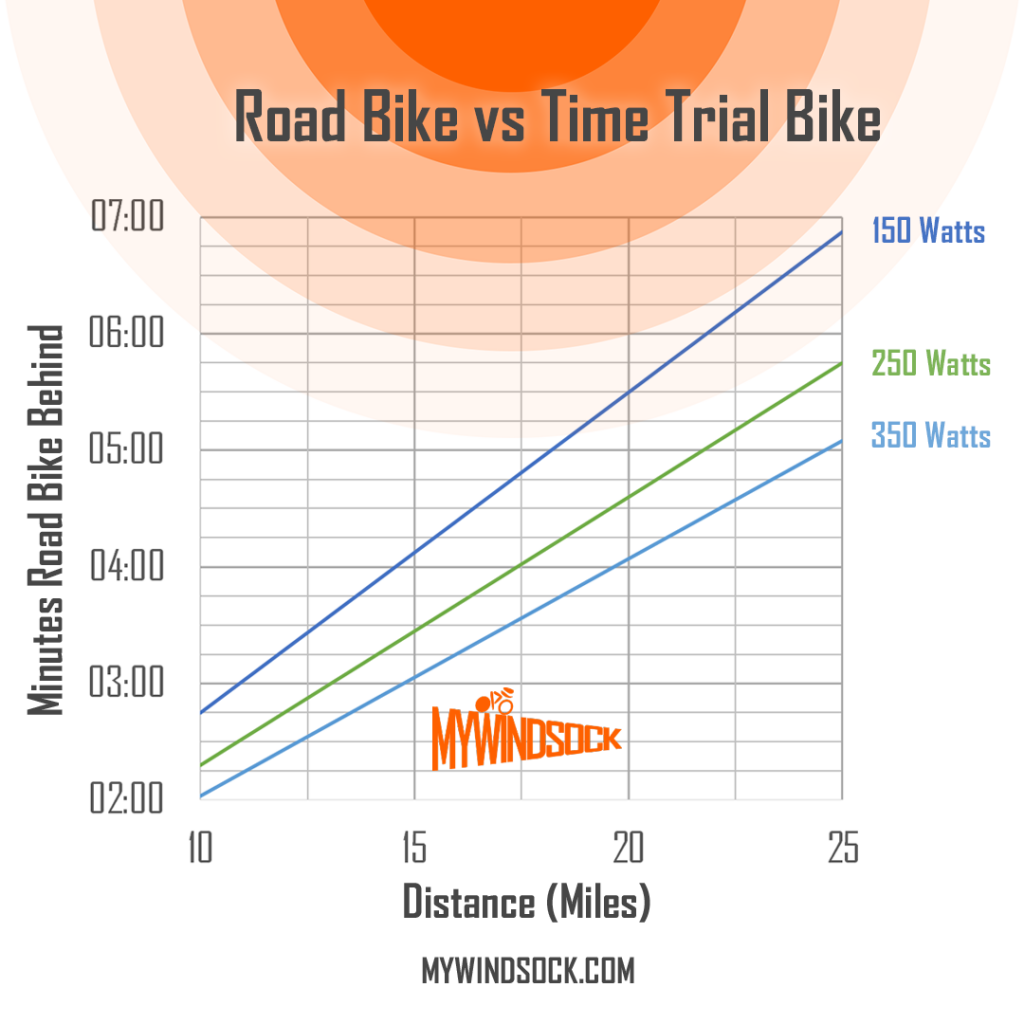
Using myWindsock’s cycling physics engine we raced two bikes. One a road bike and the other a time trial bike. We raced the three times at different power outputs, 150, 250 and 350 Watts. These are the sort of power numbers that might represent what a beginner, intermediate and advanced rider might do for a 25 mile time trial.
We have used a myWindsock forecast in order to see the impact of the time trial bike on the road. You’ll notice from the graphic below that we have kept the system mass and rolling resistance the same such that the difference is solely due to the time trial bike.
The course we chose was a typical UK 10 mile time trial course. You can view this course here. All Cycling Time Trials courses are available to view in myWindsock.
The Result
Below are the results of the test. On the left we have the time lost by the road bike and the distance travelled along the bottom.
Conclusion
As expected the time trial bike is significantly faster than the road bike. For a rider producing 150 Watts they will lose close to 7 minutes on a road bike. We often hear people saying “I’m not fast enough for a time trial bike”, however what is clear from the above graph is, the less power you have the more time you will lose choosing the less aerodynamic option. In terms of absolute time savings, a TT bike is better value for a slower rider!
Why is a time trial bike faster?
A time trial bike is designed to be faster than a traditional road bike, hence the price hike, in time trials for a few key reasons:
Aerodynamics: Time trial bikes are designed with aerodynamics in mind. The frame, wheels, and components are shaped to reduce air resistance, allowing the rider to move through the air more efficiently. Much of this comes from the position the rider is able to hold due to the arm rests and aero-extensions. This position is not allowed in traditional bunch racing due to the chance of a crash as the brakes can’t be immediately reached.
Geometry: Time trial bikes have a more aggressive geometry than traditional road bikes, with a steeper seat tube angle and longer top tube. This puts the rider in a more aerodynamic position than they’d be able to achieve on a road bike with clip on bars, reducing wind resistance even further.
Integrated components: Time trial bikes often feature integrated components, such as handlebars and brake levers, which further reduce drag and streamline the bike’s profile. This can make them difficult to work on – often turning what would be a simple fix on a road bike into a complicated job for a mechanic in a bike shop.
Wheel choice: Time trial bikes often use deeper section wheels, which are more aerodynamic than traditional road bike wheels. Wheels deeper than 90mm aren’t allowed under CTT’s (the UK’s governing body for time trials) road bike TT rules.
All of these factors combine to make time trial bikes faster than traditional road bikes in time trials. However, it’s important to note that time trial bikes are not necessarily faster in all situations. They are designed specifically for time trials, and may not be as comfortable or efficient for longer, more varied rides.
If you’re looking to get into time trials but are worried about not having the right equipment – Cycling Time Trials have introduced a road bike category at all their events! Make sure you’re prepared with myWindsock – perfect for planning and analysing your time trials.
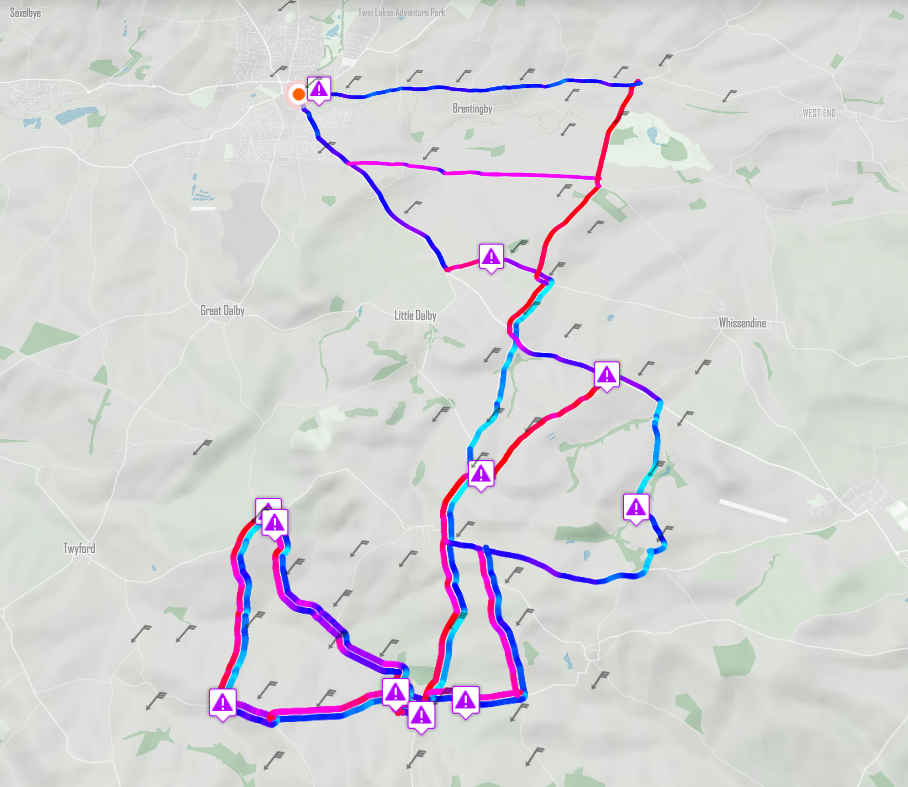
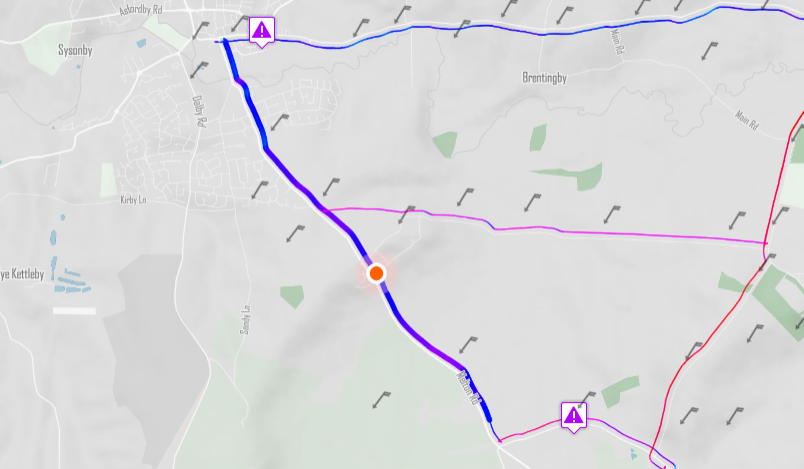
The Wind Lines on the myWindsock map give you an intuitive view of the course and the prevailing wind direction. The Wind Lines are colour coded blue for tailwind, red for headwinds. See the wind arrows, they show the wind direction and the wind speed for all locations on the route. See wind arrow icons for more details.
2. Feels Like Elevation
Knowing what to expect is a crucial part of your pre race preparation. The Feels Like Elevation chart is the perfect chart to describe how the road will feel when the elevation has been adjusted for the wind resistance. You now know just how the road will feel.
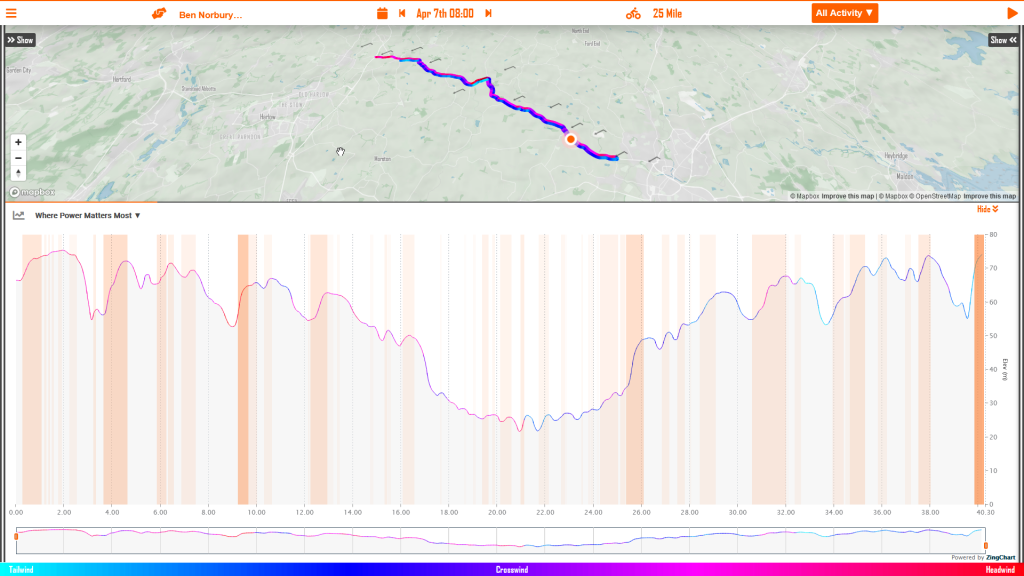
3. Where power matters most
Knowing where to focus your precious energy is a crucial part of time trialing. This is where the chart “Where Power Matters Most” is a vital tool in your pre race preparation. The orange sections on this chart show where power has the greatest affect on your time. The deeper the orange the more important those Watts are!
4. Rolling Average Speed
Now this one is for your Chimp, you know that voice that is saying, “you’re going too slow!”. This chart shows how you can expect your average speed to change during the event. For example, an uphill or headwind start will keep your average speed lower than your target average speed. The better way is to understand how your average speed will evolve from the start to finish so you can stick to your plan.
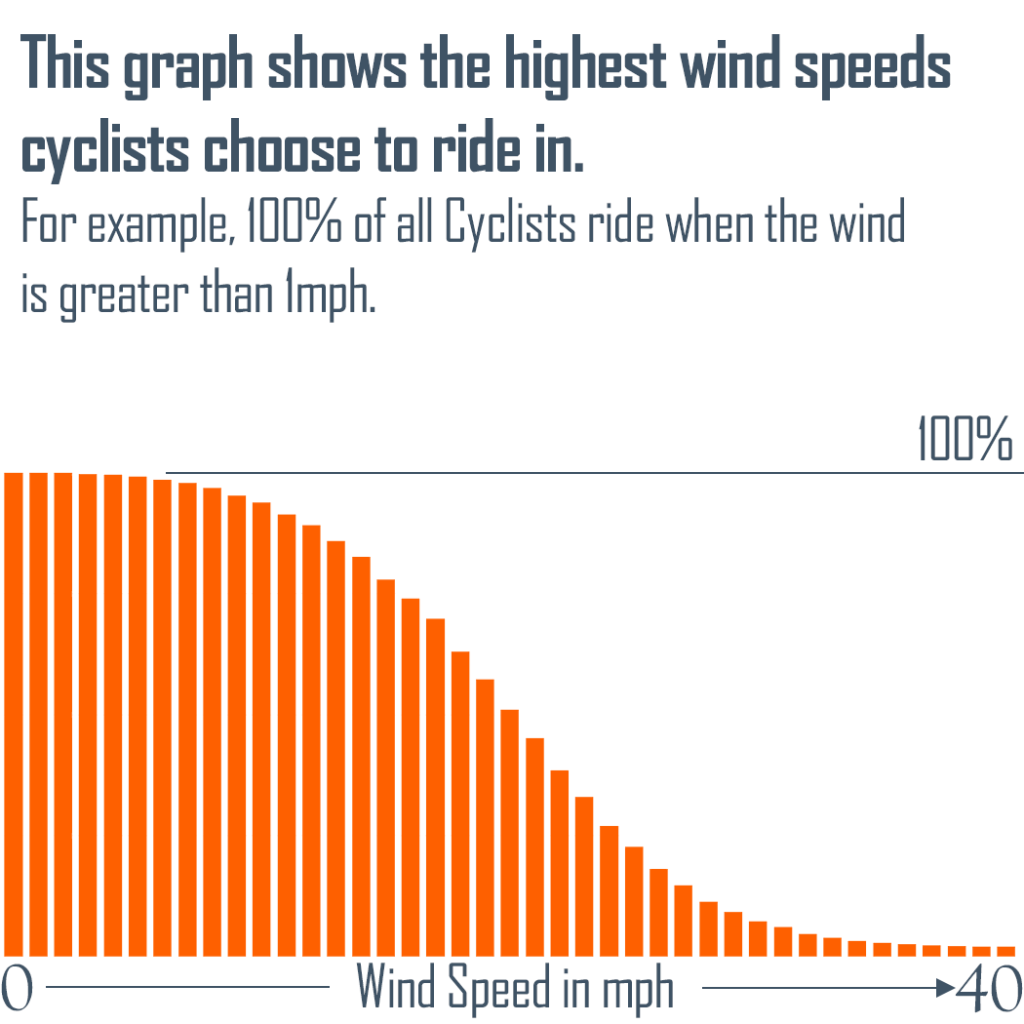
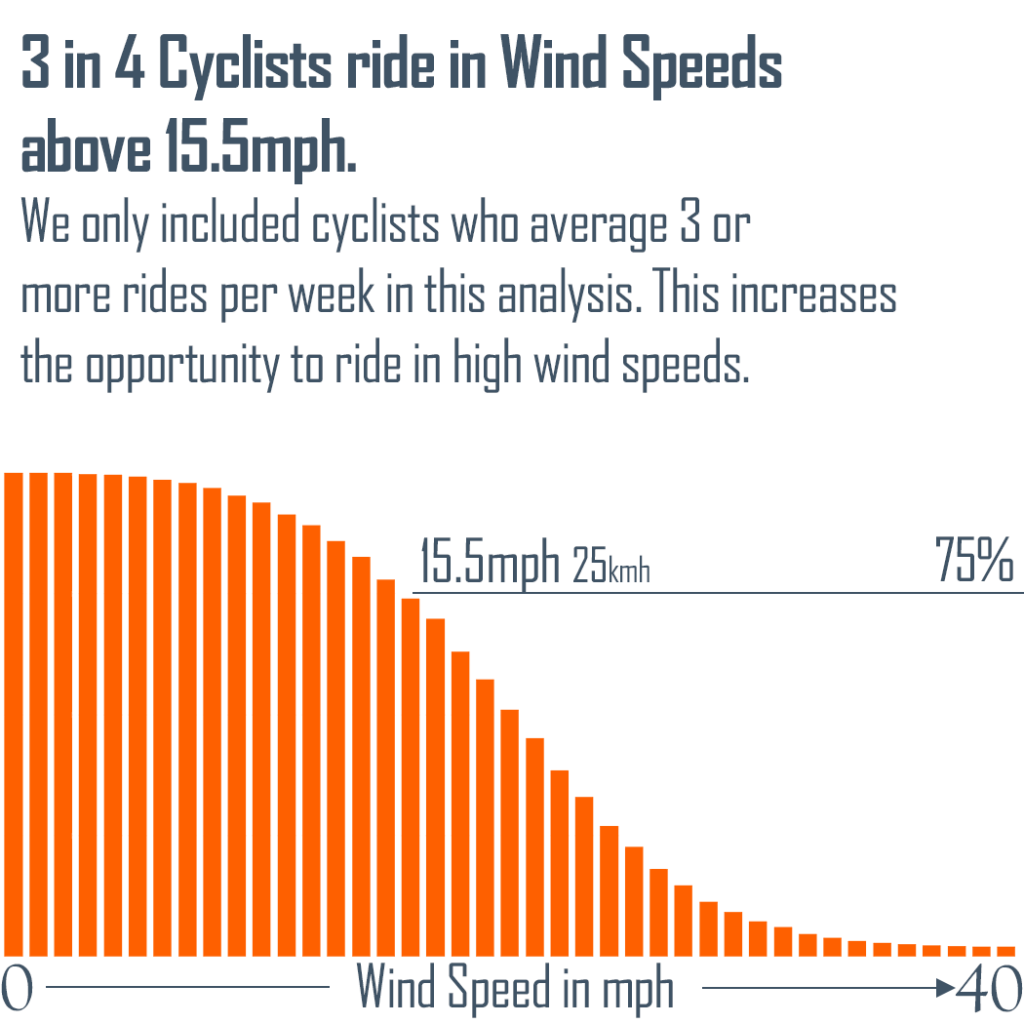
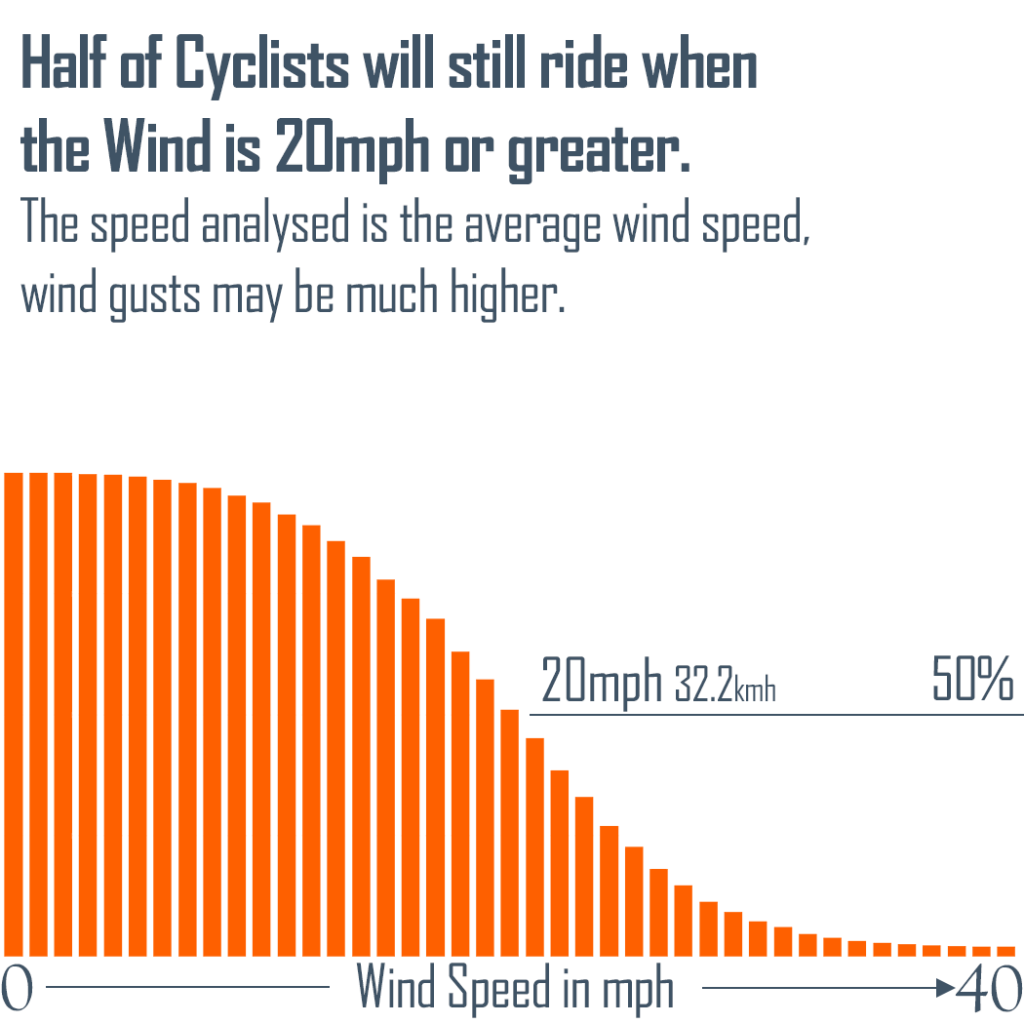
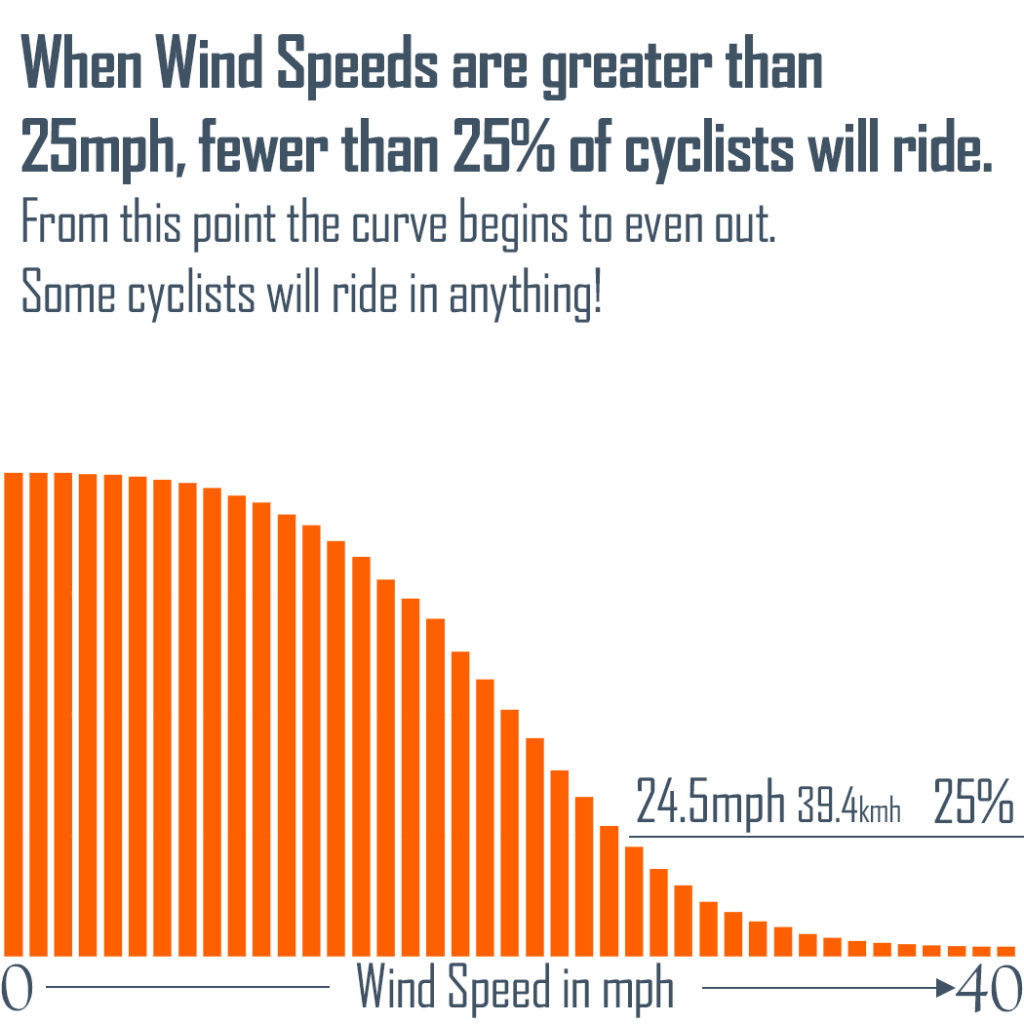
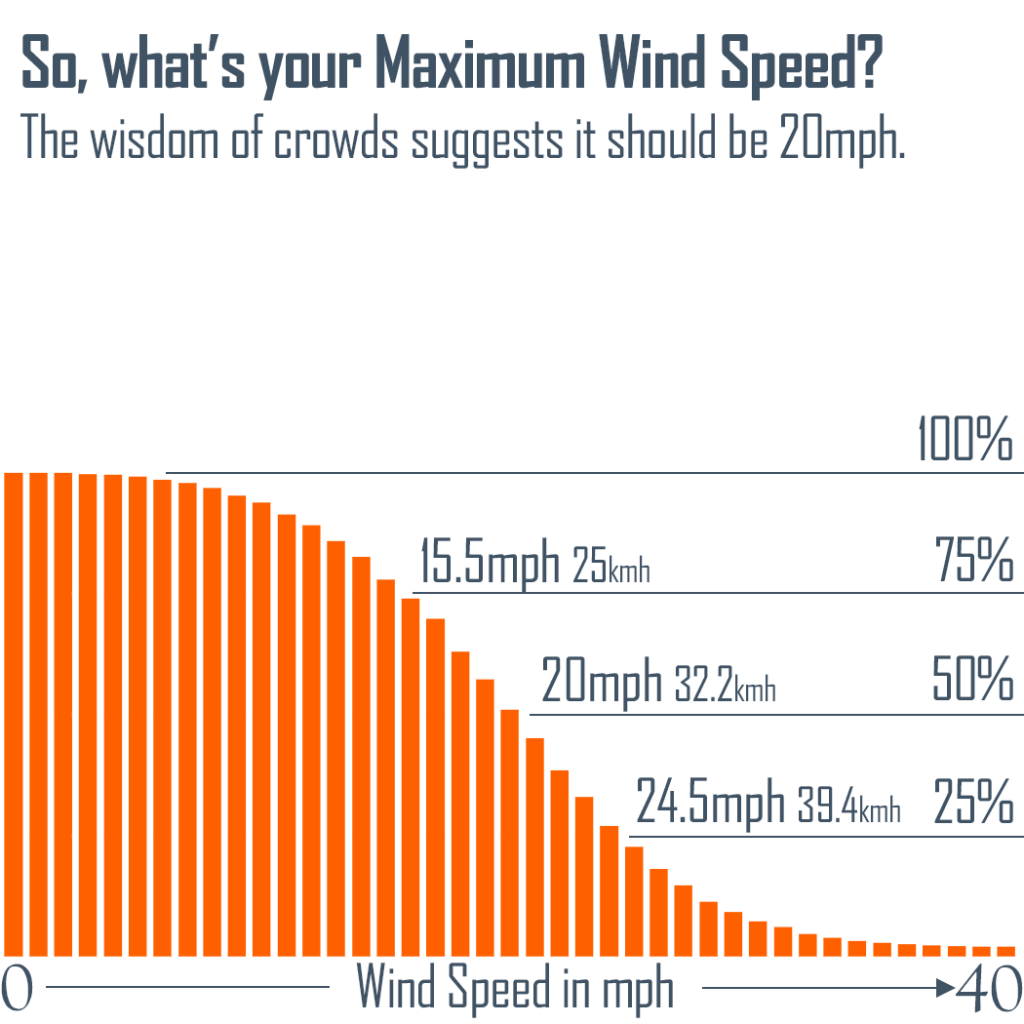
How windy is too windy? We’ve analysed the weather of millions of bike rides. Here’s what we found in answer to this question.
You may be wondering, “what is the maximum safe wind speed for cycling?”. Whilst this will largely depend on your experience as a cyclist, we decided to look at our weather analysis of millions of bikes rides for the answer.
It seems that most cyclists do not cycle when the wind is above 20 mph average wind speed. Remember gusts will often be much higher than the average wind speed. We advise you to ride in weather that you feel comfortable and not to take risks.