


The UCI Gran Fondo World Championships provide an opportunity for amateur cyclists to compete at a global level and earn the title of world champion in their respective age categories.
The time trial event consists of multiple age categories for both men and women. The participants typically qualify for the UCI Gran Fondo World Championships through national or regional qualifying events, which take place in various countries.
This year’s Championship is East of Dundee in Scotland.
To begin our analysis, we’ll set up our Virtual Athlete as a fairly competitive male age group rider.
The Course
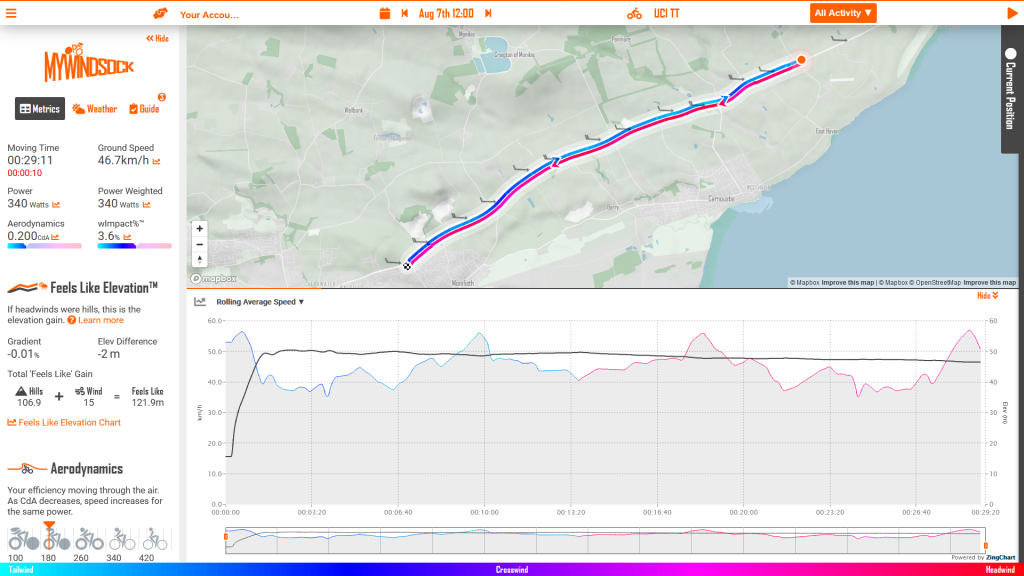
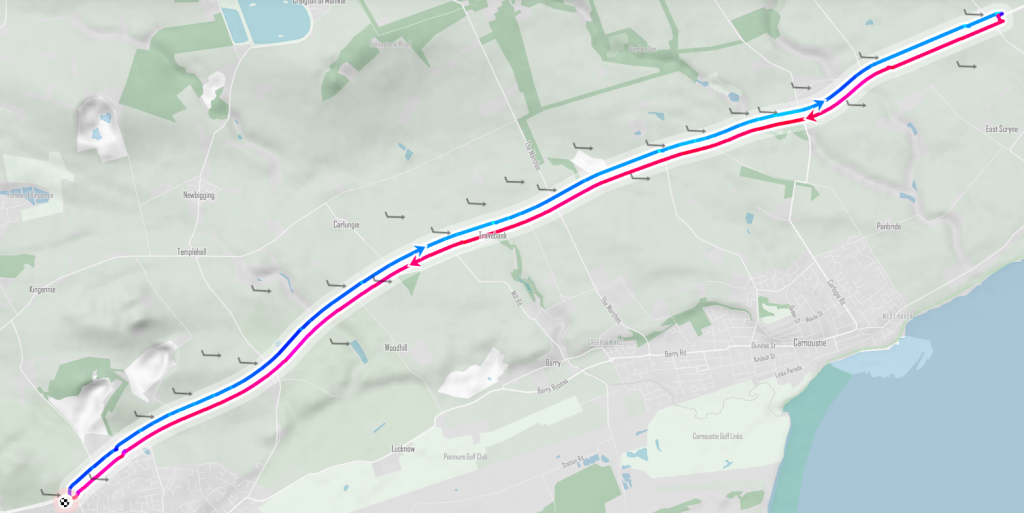
A 22.7km simple out and back course makes this a straightforward fight of power and aerodynamics between the riders. For riders at mid day the current forecast is a Westerley wind averaging 10mph gusting to 20mph. In some ways this simplifies things further for the riders, tailwind out, headwind back. For the British riders, who are used to their local cycling club time trials and the British weather, there will be a very familiar feel to the event. However, the question that will be high on the riders minds right now is “how do I extract speed from this course for that wind direction?”.
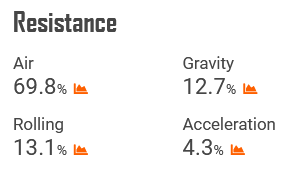
Firstly, is it hilly?
No. Our resistance analysis shows for our virtual rider the most significant force acting against the rider is Air Resistance. That said, in the final 2 minutes of the ride the slope brings our virtual rider down to 30kph, from averaging 47kph this will no doubt feel torturous.
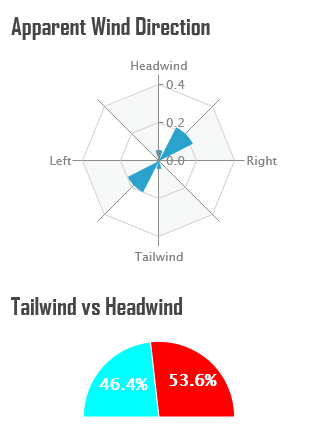
Let’s look at the wind
Okay, but how will the ride feel?
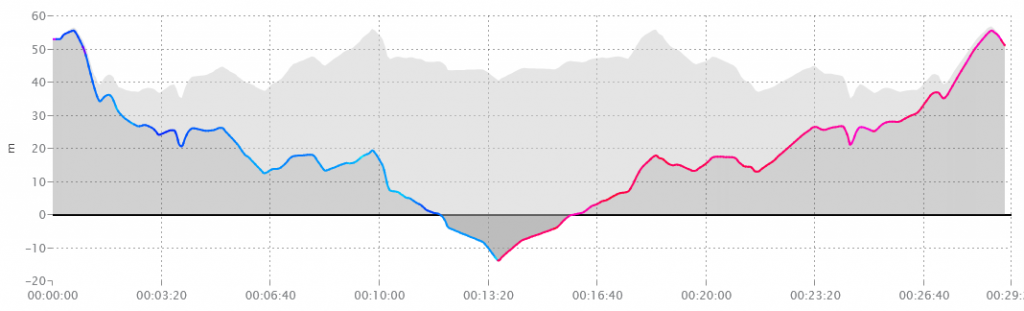
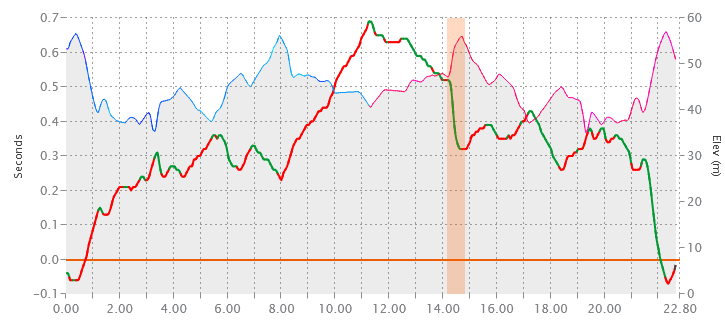
This is where will pull out the myWindsock Feels Like Elevation chart. We’ve combined the wind with the elevation profile to give you an ‘on the bike’ feel when all resistances are considered. Here is what the Feels Like profile looks like. In light grey is the elevation, the coloured profile is the Feels Like Elevation profile. The tailwind start gives a significantly easier feel to the road than the traditional profile suggests.
Pacing
Now we turn to that crucial question for the competitors, “how do I pace it?”. To do this let’s use some myWindsock rules.
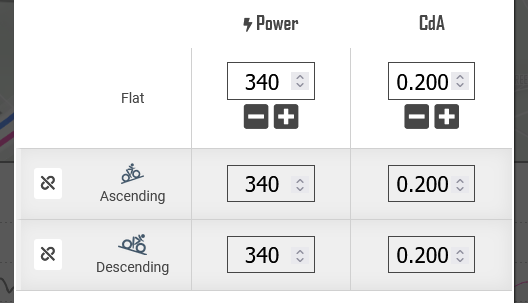
Firstly an evenly paced ride at 340 Watts.
Next, more power during tailwind
Our virtual rider is averaging 340 Watts. Let’s add a rule to push an extra 5 Watts during the tailwind and 5 Watts less for the Headwind. A difference of 10 Watts. The result…
No difference. (We did have to double check that)
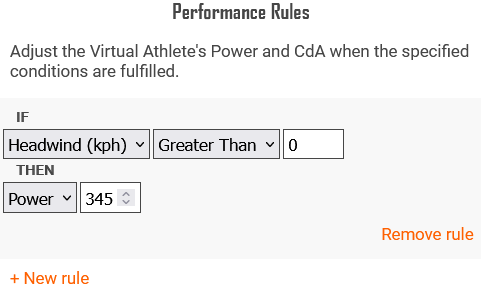
Next, more power during the headwind
So this time we flip the scenario and put out the extra 10 Watts during the headwind. Let’s see what this does to our virtual rider’s time.
A small advantage of 3 seconds. So if in doubt an evenly paced ride with a slight bias to the return leg would be our recommendation.
Increasing power on the slopes
Next we look at the advantages of adding more power during the slopes. In our analysis there are two locations you want to be strong. Both occur on the return leg.
We increased our Virtual riders power by 5 Watts. The Delta Variance chart shows in green where these 5 Watts return the greatest reduction in time. On the return leg, there is more green. Thiw was anticipated by our previous experiment which increased our power on the return into the headwind and gave us a 3 second advantage for the same overall power.
However we now see where the gains are (in green). Our advice, be strong at 14km and in the final 2km give it everything.
In Summary
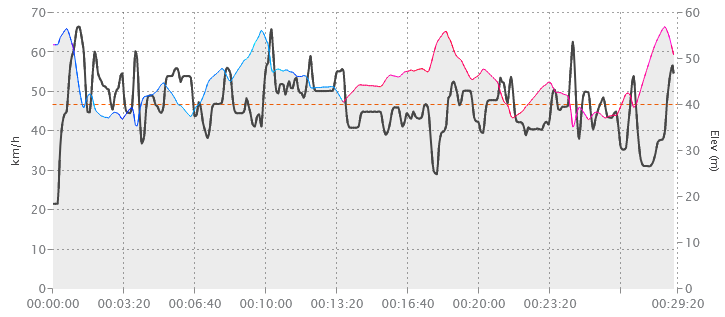
To finish off our analysis, we turn to the rolling average speed graph. This gives us a picture of how our average speed will evolve during the time trial. This way we know what to anticipate speed wise.
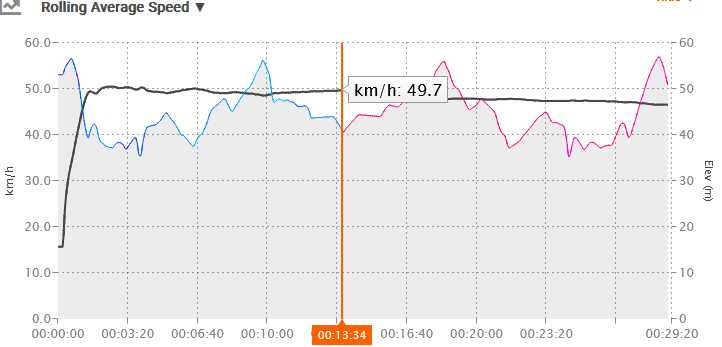
A rapidly increasing average speed peaking at the turn. The return into the headwind sees the average speed drop by around 2kph by the finish.
So overall our recommendation is to ‘bide your time’ on the out leg and ensure there is something left for the final couple of km. If you are competing on Monday, view the current forecast and have a fantastic ride!