Runners are getting faster, whether it’s shoe tech, altitude or something in the water there’s no denying that the times are getting fast. As we know, aerodynamic resistance increases with the cube of speed which means the impact of aerodynamics becomes important very quickly. Recently, we’ve seen an example of this.
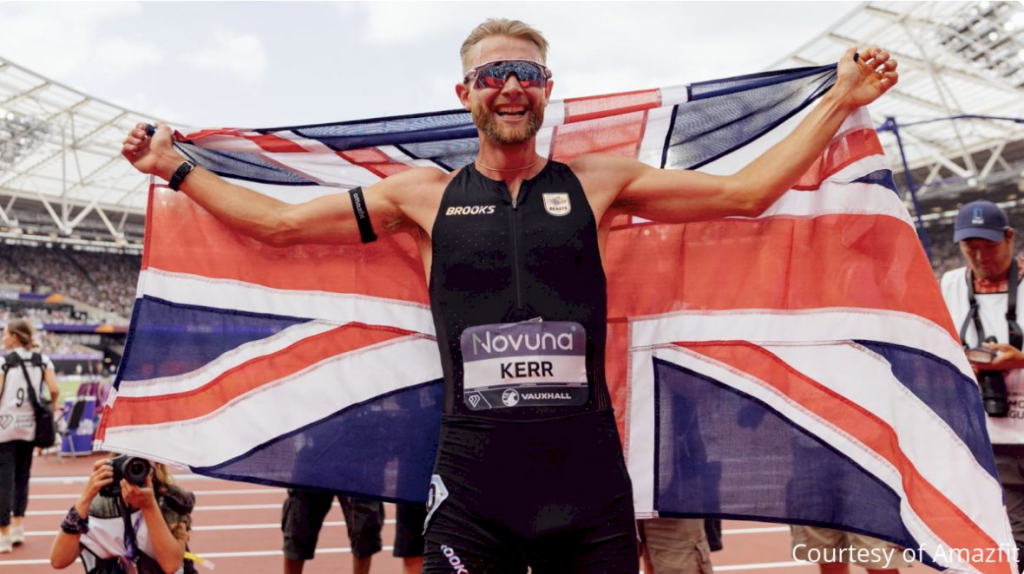
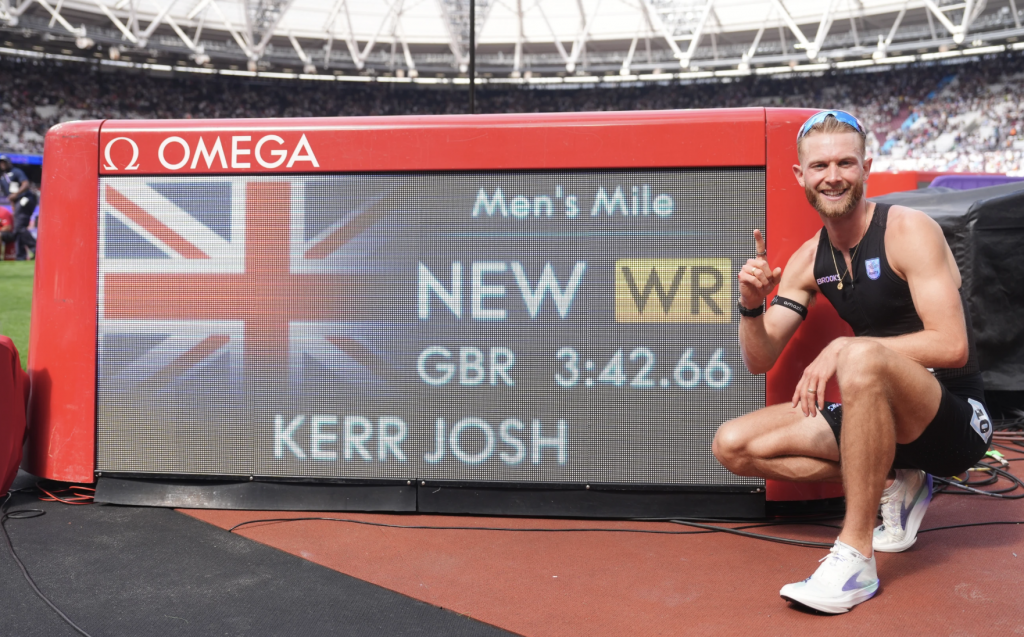
When Josh Kerr broke the mile world record he added his name to a list of record holders that had not been changed for 27 years. Clocking 3:42.66, the British 28-year-old took 0.47 off the world record running at a speed of 25.93 km/hour.
Kerr’s attempt was planned months in advance. Rather than quietly targeting the record, he publicly committed to it, building an entire training cycle around running one mile faster than anyone in history. Every decision was made with a single objective in mind.
Training, of course, was the foundation, but the margins came from everything around it. Kerr and coach Danny Mackey leaned heavily on physiological data, monitoring sleep, recovery and heart rate variability to balance workload and reduce the risk of overtraining. Away from the track, he installed an altitude chamber in his bedroom and an oxygen-enriched training room at home, allowing him to maximise adaptation between sessions.
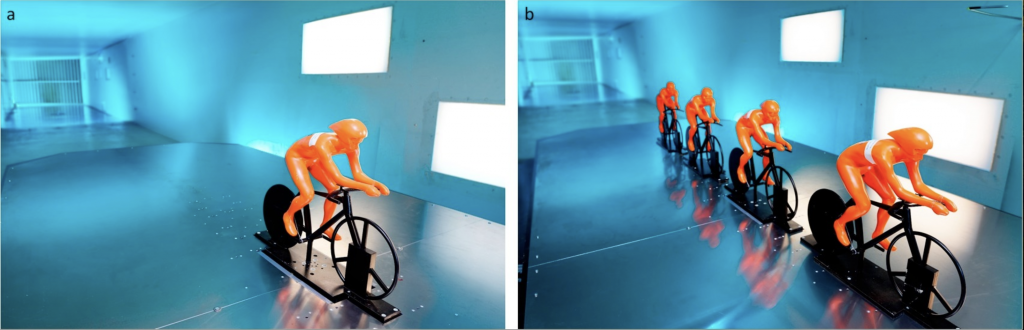
World records aren’t solo efforts, and Kerr’s was no exception. Two pacemakers guided him through the opening laps at precisely the speed required for a 3:42 mile split, allowing him to settle into rhythm saving energy while drafting behind them. Kerr went through the first 400 metres in 55.3 seconds and then through 800 metres in 1:51.1.
By the final lap, with the pacemakers gone and a roaring London crowd behind him, the race became a battle against history. Kerr accelerated down the back straight and pulled clear of rival Yared Nuguse. Forty-five seconds later, he crossed the line in 3:42.66, becoming the fastest miler the sport has ever seen.
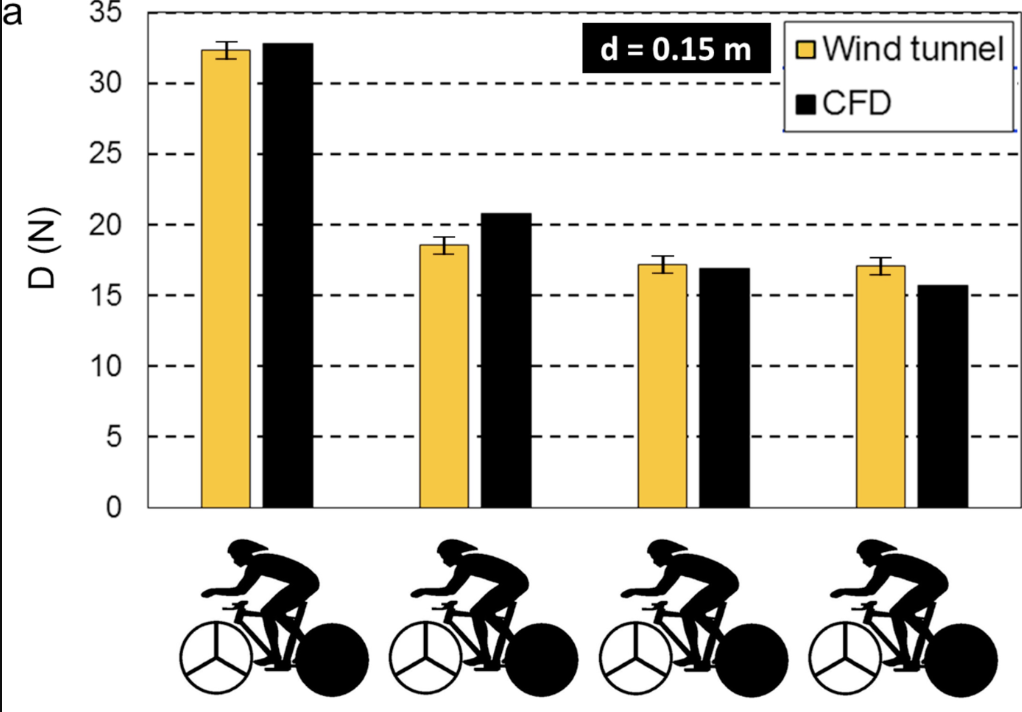
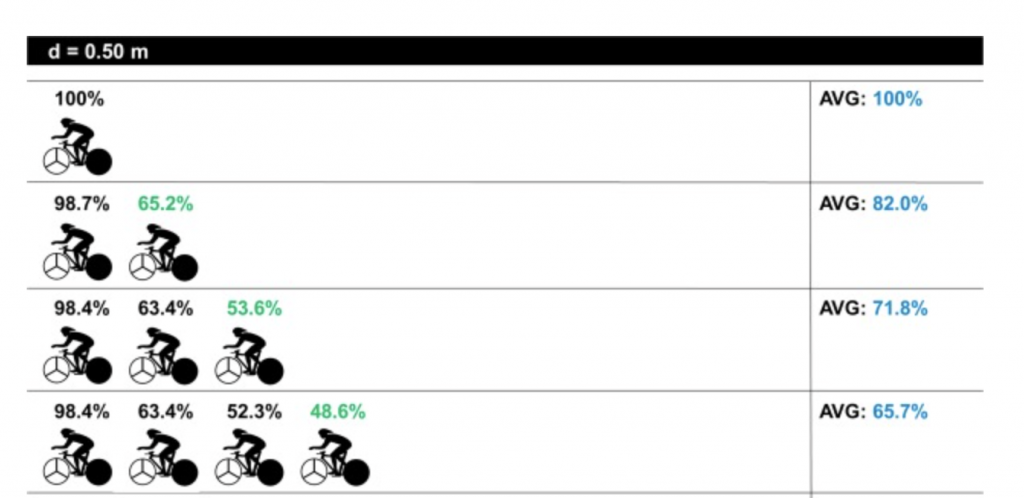
Josh Kerr didn’t visit a wind tunnel once during the preparation for this attempt, as far as I can tell. Should he have? He ran just shy of 26kph, speeds more commensurate with cycling than running. Aerodynamic drag in running is worth between 10 and 15 percent of the total work done against resistive forces. Perfect drafting is worth around a quarter of a second per lap, though this was “banked” and he used the first three laps worth of energy saving to empty his anaerobic energy stores in the final lap. This is about 0.75s worth of energy saved, slightly more time than the amount he broke the record by – it’s clear drafting helped him here.
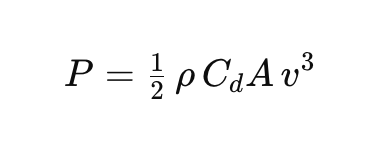
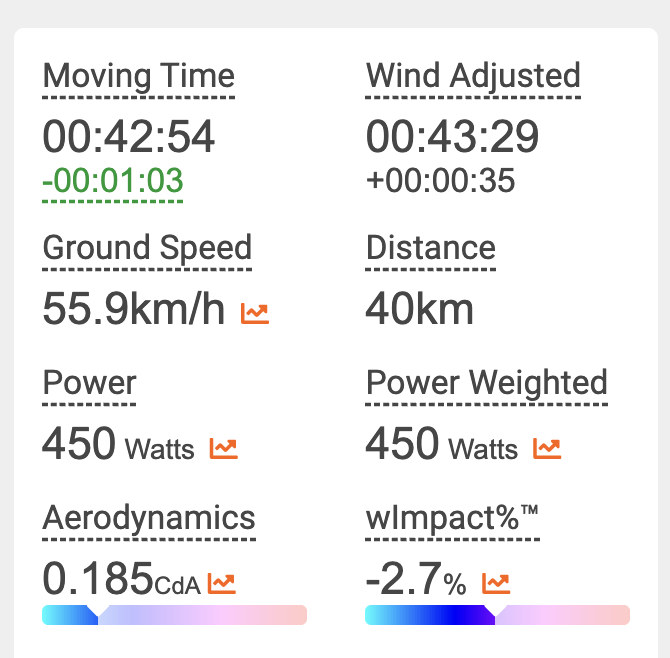
During the final lap, without drafting, Josh Kerr ran 54.9 for the final 400m, this is a speed of 26.2kph and at this pace a 5% reduction in cda would save him a 10th of a second. To put that into “time trialese”, that would mean finding a saving of around 3W, this begs the question as to whether or not Josh Kerr should be wearing aero socks and aero sleeves.
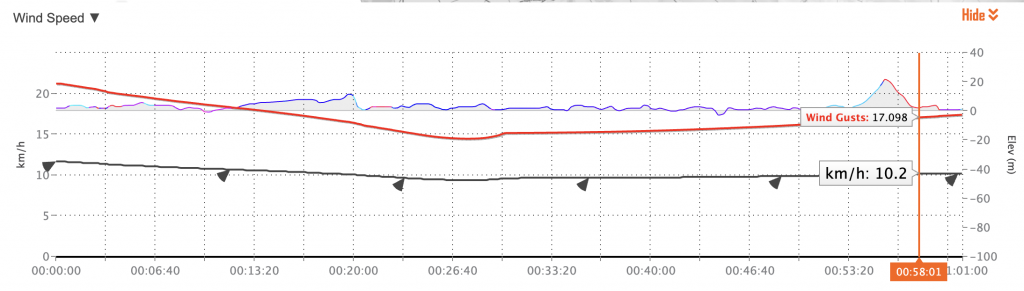
The key takeaway for normal runners here is probably headwind related. It’s pretty hard for us mortals to get up to an air speed of 26kph unless we’re running into a headwind, but the energy savings of drafting if we’re running into a headwind can be significant, in the realms of 5 to 10 seconds over the course of a 5k Parkrun.
We’ve heard through the grape vine that some runners are using myWindsock to prepare for races, do the same by clicking here.