


Trading weight for aerodynamics; standing and sitting in the saddle; hitting the hills harder and the flats easier. Just a few of the experiments you may be experimenting with to produce the fastest simulated time for your next big effort.
Although an overall time prediction is useful, going further by seeing exactly where, and by how much a setup change gained and lost you time, is extremely advantageous. Especially, when comparing dynamic variables that you can affect during the ride.
For example, the common climbing debate – should I be seated or stand? Standing allows for greater power output but staying seated with less power allows for superior aerodynamics. One will usually be more advantageous than the other overall, but there will usually be a varying need for both setups during the course.
Example between Standing and Seated climbing
The following image shows the Delta Comparison chart going from a Seated setup to a Standing setup. Knowing my physical capabilities in both positions, my Standing position is around 0.100 CdA higher, but I can produce 10% more power than my Seated position.
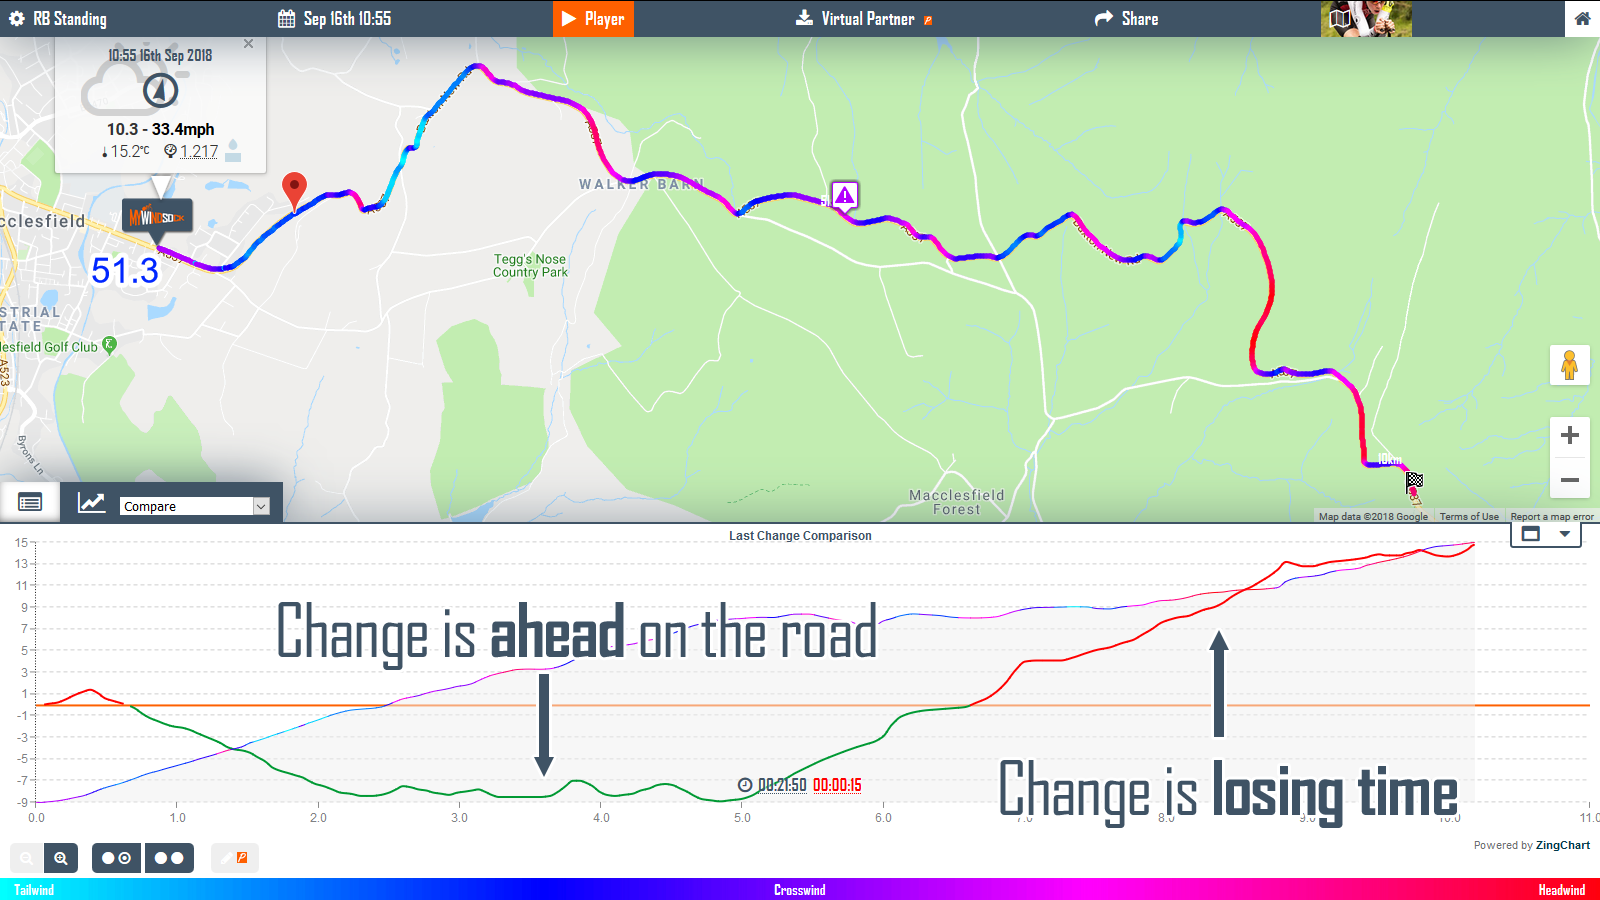
The above image shows that by changing the Seated setup to Standing we lose 15 seconds. However selecting and viewing the Delta Compare chart also reveals a 9 second potential advantage. The extra power Standing against the more aerodynamic Seated position is actually 9 seconds faster for the first 2kms. For the following 3kms we gain nor lose time to the Seated position. It is at only in the final 6kms in which Seated becomes the much faster option.
So from the Delta Comparison chart we have learned that the fastest approach to this time trial, with these weather conditions.
- Climb out of the saddle for the first 2kms
- Kilometres 2-5 we can freely choose between the two positions
- From 5kms to the finish we need to stay in the saddle
A different day with a different weather forecast we will formulate a different plan.
Read more about last change delta graphs here.
Start experimenting with routes, Strava Segments or your uploaded courses here.