


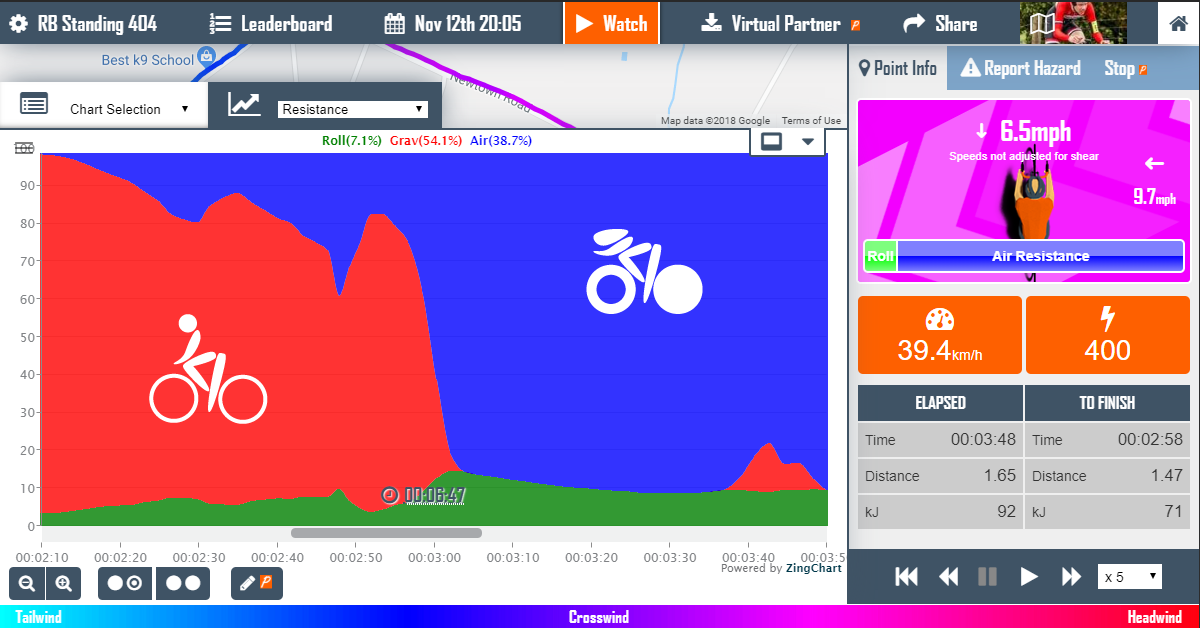
A key chart for competitive cyclists is the Resistance Distribution Chart. This chart displays the distribution of Watts between, Air, Gravity and Rolling resistances for every point on your course. The distribution can be highly weather sensitive. Watch for medium gradient hills having an unexpectedly large distribution towards Air resistance when there is a headwind.
How to use this chart
Approximate values for weight, aerodynamics and rolling resistance should be entered into the Options box. Identify large areas of red (gravity) as areas where you may choose a more powerful riding position at the sacrifice of aerodynamics. The overall distribution may inform your choice between light or aerodynamic equipment; aggressively aero or more powerful riding positions.
Get Started here.