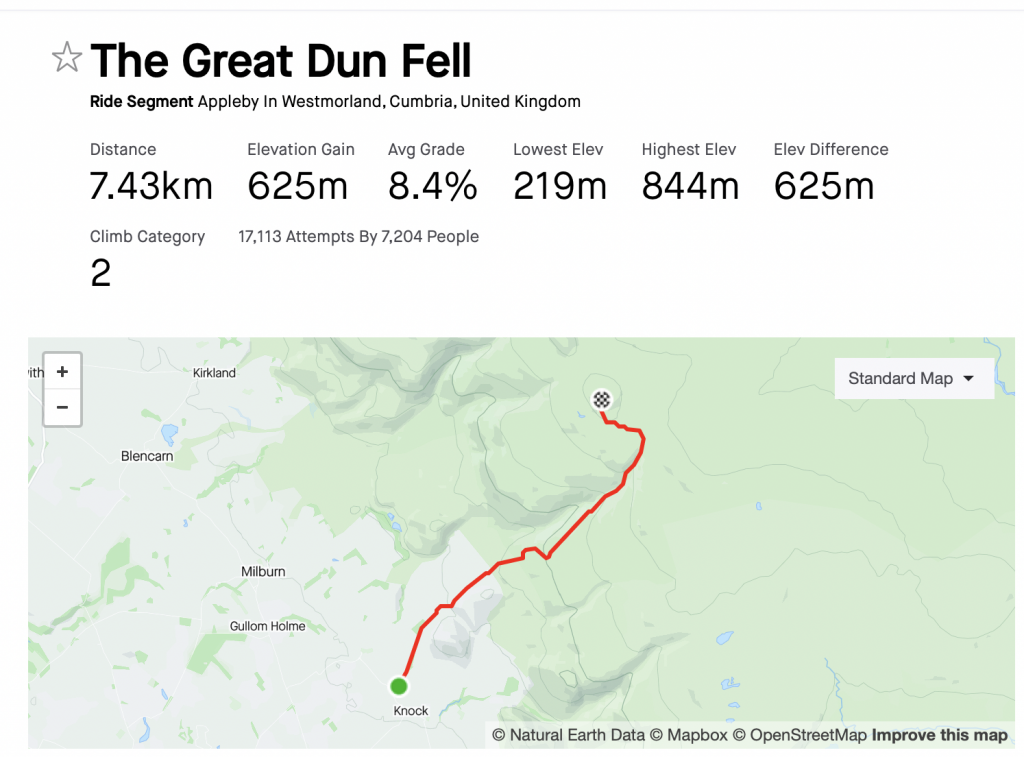
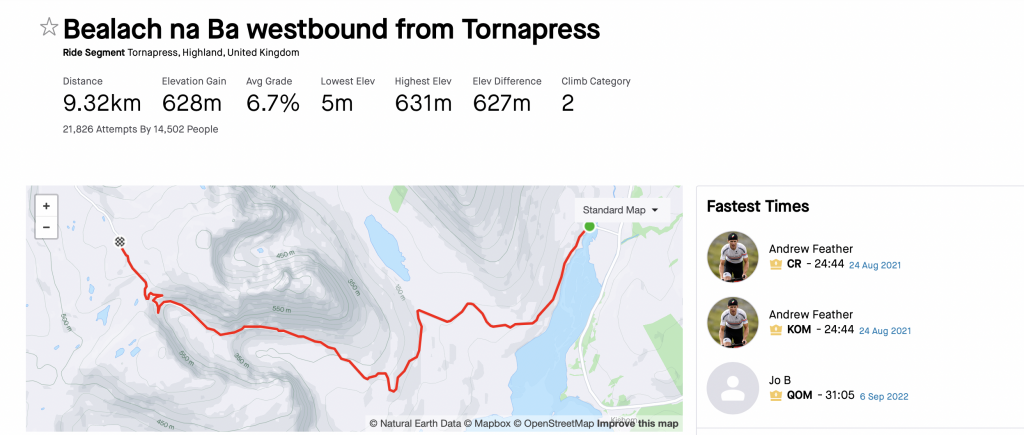
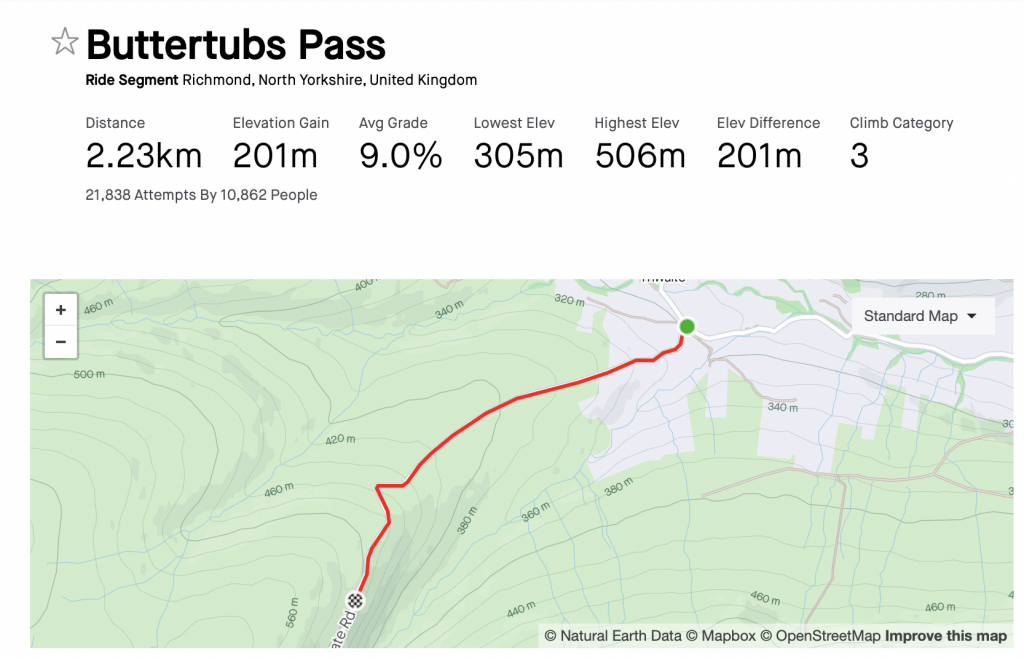
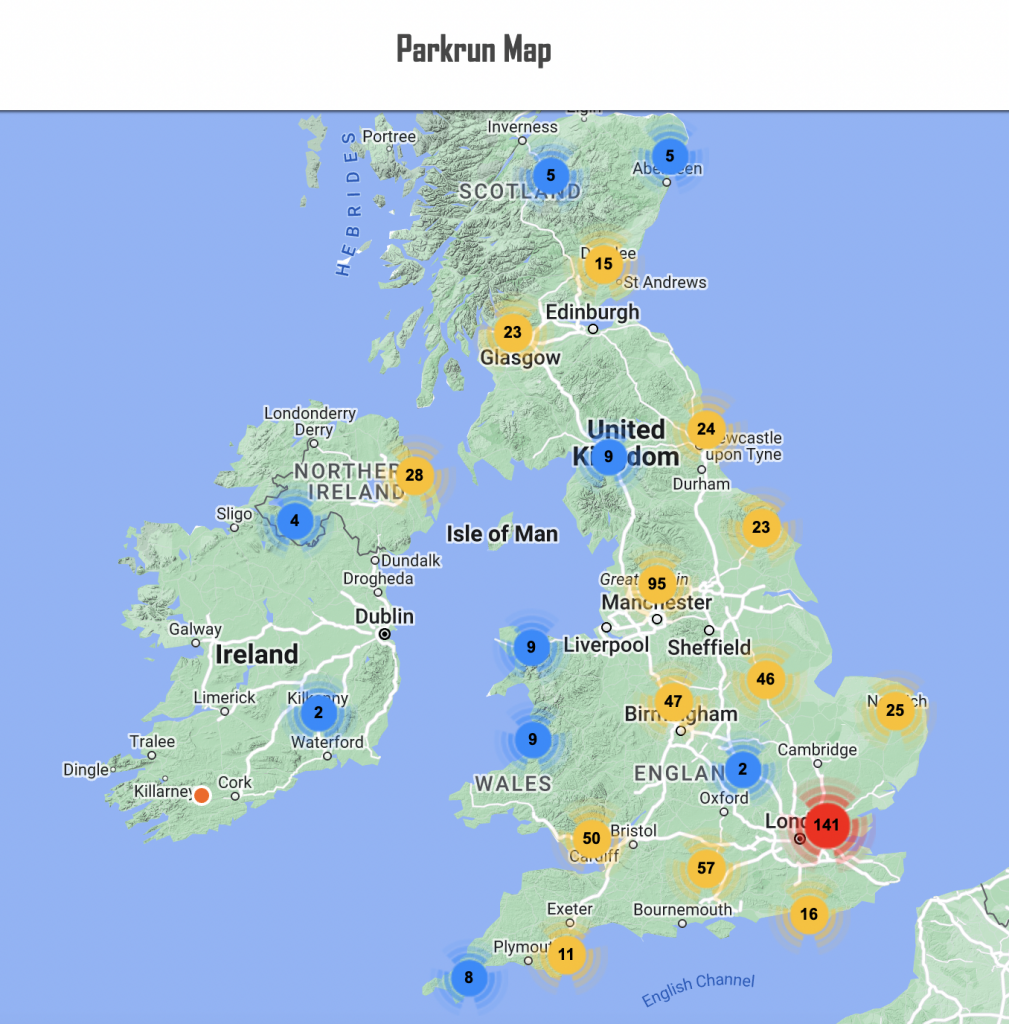
Anyone who’s gone down to a coastal town in the hopes of a fast Parkrun time only to be blown to bits by the wind will be familiar with the fact that cycling is not the only sport impacted by the wind. It’s that time of year too, where cyclists collectively put their running shoes on and we all go out and run a slightly underwhelming series of 5ks and proceed to not be able to walk for the two weeks after. That said, myWindsock might be able to help us be a bit more selective with our Parkrun courses to chase those PBs…
Parkrun Courses
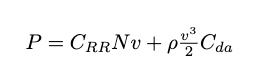
Beyond the weather – running power…
The running power meter industry caters to the needs of runners seeking advanced tools to optimise their training and pacing strategies. These devices, designed to measure the power output generated during running, offer a comprehensive metric beyond traditional metrics like speed or heart rate. By quantifying the actual force applied to the ground, runners can gain insights into their efficiency, form, and fatigue levels.
These running power meters typically use advanced sensors and algorithms to calculate power, considering factors such as stride length, cadence, and incline. As with cycling power meters, these devices take many forms including sensors built into watches, clips for the waistband of your shorts and foot pods with accelerometers in them.
However, it’s crucial to acknowledge certain limitations associated with running power meters. Calibration and accuracy can be influenced by variables like terrain, footwear, and running technique, potentially leading to variations in readings. Additionally, the interpretation of power data may require a learning curve for some users, as the concept of running power is relatively new compared to more established metrics like heart rate or pace. This is true of us too, there’s more variance on running power measurements which can make predictions using myWindsock difficult based on running power.
Despite these limitations, running power meters provide valuable information for dedicated runners aiming to fine-tune their training plans and enhance overall performance. As technology continues to evolve, advancements in sensor accuracy and data interpretation may address some of these challenges, further solidifying the role of running power meters in the world of distance running. myWindsock’s use of running power is also evolving, as more runs are uploaded we generate data which can be used to train and refine our algorithms.
Aerodynamics and running
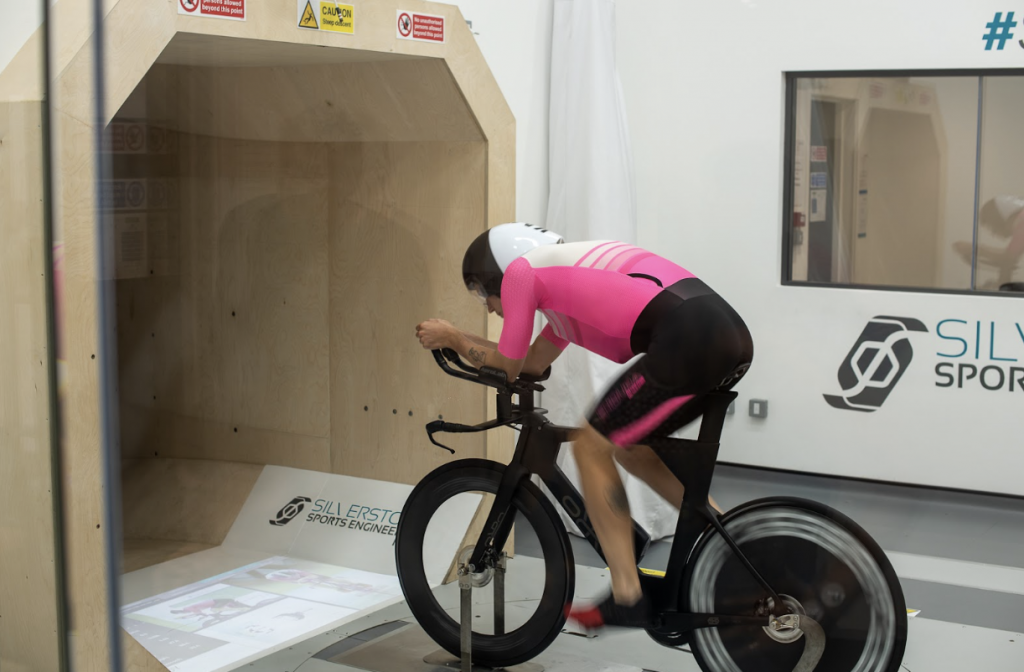
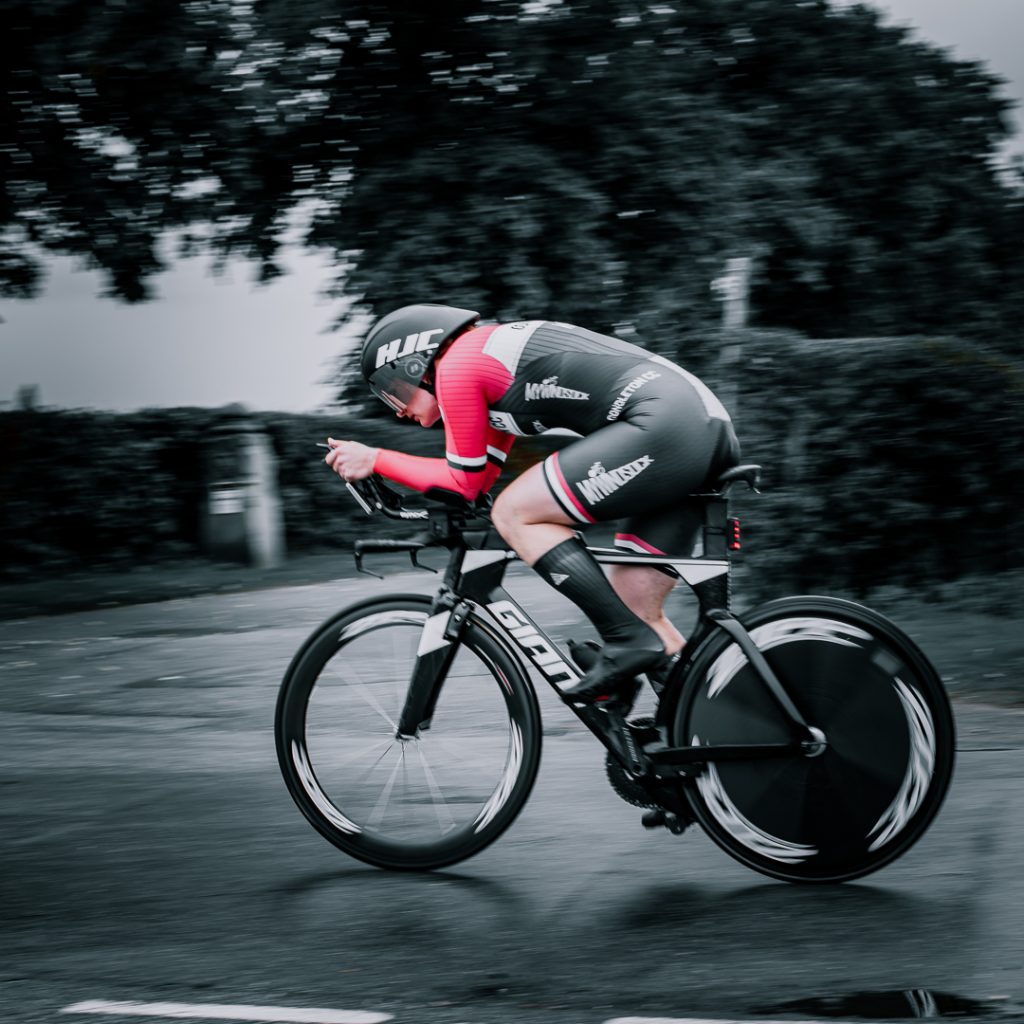
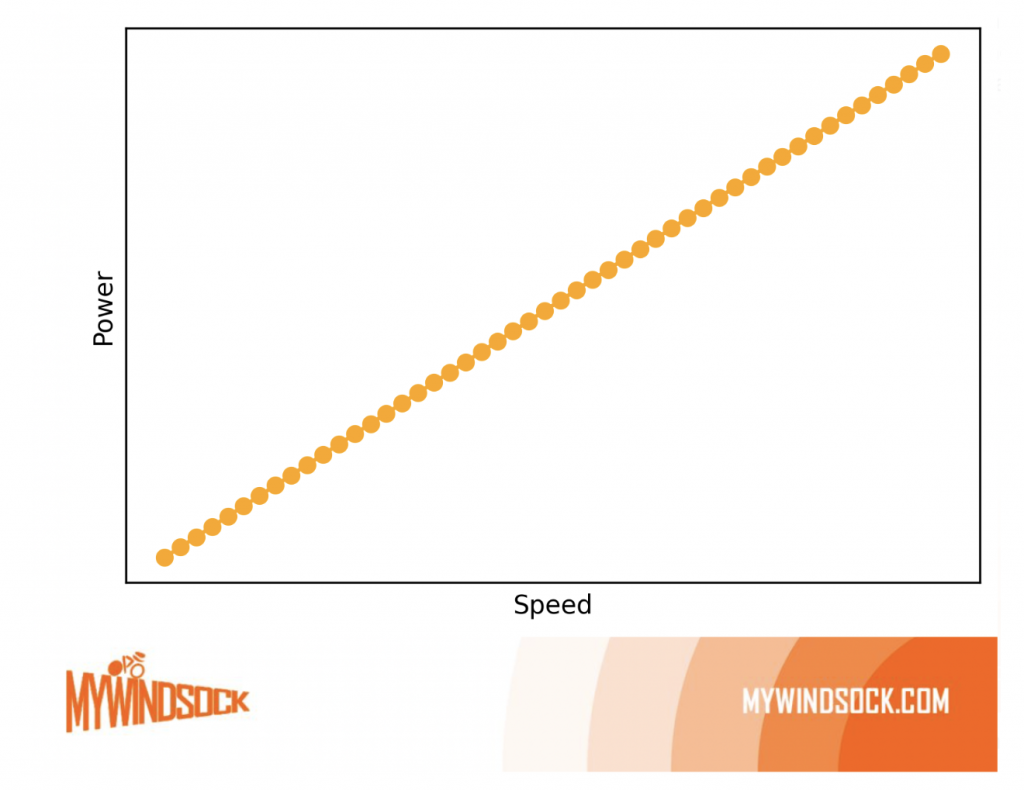
Aerodynamics plays a significant yet often overlooked role in running performance, especially at higher speeds. While it is not as pronounced as cycling, where air resistance is a major factor. At moderate running speeds, air resistance is a minor contributor to the overall force opposing forward motion. However, as runners approach faster paces, particularly in elite competitions, aerodynamics become more influential. Proper body positioning, streamlined posture, and minimising air resistance can contribute to improved running economy and reduced energy expenditure.
Runners can optimise their aerodynamics by adopting a forward-leaning posture, tucking in elbows, and reducing frontal surface area. This minimises the resistance encountered as they move through the air. The impact is most noticeable in sprints and middle-distance races where milliseconds matter, but marathon runners also benefit from efficient aerodynamics over the course of long races. Apparel and equipment choices also play a role. Tight-fitting clothing and advancements in fabric technology help reduce drag, contributing to improved aerodynamic efficiency.
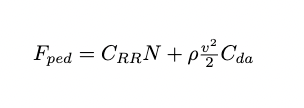
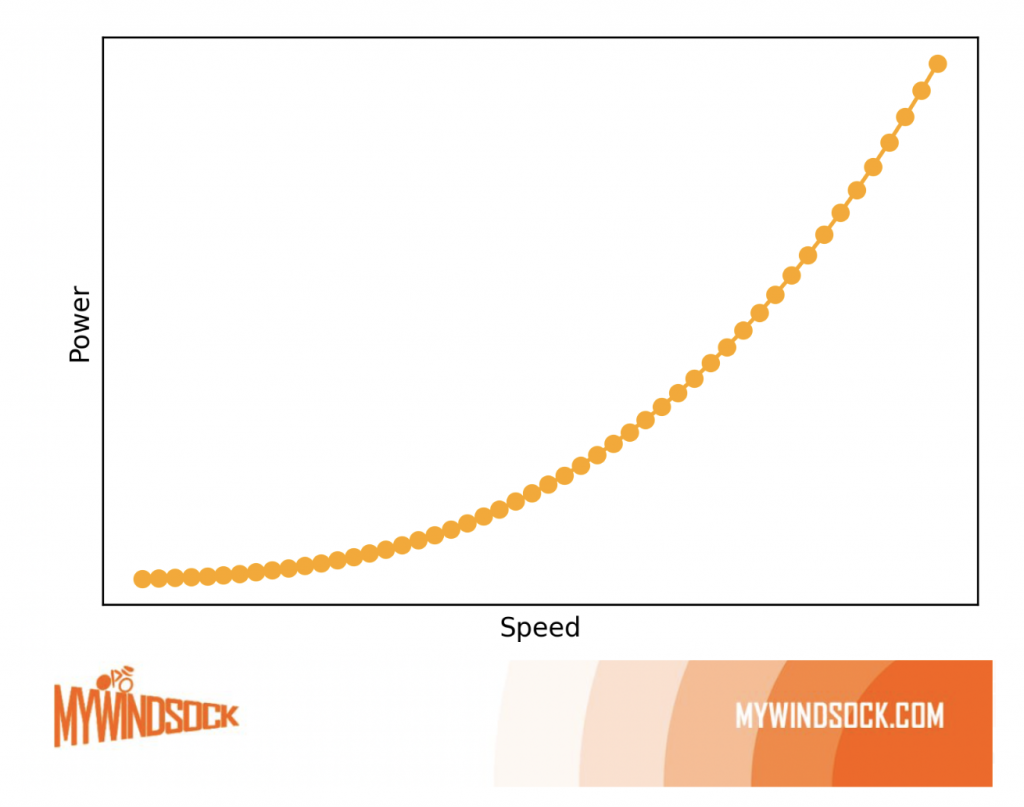
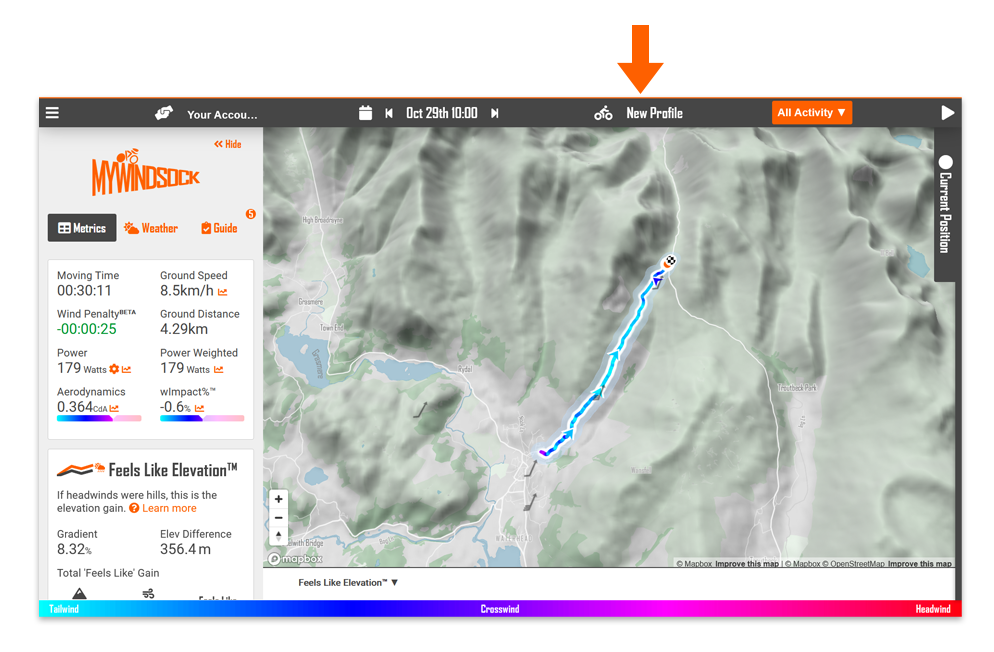
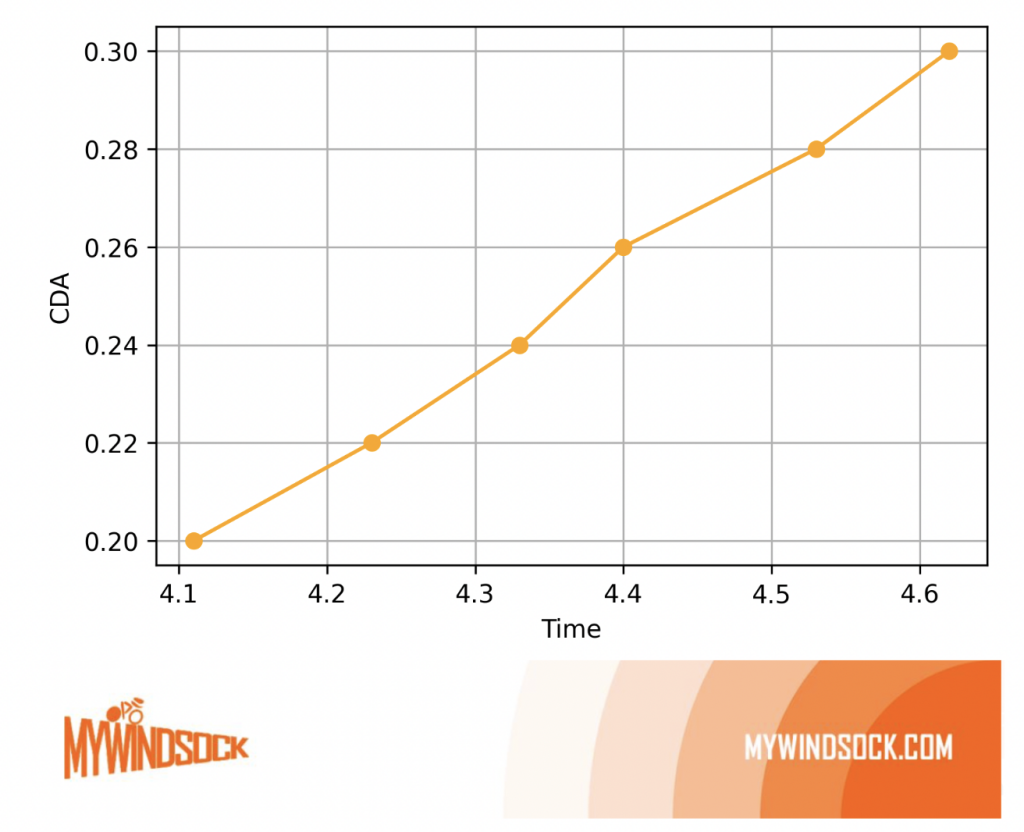
Typical cda values for runners are between 0.4 and 0.6, which is quite high (as frontal area when you’re stood up is higher than when you’re scrunched into a TT position). The effects of drafting are also important in running, since 1980 studies have reported energy savings between 2 and 4 percent at some realistic running speeds. At Eliud Kipchoge marathon pace, drafting a runner in front of you is essentially worth 1s every 400m (12.5s per Parkrun if you’re quick…).
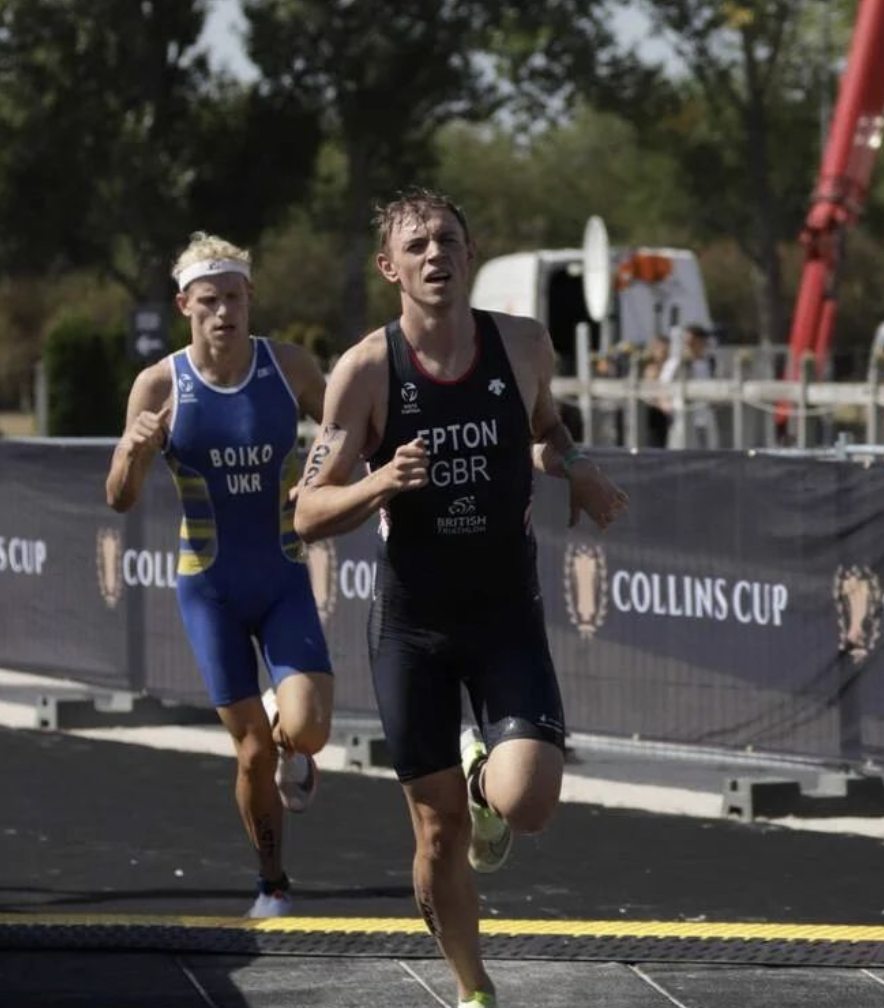
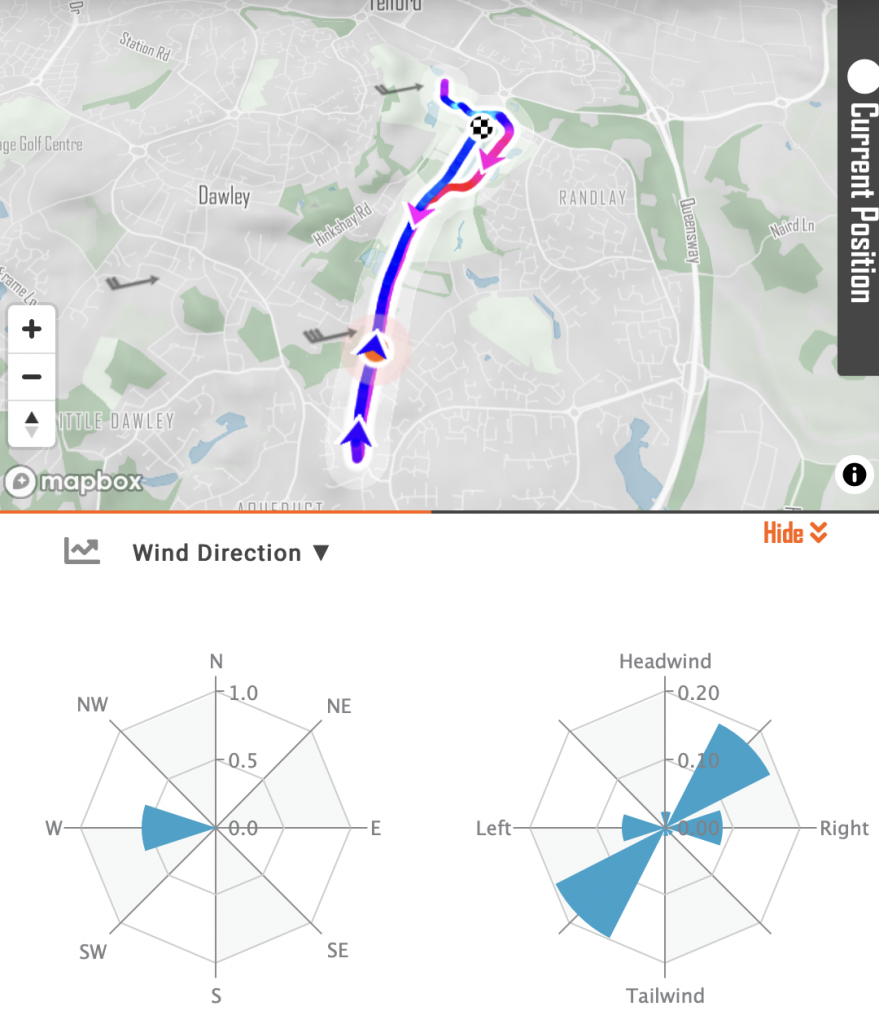
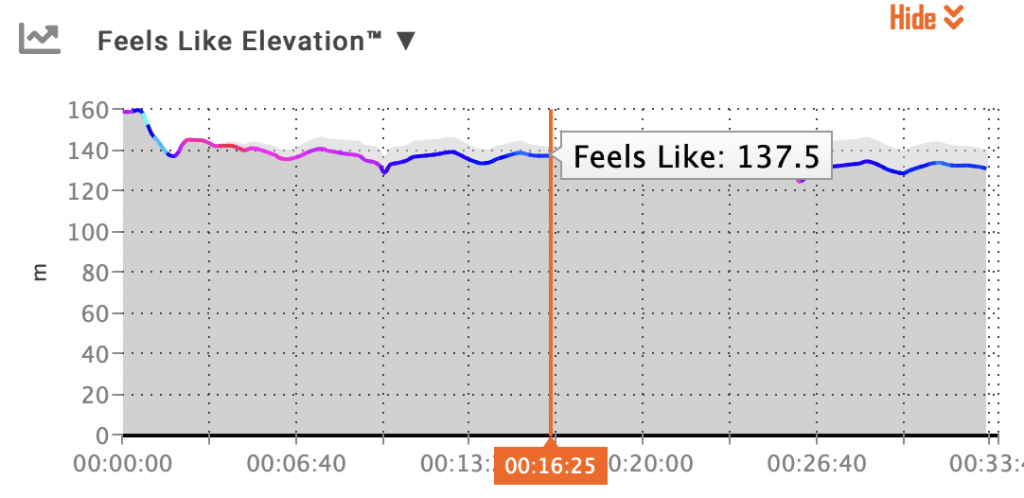
I’m a runner, how should I use myWindsock?
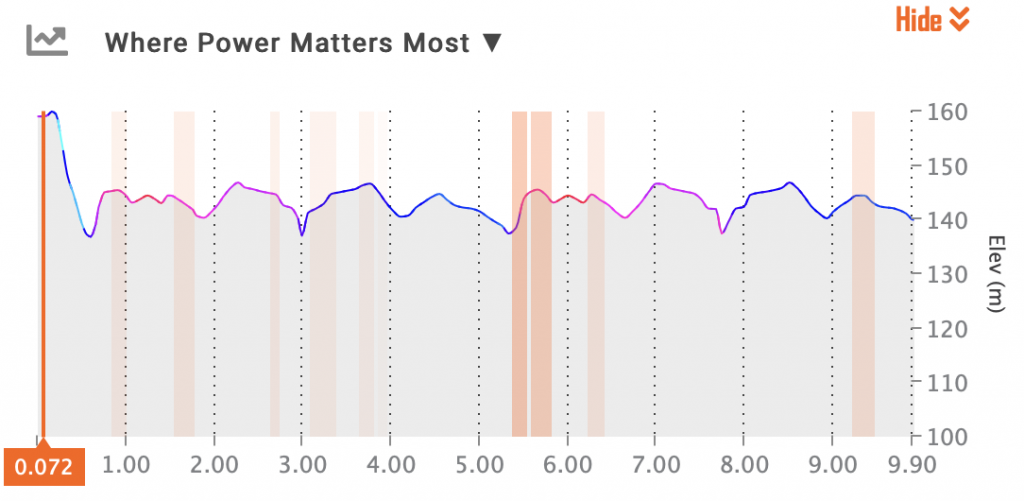
Now, I do quite a bit of running and am well known to be a keen advocate of myWindsock’s usefulness in a number of scenarios. Every time I take a crack at a running PB, I do with the help of a few key charts in myWindsock…
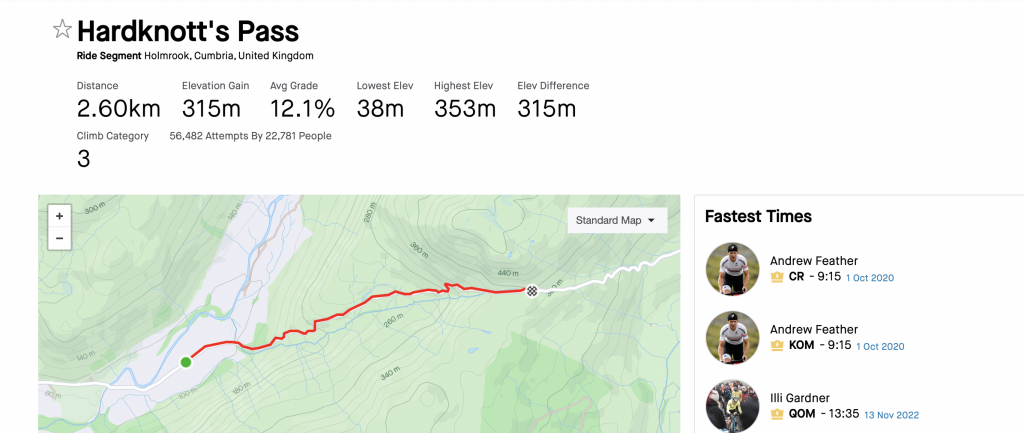
myWindsock is used by runners already, and our Parkrun map can tell us where to go for best results. If you’re a runner and you’re interested in using myWindsock, sign up here.