


Recently, myWindsock went to a wind tunnel and found out some very interesting things.
If you log into myWindsock and open up a forecast, you’ll see a number which is labelled as ‘cda’ – this is your coefficient of drag multiplied by your frontal area. myWindsock, generally speaking, does a pretty good job of estimating your cda from previous rides which you can pop into planned rides to see how fast you might go (when combined with weather forecast data, your weight and other variables).
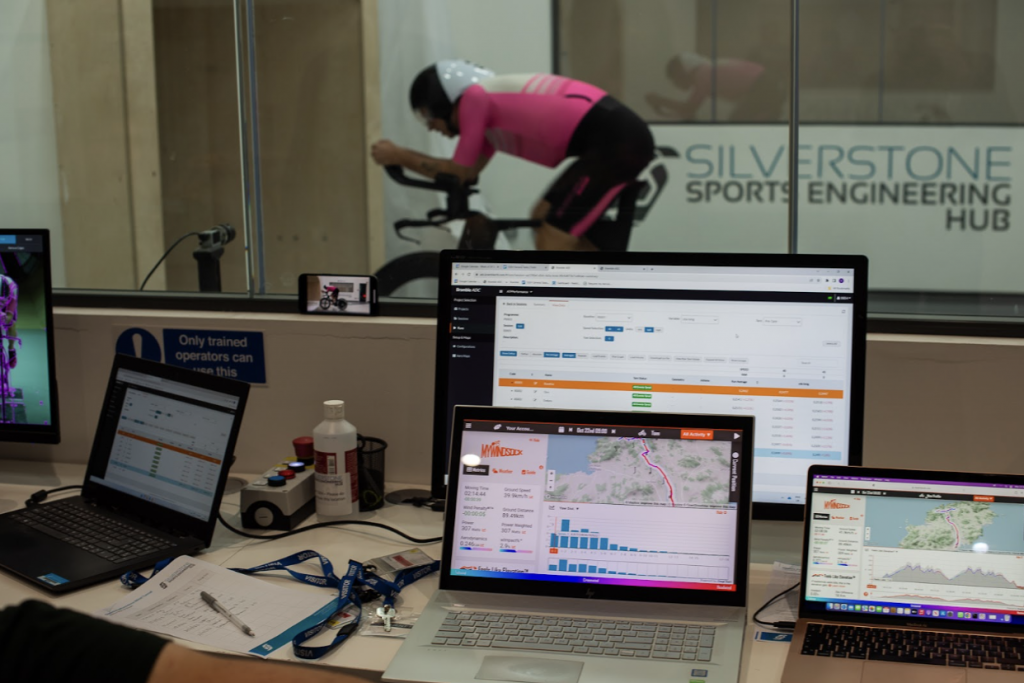
Recently, I went into the tunnel and, given that I do quite a bit of work here at myWindsock I thought I’d drop Ben a text letting him know I’d be going and he kindly decided to come down. I was quite pleased about this. Who better to provide their opinion on what to do next than the founder of the most democratic virtual wind tunnel available on the market?
The reason I went to the tunnel is because I’m currently in the process of trying to get a pro win under my belt in a middle distance triathlon. The thing is, I’m not particularly physically talented (I’m ok for sure but by no means some kind of freak of nature). This means I need to ride faster without simply pumping out 350W for two hours – enter my aerodynamic era. The first step was to go to the tunnel and measure my cda.
The next two sections explain cda then (simply) how a wind tunnel works. If you already know these things or, alternatively, don’t particularly care and just want to see how much speed we found then scroll past these bits…
What is cda?
CDA, or Coefficient of Drag Area, is a critical concept for cyclists, especially those interested in going faster. It’s a measure of how aerodynamic a cyclist and their equipment (known as a ‘system’) are as they move through the air. Generally speaking a good time triallist’s cda will be around (or lower than) 0.2 – though this can take many trips to the wind tunnel and velodrome to achieve.
Imagine riding a bicycle through the wind. The faster you go, the more the air tries to slow you down.
CDA takes into account two key factors:
1. Coefficient of Drag (Cd):
This part represents how “slippery” you and your equipment are to the air. A lower Cd means you’re more aerodynamic, like a sleek, streamlined shape that doesn’t create much resistance. It also means you’re likely wrapped in some kind of aerodynamic material (like a skinsuit) that manipulates the air in ways that reduce drag.
2. Frontal Area (A):
This is the size of the surface area the air hits as you ride. If you crouch low and make yourself as small as possible on the bike, you reduce your frontal area. It’s a measure of what the air ‘sees’ as it approaches you.
CDA is calculated by multiplying Cd and A. So, if you have a low Cd (meaning you’re very aerodynamic) and a small A (you make yourself compact), you’ll have a low CDA, which is great because it means less air resistance, and you can ride faster with less power. Cyclists and engineers often use wind tunnels and computer simulations to find ways to lower their CDA. This can involve using more aerodynamic equipment, adjusting riding positions, or choosing clothing that reduces drag. One thing that’s often surprising is that one thing that tests fast on one rider can test slower on another showing the importance of measuring CDA and not just assuming that aerodynamic gains are the same across all systems.
In competitive cycling, especially time trials and triathlons, having a low CDA is crucial because it can make the difference between winning and losing. Riders strive to strike the right balance between power output and aerodynamics to maximise their speed and efficiency on the bike.
How does a wind tunnel work?
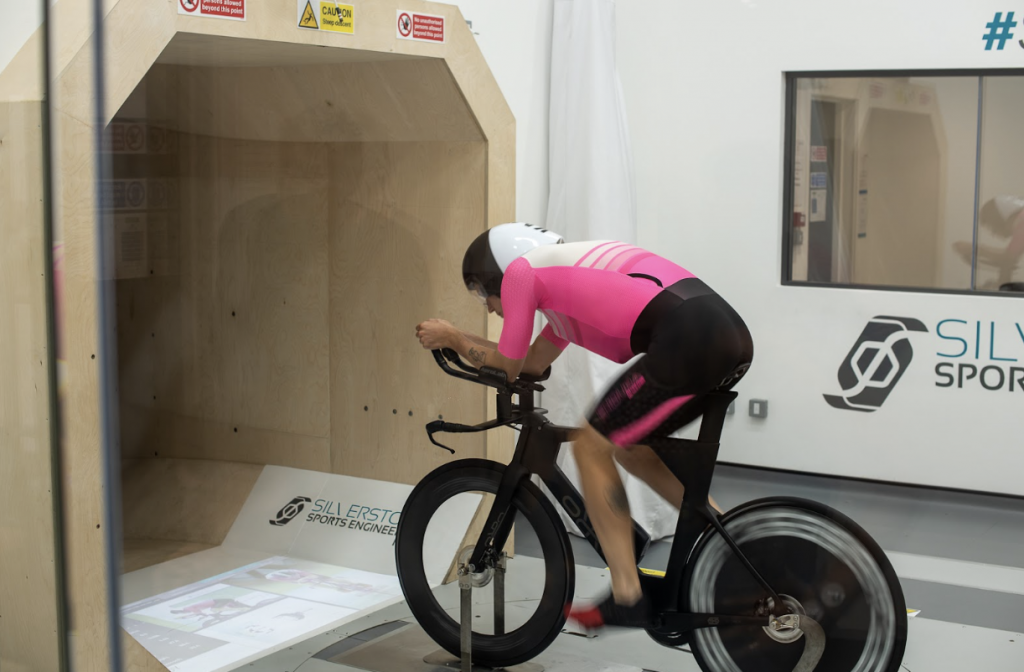
A wind tunnel is a clever machine used to test how things, like aeroplanes, cars, or even buildings, respond to moving air. It can also be used as a means of making various objects and people more efficient (think F1 cars and cyclists). Imagine a wind tunnel as a giant tube, kind of like a long, narrow room with powerful fans at one end.
Here’s how the process of measuring in a tunnel works:
1. The Model:
First, scientists or engineers create a small-scale model of the thing they want to test. It could be a miniature aeroplane or a tiny car, for example. Alternatively, the tunnel is big enough (as the one we visited was) to fit a 1:1 size model in there (such as a fully grown cyclist and his bike).
2. The Tunnel:
They place this model inside the wind tunnel, usually near the fan end. The tunnel is designed to be smooth and sleek inside to make the air flow nicely. This means the only disruption to the flow is caused by the subject of the test.
3. Air Flow:
Now, here comes the exciting part. The fans at one end of the tunnel start blowing air super-fast (or not, depending on what you’re testing) down the tube. This air simulates the wind that the real thing would experience when it moves.
4. Testing:
As the air rushes over the model, sensors and cameras record all sorts of data. They measure how much force the air exerts on the model, how the air pressure changes, and even how the air flows around it. In the specific case of a cyclist, there are cameras to ensure the same position is being held by the rider to ensure changes made are isolated and any differences in measured CDA are due to the target change and not some accidental positional change.
5. Analysis:
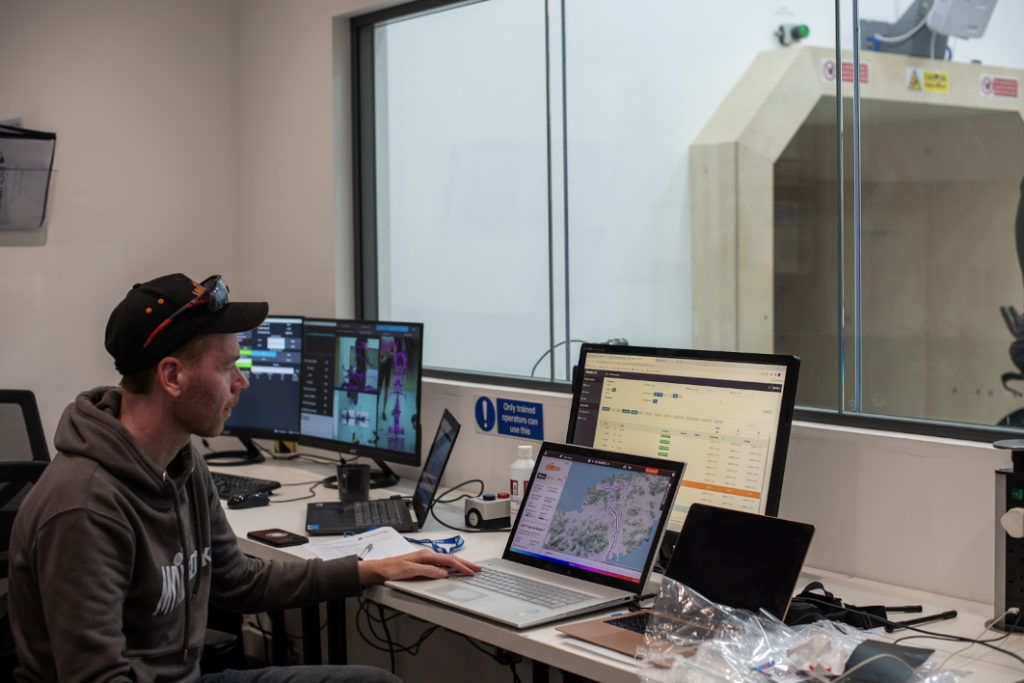
Scientists (or Tom, Ben and Andy) analyse this data to understand how the real thing would behave in different wind conditions. They can tweak the model or make changes to improve its performance or safety. This is where myWindsock came into its own for our analysis – as a means of putting the cda number into context we plugged the measured value from the tunnel into a myWindsock forecast of the target event to see how the changes in cda impact the overall time of my target race with the pacing plan input into the forecast.
6. Repeat:
The test can be run many times, changing the wind speed or direction to see how the model responds in different scenarios.
In the end, a wind tunnel helps engineers make sure that aeroplanes fly smoothly, cars are fuel-efficient, and average triathletes can cycle fast. It’s a real aero-nerd’s science playground where we can learn how things interact with the air.
What did we learn in the Wind Tunnel?
The first thing that we learned was that speed matters. What’s fastest at 35 kph isn’t necessarily fastest at 45 kph. This is particularly important for my case as I’m racing a triathlon where the speeds are slightly slower for a couple of reasons – the primary one being that the finish line is not where the bike course ends… We had a couple of runs and suspicions of things that have tested faster at higher speeds but at “triathlon speeds” were actually slower.
What looks aero isn’t always aero
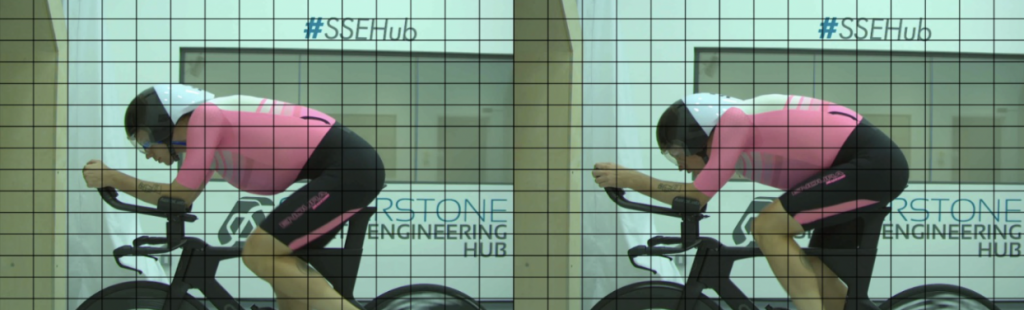
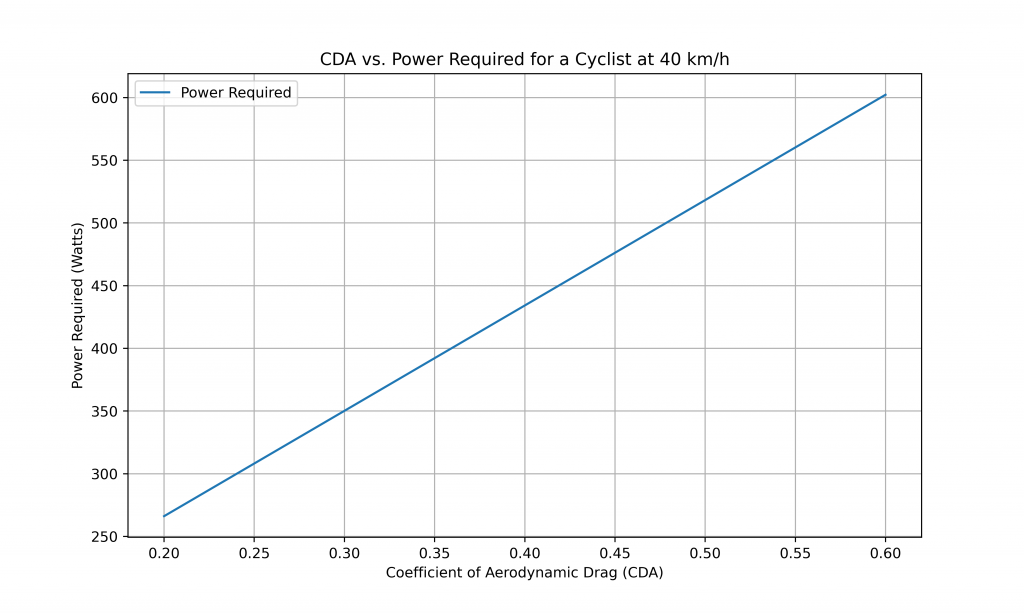
Other than the fact that the left hand side position was faster, it was also more sustainable (for now, though these things are trainable). The run on the left had a cda (at 40kph) of 0.239, the run on the right had a cda of 0.249.
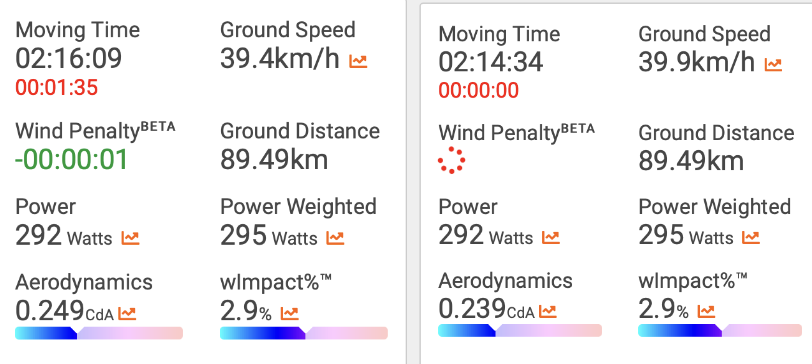
We can see how much of a difference this makes, over 90s for the same power during the course. This can be combined with the fact that the position on the left hand side is easier to run off as well, being less muscularly strenuous.
Stuffing your drink down your top can make you faster
Anyone who’s done a triathlon will know of the difficulty that various hydration systems can come with. Bottles mounted behind the saddle are prone to launching themselves out of their cages with the slightest bump. Recently, it’s become fashionable to shove a Camelbak water bladder down the front of your suit – primarily for aerodynamic reasons but it’s also quite a convenient place to keep your nutrition.
Knowing your cda can help you plan
Relatively small changes in cda over long distances can be worth minutes. When you add these time changes up it can change the amount of sustainable power as well as nutritional planning. The reality is, combining aero data that’s been measured with the processing power of myWindsock is a valuable tool for any athlete and there’s no doubt that all the top contenders are doing this.