


 UK Time Trial Events
Using our cycling weather modelling we were happy to help the GCN Tech show out with some cycling weather geekery. Check out the video.
Category: Discussion
Highlighting and discussing events in cycling and using myWindsock to improve performance.
How much slower are Winter Time Trials?
To mark the first British Open time trial of the 2023 season, we were happy to help Cycling Time Trials, the British governing body for time trials, with a bit of data.
> Read the Cycling Time Trials article
> BS19 Ely & District myWindsock Forecast
What is the difference between Winter and Summer?
To find out the difference between Winter and Summer, we ran a simulation for every day of 2022. That’s 365 times around the Ely & District course! We ran the myWindsock simulations at 300 Watts, 80kg, 0.200 CdA. Here’s what we found.
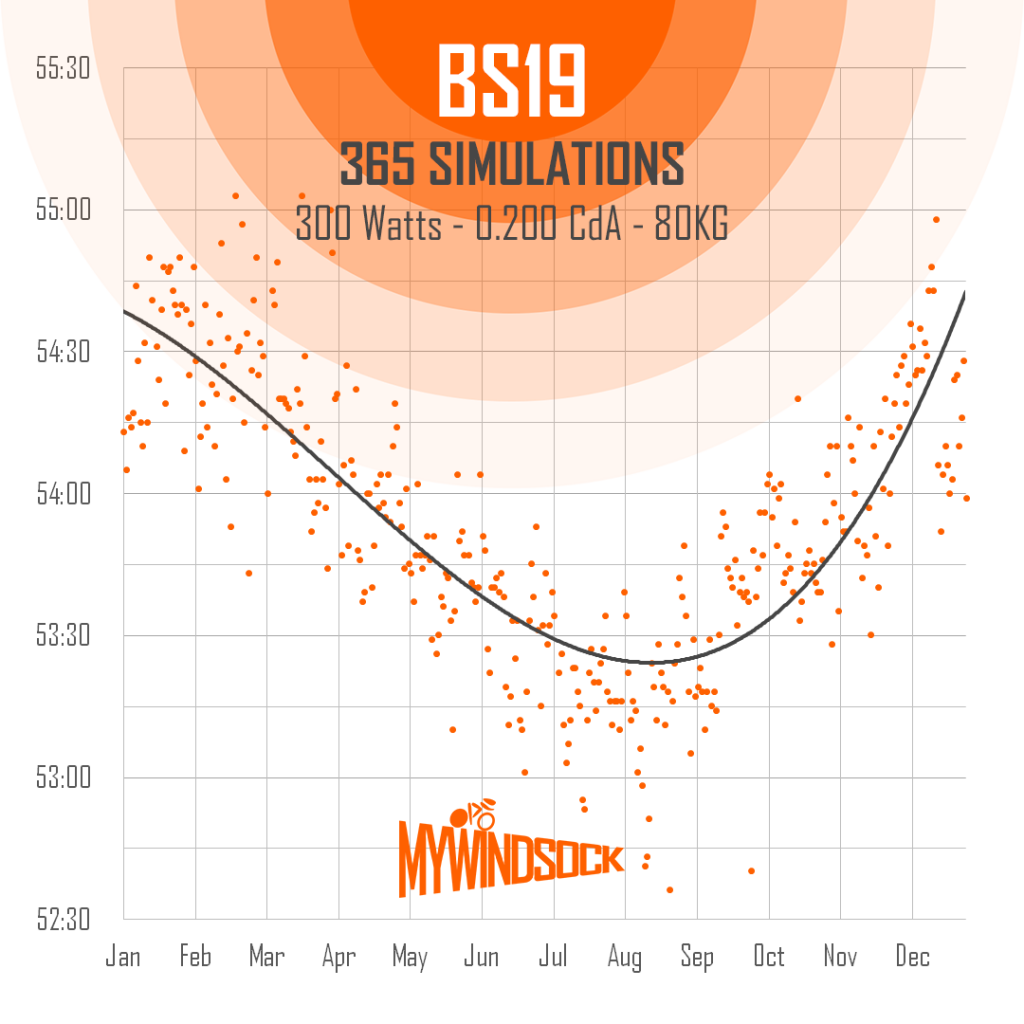
You can see from the above graph the day to day the variability of times for the BS19 course due to the weather. Time range from 55 minutes in Winter Months to 53 minutes in the Summer.
Another thing to note is the seasonal day to day variability, that is the difference between two days of the same week or month. In the Winter we can see this is around 60 seconds, however times are a little more consistent in the Summer at around 30 seconds. Good job myWindsock give’s you the tools to measure the impact of the Weather.
> Find your Open and Club Time Weather and Analysis
We have more information about how weather impacts cycling speeds, here are some more articles.
Why do you ride slower in Winter: GCN Tech Show
Slow vs Fast Riders who suffers more in Winter Kit
Why do you ride faster when it’s warmer?
A chat with Mark Beaumont
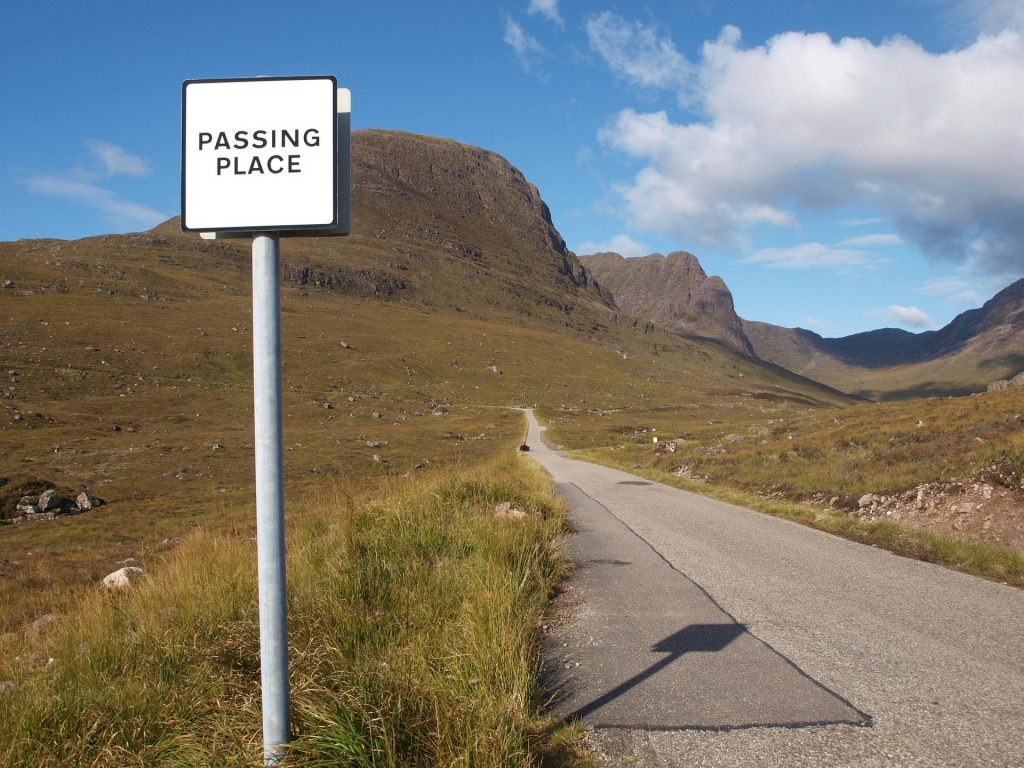
A few months back, Ben from myWindsock was out supporting (and providing valuable data) to Mark Beaumont on his successful attempt to break the North Coast 500 record. We managed to get hold of Mark to ask a few questions about the big day (and a bit).
For those of you that don’t know, Mark Beaumont broke the North Coast 500 record – he did this completing the route in a time of 28 hours and 35 minutes. The previous record was a touch over 29 hours and was held by Robbie Mitchell – a seriously talented ultra endurance cyclist with national titles to his name. Obviously, no record attempt like this stands a chance of being successful without some serious weather forecasting – which myWindsock happily provided to Mark. We had a couple of questions for Mark about the record attempt…
We asked Mark about how his state of mind was impacted by the forecasting from myWindsock. He told us, “I knew that the NC500 record would be seriously hard. Robbie Mitchell was the national 24 hour TT champion when he set it and had relatively calm conditions. With over 10,000 metres of climbing, very little wind cover and changeable conditions in the north of Scotland, I also know that weather would play a massive part in our success.” It was clear that Mark understood the huge difference conditions could make and that predicting them would be important in a successful ride. He went on to say that myWindsock, “gave me great peace of mind” and that he was glad his team had the tool at their disposal. He finished by saying that myWindsock, “felt like a secret weapon, an element of planning that wouldn’t have been taken into account in such detail when Robbie broke the record the year before.”
Despite the record being a continuous 28 hour ride with more than ten thousand metres of elevation, aerodynamics make a huge difference. Mark’s average speed was a touch over 18 mph (around 29 kph). The upshot of this is that a time trial bike is much faster. With a record of this length, holding the aero position can be hard. We asked Mark about how he factored in ‘non optimal’ aero conditions due to cold and fatigue. He told us, “We went to the Catesby Tunnel and did aero testing on a road bike with rain jacket and road helmet, versus the time trial bike with skin suit and aero helmet.” Catesby Tunnel is a disused railway tunnel now used for aerodynamic testing. Being underground, myWindsock isn’t a great deal of use here but it allowed Mark to obtain valuable data for his attempt – numbers we were able to plug into our algorithms in order to forecast his attempt. The results of the testing at Catesby were fascinating. Mark went on to say, “The difference was absolutely massive when extrapolated over 516 miles. So when my neck started to really hurt about 7 hours in, I knew the penalty from cracking and changing my setup, which focused me to stay low and on the TT bike.” As night drew in, it became very cold but there’s an aero penalty associated with cold air and putting on more layers. Mark discussed this, “ Even as it got cold overnight, not putting on the gilet and keeping as efficient as possible was front of mind.”
Obtaining aerodynamic data isn’t enough on its own. With a relatively accurate value for cda (which is rarely static) we can predict how Mark’s time forecast will change due to positional and clothing changes. Not just how many watts it’s costing him. This is where myWindsock can be valuable in attempts like this – turning data into information.
A record like this is an extremely tough endeavour. We asked Mark about getting back on the bike after his successful attempt. He discussed his timeline for getting back on and feeling ‘normal’ on the bike. “I was back on the bike a few days later for some gentle spins and to aid recovery. But it took a few weeks before I felt my energy levels were back and that I could ride with any decent power again.” The fact that it took weeks for one of the best ultra endurance riders in history to recover is testament to how hard this record is. Throughout this, Mark was keen to stress the importance of his team. They, combined with the data that they were able to utilise from myWindsock, were able to keep Mark informed. He went so far as to say he was “just the engine on the bike”. His team gives him all the information he needs during his attempts and myWindsock was extremely glad to be a part of this wonderful attempt!
If you want to add a dash of confidence to your sporting endeavours, weather it’s breaking the NC500 record or chasing Strava segments, click here.
Why bother with a premium account?
myWindsock has a free version that many of you reading this will have used or be users of. Our free version is pretty feature rich, so much so that you might wonder why you should bother with myWindsock premium. Many of you won’t need premium, with something like myWindsock (one of Cycling Weekly’s top 10 cycling apps of 2022) it’s always going to be an optional extra. At less than £2/month, it’s one of cycling’s cheaper optional extras though…
For a detailed account of why you should get premium and an in-depth description of the features, click here. For those of you still here, read on for three reasons you should consider upgrading to MWS premium.
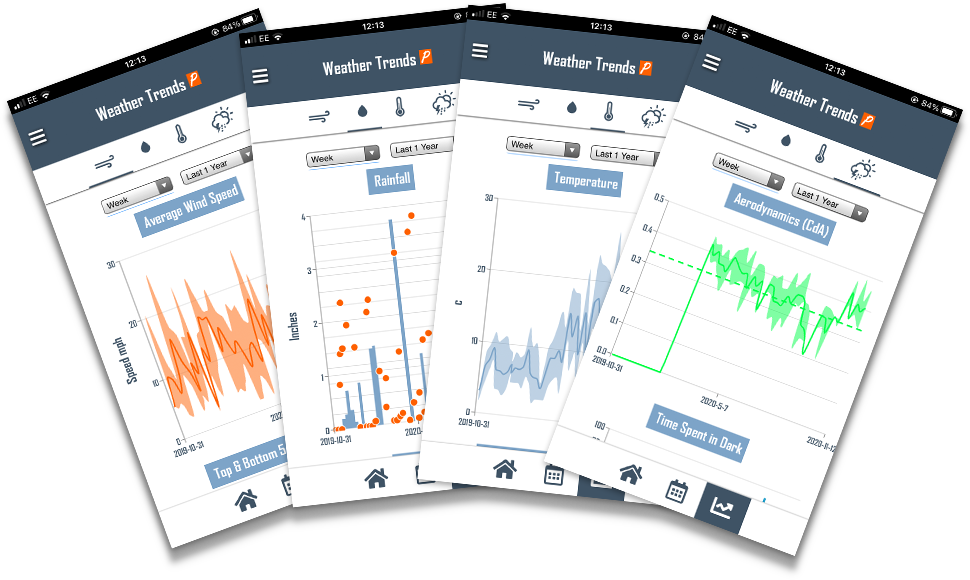
Track weather trends
Climbing hills and riding long distances are all recorded, and both are feats to overcome. A myWindsock premium account will allow you to track weather trends over time too. You will know what your longest headwind is, how your cda changes from summer to winter as well as your wettest and coldest rides.
If headwinds were hills
Hills are great because you can see them, quantify them and conquer them. Headwinds can be equally tough, yet the sense of satisfaction for ‘getting through’ a headwind isn’t quite there. Well, resistive forces are all the same in the sense that they can be turned into climbs. A headwind of a certain force for a certain duration is equivalent to climbing some given number of vertical meters at a given gradient and myWindsock calculates this for you. If you want to learn more about this, click here.
Plan races like a pro
There’s a reason World Tour teams, ultra distance record holders and Olympic champions use myWindsock to plan their races – because they think it’s the best tool for the job. Who are we to disagree with them? With MWS Unlimited (£2.08/month) you can plan your races with limitless detail.
For more detail on myWindsock Premium, as well as sign up links – click here.
Critical Power
myWindsock uses W’ Balance to help you pace race efforts correctly. W’ Balance allows you to maximise the work done above critical power (CP), but what exactly is CP?
What is CP?
Critical power is the idea that the power duration curve can be fit to an equation which is approximately true for all athletes. Obviously, it’s more true for some athletes than others (there are statistical anomalies in any population). The point at which this approximation is no longer true will be somewhere between 30-60 minutes where the curve will tend toward a straight line – this line is where your critical power sits.
The area between this curve and the CP line is your W’ – this is the amount of energy you have available above your critical power. You can use it all in one go with a big sprint, or burn it slowly with extended time just above critical power.
How do I test it?
You can test your critical power by doing two power tests and fitting a curve to the results of these tests. High North have quite a neat CP calculator available on their website. The favoured duration amongst coaches seems to be 3 minutes and 12 minutes. If you’re a 10 mile time trial specialist you might wish to do a 20 minute test as this is closer to race duration. Having more data points will also mean your CP value is more accurate so doing 3 tests might be better.
The W’ Balance tool
A more detailed description of how this works can be found here but we shall briefly discuss the tool here.
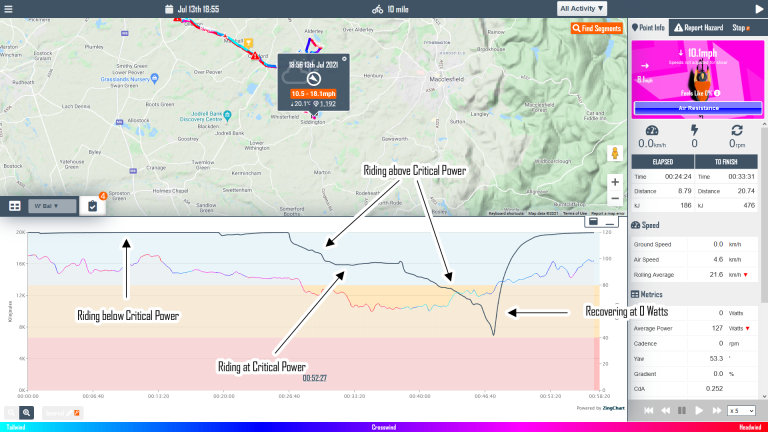
You can see in the graph that time spent above Critical Power depletes W’ and this is why having an up to date CP value is important for pacing – you don’t want to risk blowing up before the end or finishing with lots in the tank.
If you like pacing tools and racing with confidence, you can sign up to myWindsock here! If you want a more detailed explanation of Critical Power, or any other metric on myWindsock get in touch with us via our social media.
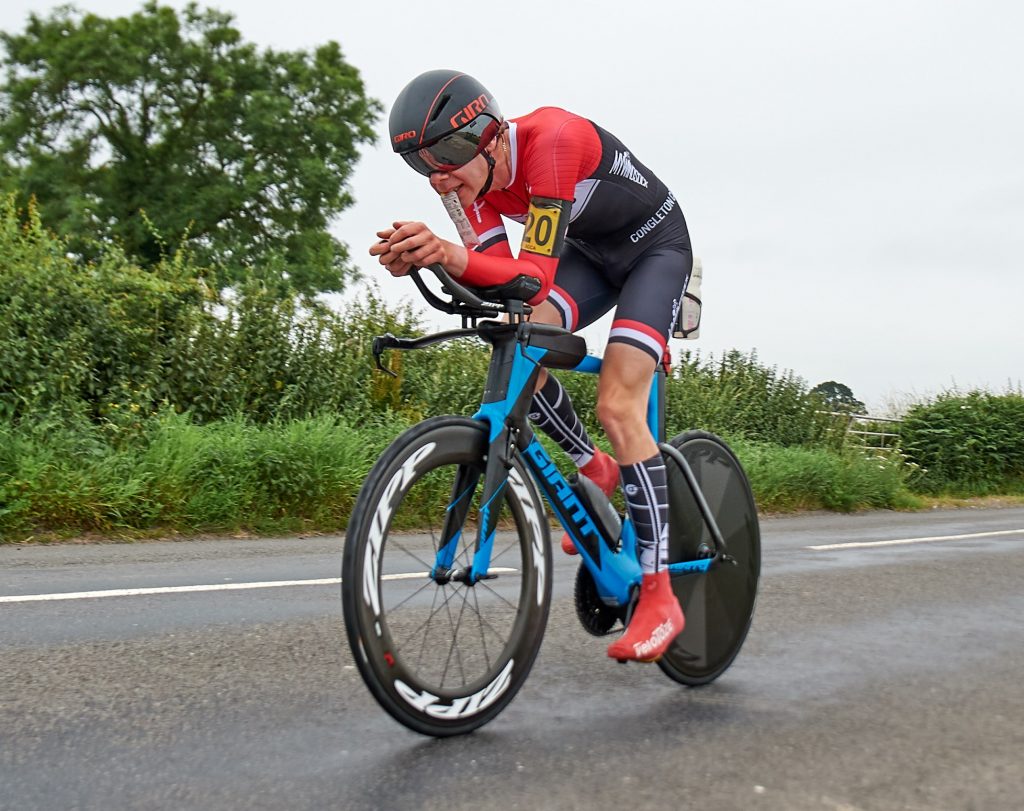
Why are winter time trials so much slower?
It’s January which means one thing only – TT season is round the corner (ok maybe it also means other things). Races are popping up from mid February which means some early season form testing is on the cards. You might find that, as a result of a really consistent winter, your power numbers are really good this time of year yet you churn out a couple of slow time trials before it warms up. New kit, new bike fit, more watts and still going slower, but why? Winter time trials are slow!
Rest assured, it’s probably nothing to do with how powerful or inherently aero you actually are yourself and is more to do with the conditions. Of course, by subscribing to myWindsock you will have confidence in knowing this as the conditions are taken into account and you’ll know it was a slow day with high Weather Impact.
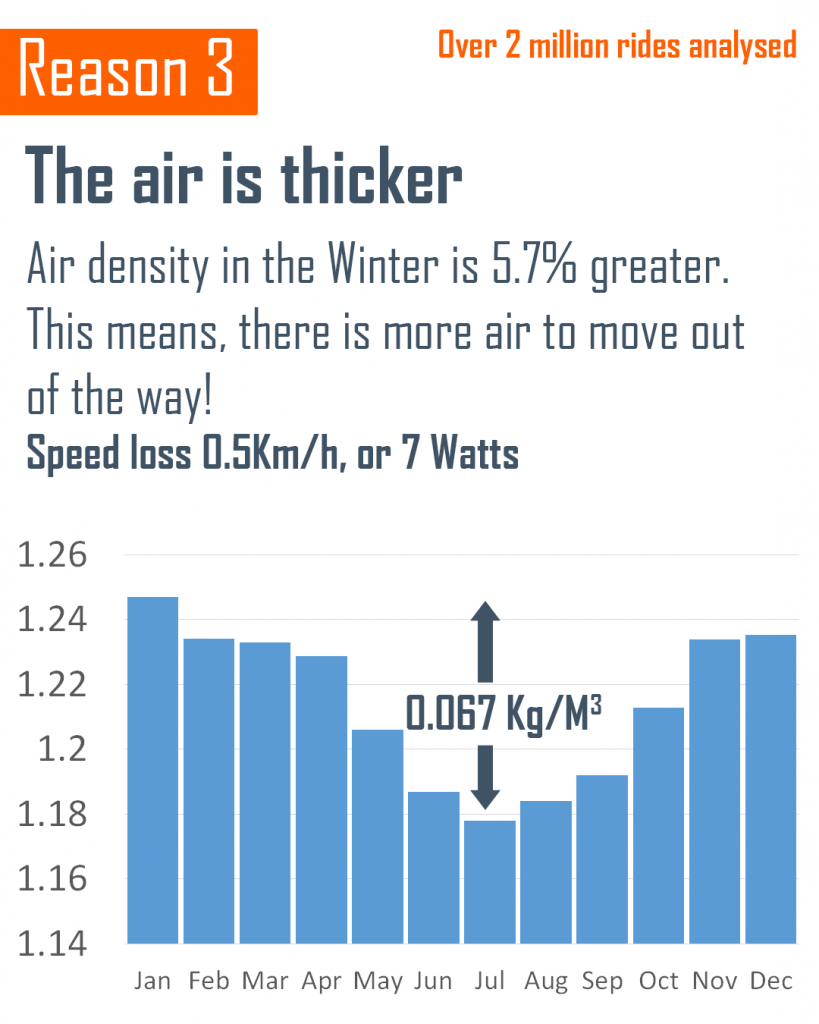
Cold is slow!
The speed you ride at for a given power on a given day with some given cda is proportional to one over the square root of the density of the air that you’re riding through. This basically means that as air density goes up, our speed will go down. Air density is impacted primarily by temperature. Hot molecules move faster and spread out more. This means more air occupies some given space when it’s cold compared to when it’s hot. In a time trial, the amount of space we need to pass through is fixed at the distance of the race, but the amount of air occupying this space varies quite a lot from one day to the next.
If you have left your house at any point since October, you might have noticed it’s become rather chilly. As time trialists, we think “gosh, the air is rather dense today” and people look at us like we have just started speaking Spanish. Cold days are slow days. It’s just the laws of physics.
If it’s slow, what’s the point of racing in February?
Time trialing is part art, part science. The ratio of art to science will vary depending on who you ask but everyone agrees, to get good at time trials you have to do them. As with anything though, blind practice only gets you so far. Practising with purpose is the key.
What would be handy is some kind of service which analyses your winter time trials and tells you how much impact the weather would have and how aero you are. Of course, you can see all of that information here.
Use myWindsock to dial in your pacing and kit choices so that by the time summer comes around you’re dropping massive PB performances with confidence.
Taking a World Tour KOM with the weather forecast
Back in September, I had a crack at taking a KOM off a world tour pro on quite a long climb. The pro in question was a Frenchman by the name of Thibaut Pinot. I wrote the whole story of the attempt in Cycling Weekly and you can read about it here but I didn’t cover the difference in conditions that me and Pinot faced. I’ve always been slightly suspicious that he had a slower day, as that would go some way to explaining the huge power gap that was overcome.
The segment
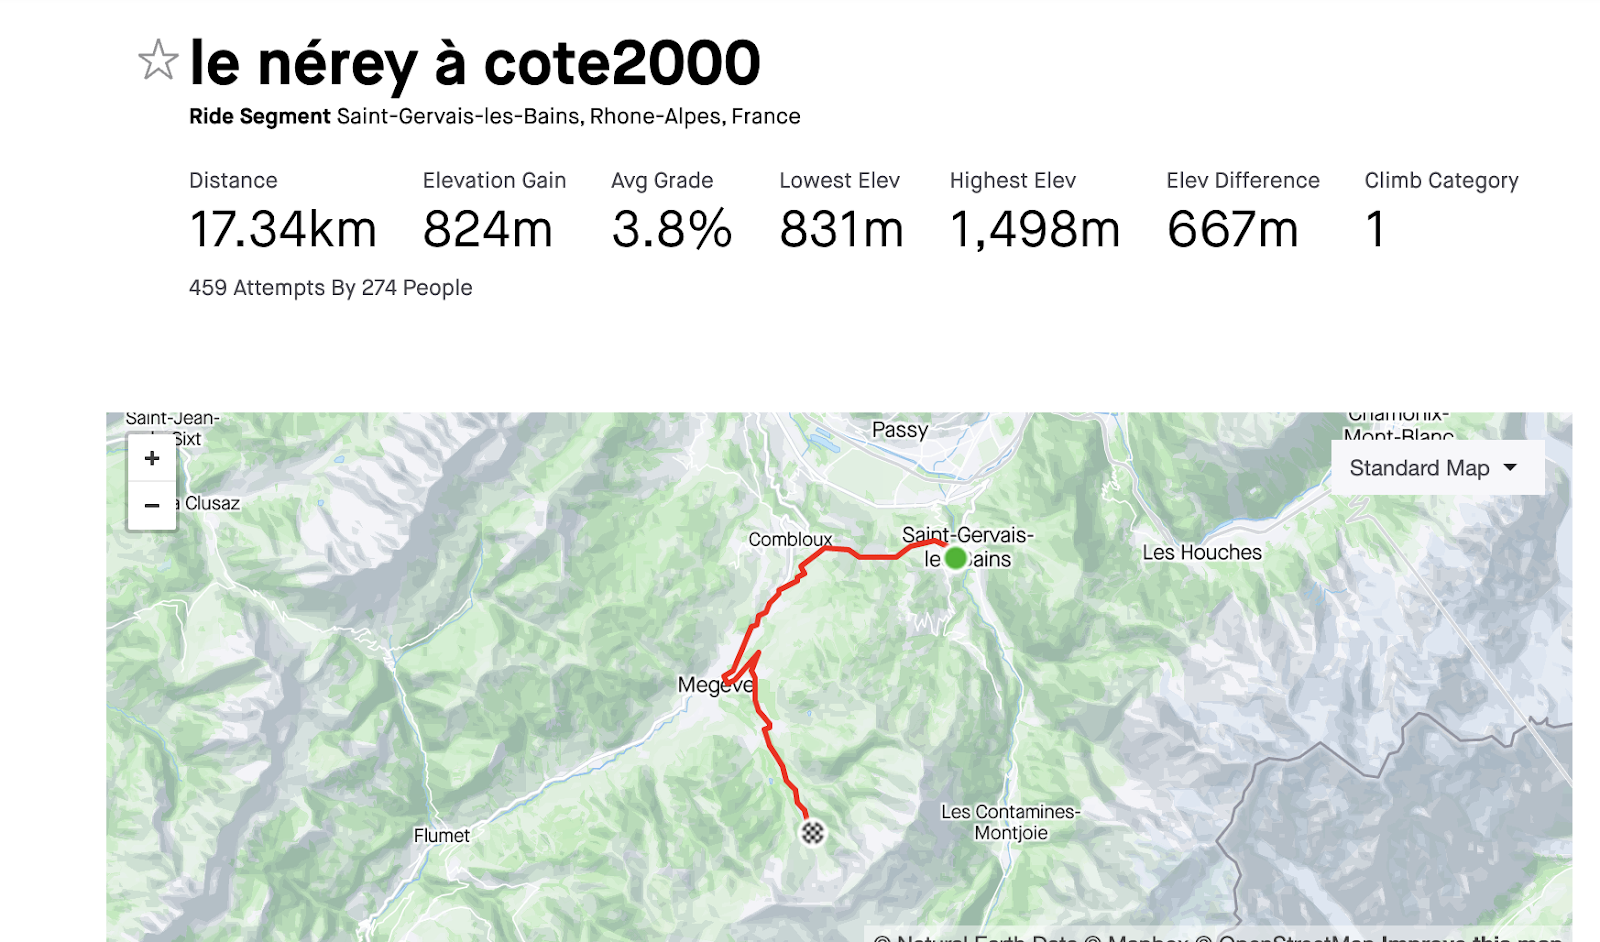
It’s a very long drag. The kind of climb that might even be faster on a time trial bike – especially if there’s no weight penalty as in my case. However, I rode it on the road bike as Thibaut did. It starts in the town of Saint-Gervais les Bains and finishes up at an alpine airport (an altiport) past Megeve.
To decide who had the fastest day, we will take a look at the various conditions and see who has the lowest wImapact%. This will tell us how much faster or slower the weather made us, a higher wImpact% means a slower day (a 5% wImpact% means we’d have been 5% faster on a windless day, for example).
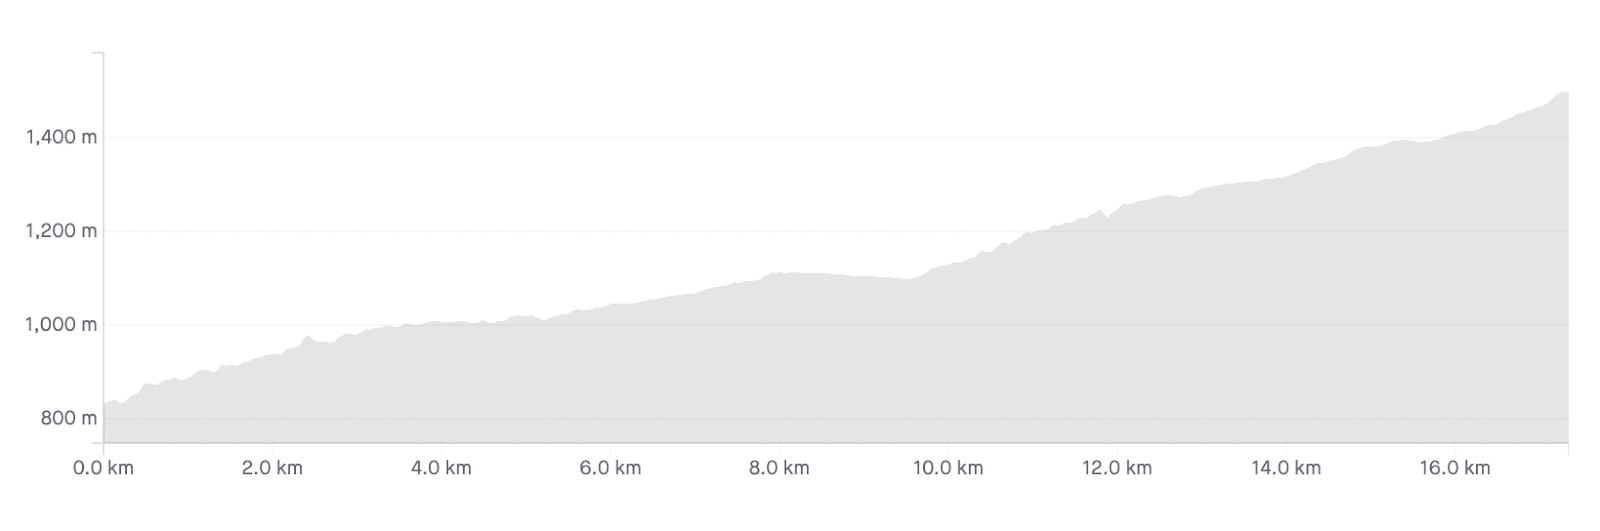
The pacing plan was to make use of the gradient changes. This segment doesn’t really turn into a ‘proper climb’ until 10 km in. This meant that the aim was to get to this point having used as little energy as possible and we will go on to talk about how that was achieved later.
Thibaut’s day
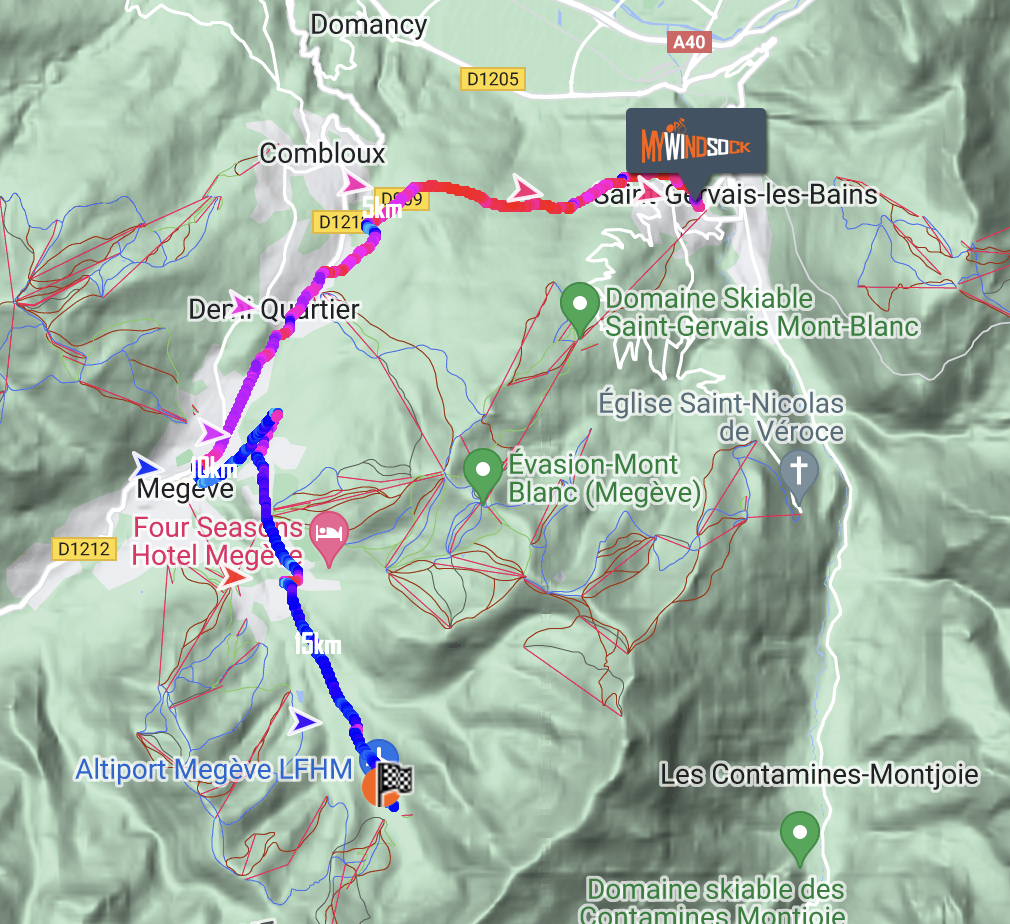
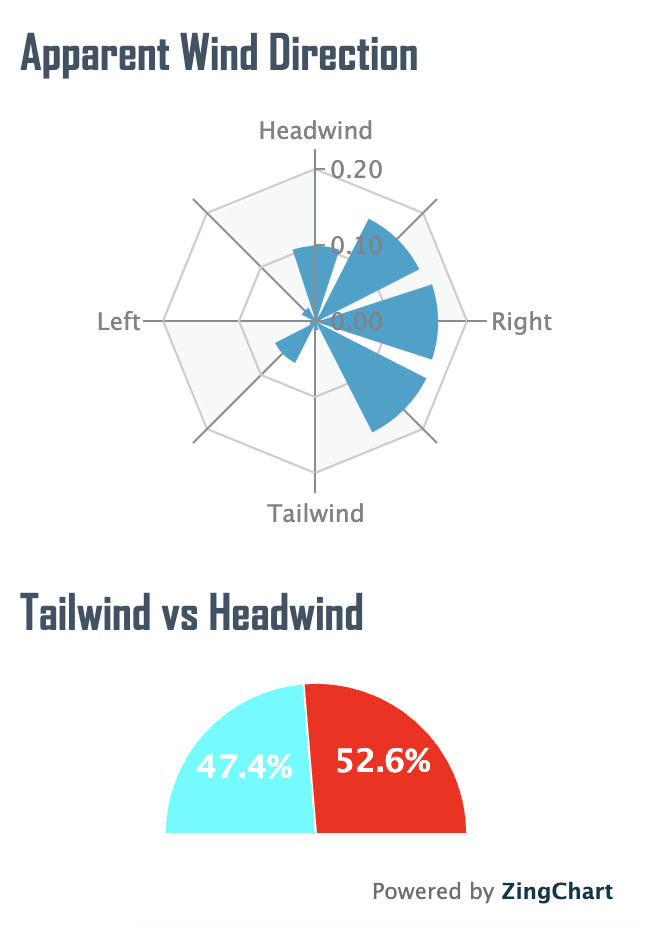
Taking a look at the map we can see that Pinot had a headwind on the early part of the climb, crosswind in the middle through Demi-Quartier to Megeve and finally a cross-tail up to the altiport. Broadly, the conditions he faced were relatively neutral in the sense that there was no dominant headwind or tailwind.
Thibaut Pinot had a wImpact% of 2.2% on the day that he took the KOM. He rode up the climb in a time of 40:31.
My day
I had a wImpact% of 1.8% on the day that I took the KOM. I rode up the climb in a time of just over 39 minutes. My day was 0.4% faster than Pinot’s – so how did I manage to put around 3% into his time? Let’s take a look at the wind map from my day.
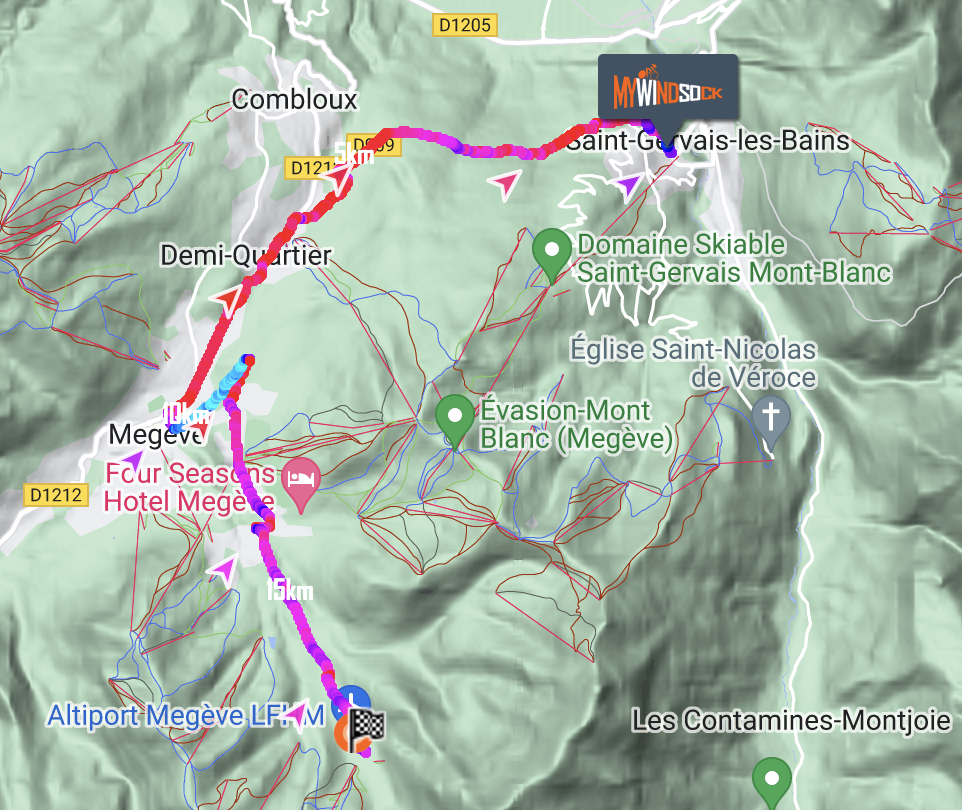
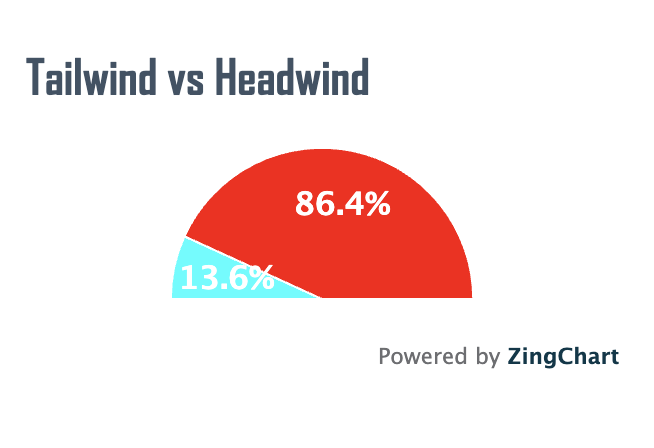
I had a very light headwind basically the whole way up. So, how did I do it?
Well basically we cheated a little by using my mate Harry to place the flatter sections. Here’s an excerpt from Cycling Weekly which explains our method.
“Harry paced the flatter sections for me. We avoided using the car for aero assistance as that felt unfair but, luckily for me, Harry provides a similar draft zone to that of a Peugeot Traveller and has a good amount of watts to offer up alongside, making him a perfect team-mate.”
This meant I could put all of my energy into matching Pinot on the steeper sections where the wind matters less and had Harry on the front on the flat, headwind sections meaning that he is the reason we took the KOM.
Even on a climb like this, air resistance was around 15% of the total resistance that I faced during the attempt. This is worth minutes and paints an interesting picture as to how important things like drafting and aerodynamics are on climbs, even at relatively low speeds of 25-26 kph as they were in this attempt. I am not faster than Pinot, despite outperforming the weather!
If you want to take a KOM off a world tour rider, you might wish to do so with the assistance of myWindsock. We can help you go into attempts like this with confidence and you’ll know what power you need to do for what duration for a given outcome. You can sign up here.
Adding a forecast to your planner
Often, we have a series of routes that we ride regularly. Each rider and club has their own version of these but the pleasure of the loop can depend quite heavily on the weather. One way to pick the best loop for a given day is by adding a forecast to your planner. From the planner you will see a summary forecast for each scheduled route.
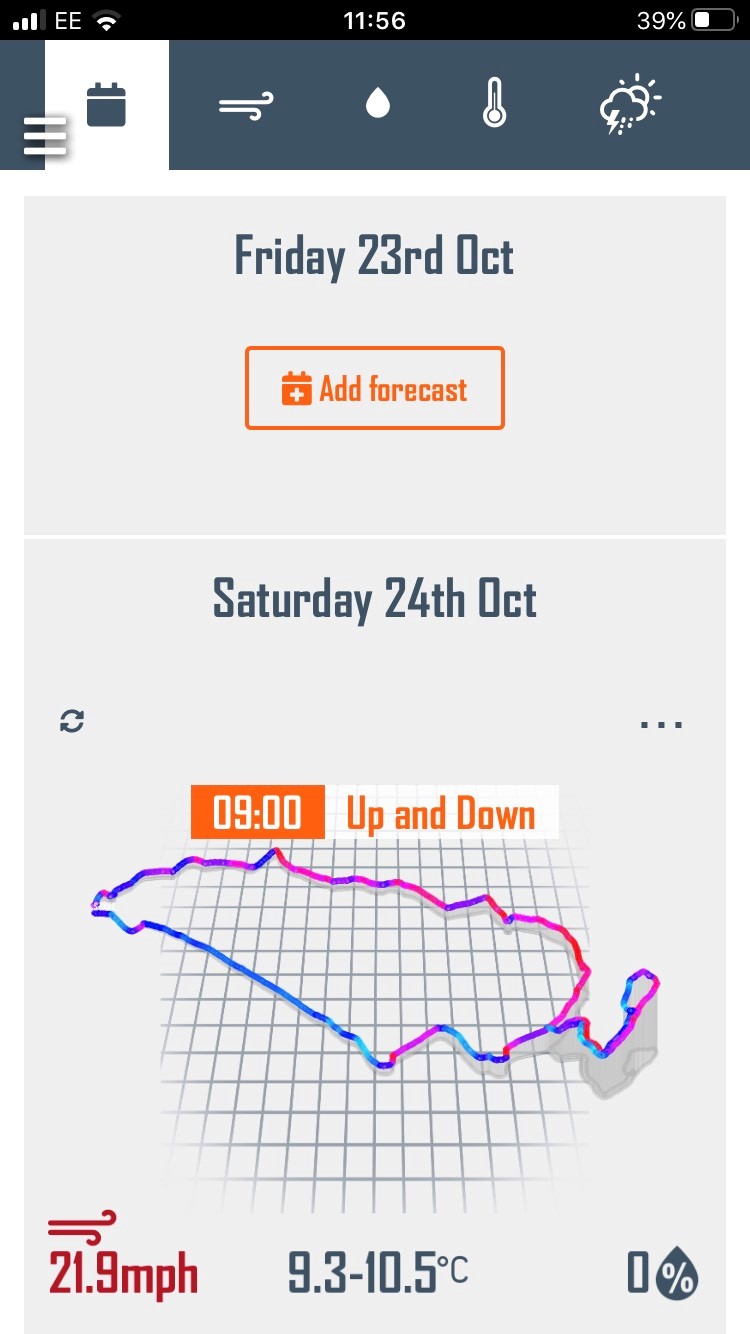
View your week’s weather
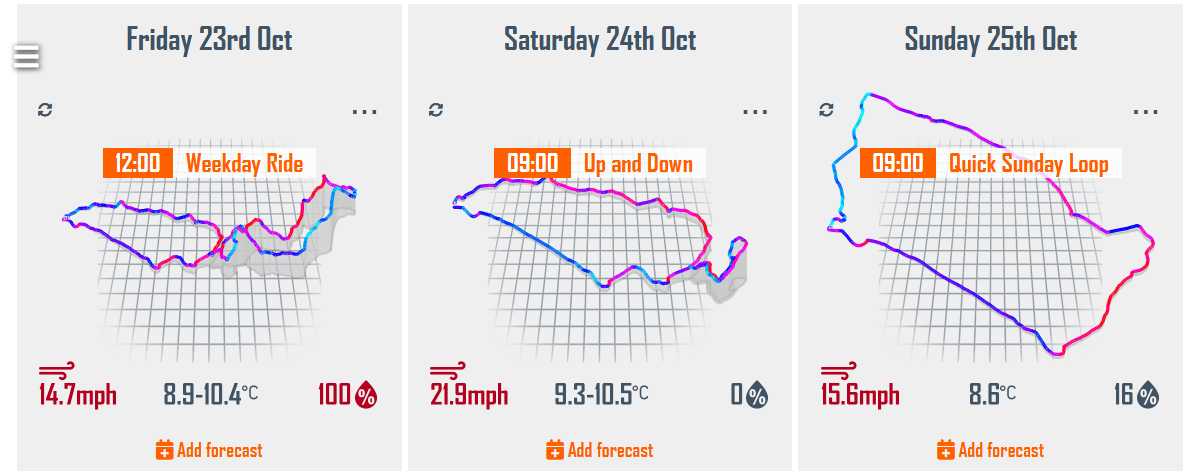
If you click on the given activity, you’re able to see a complete analysis but the summary information presented can be enough to make a decision on a given day if you know the route well. This can be done on the app or desktop. Adding a forecast to your planner is simple and we talk through it below.
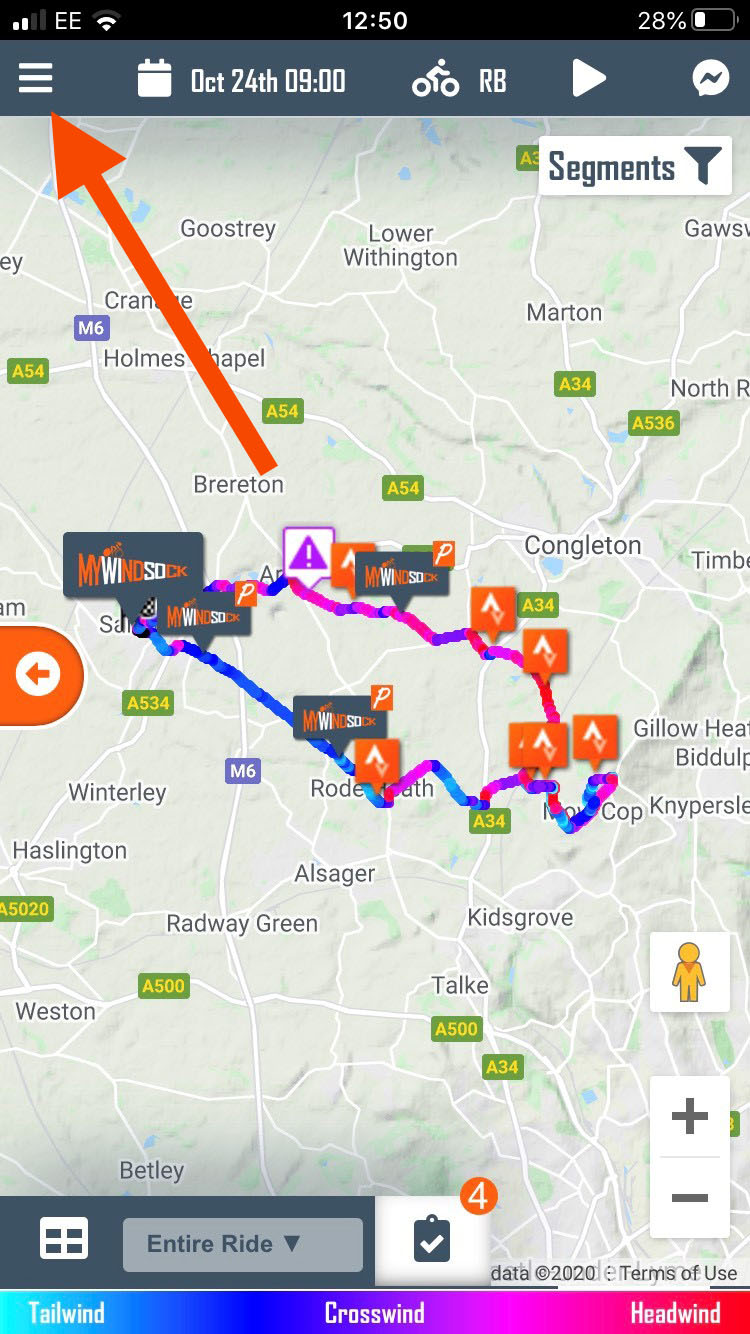
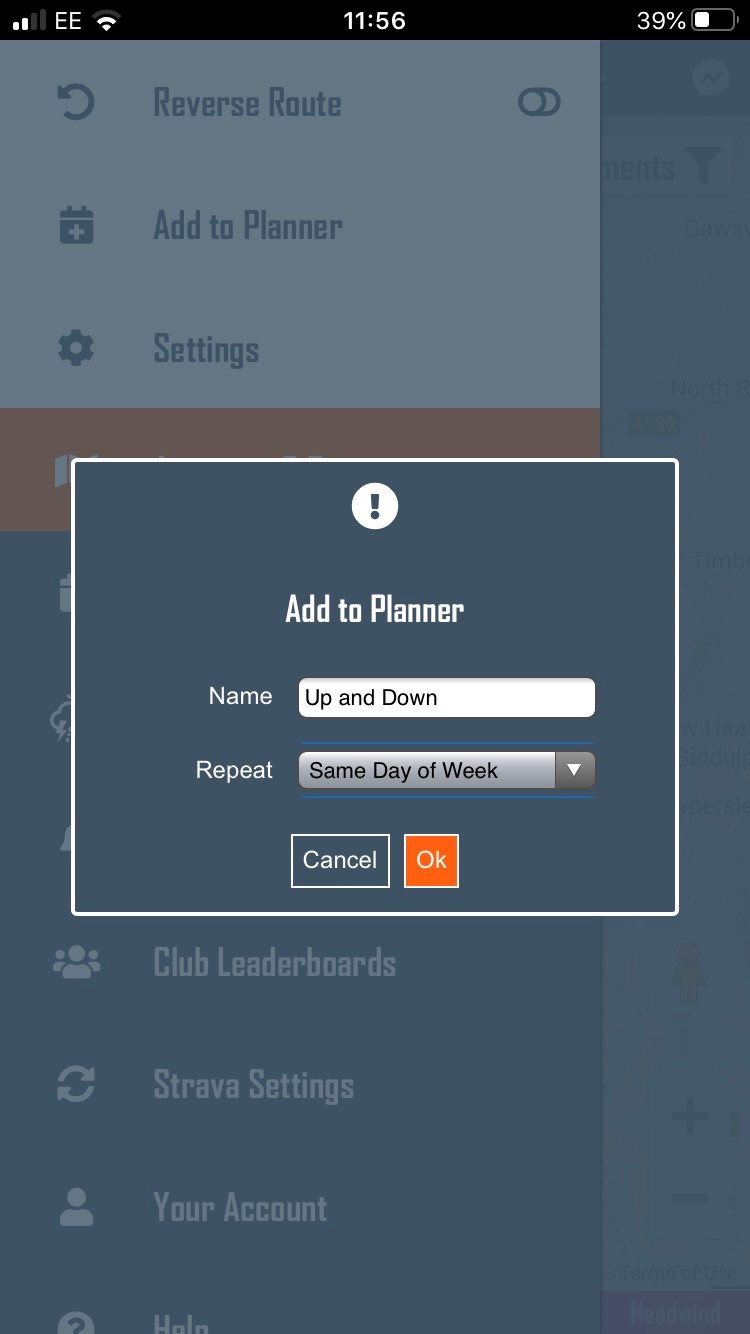
How to add a forecast to your planner

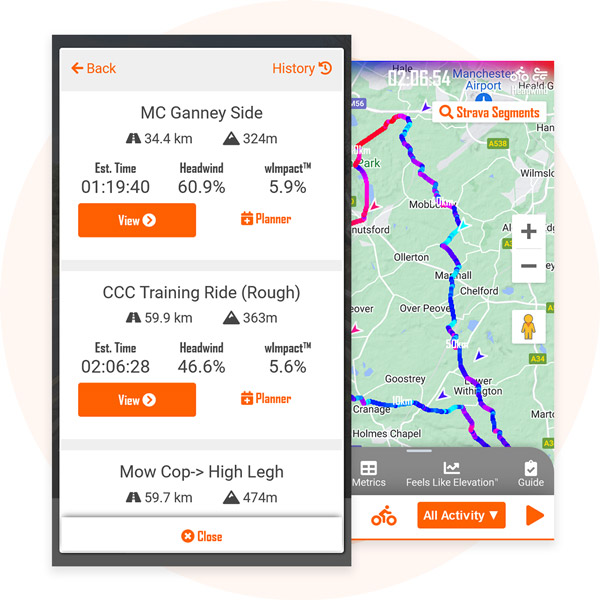
New feature: Live forecast stats on your Strava Routes menu
Picking the best route has just become a little easier. New to the Activities & Routes menu, time estimates, headwind percentages, and Weather Impacts™ for each Strava Route and Segment.
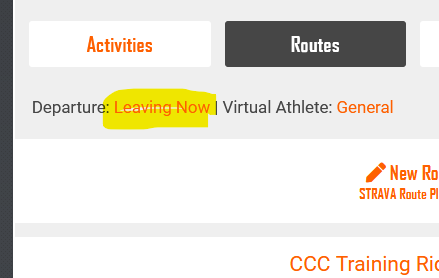
Setting departure time
If you are not leaving for your bike ride immediately, you can set the departure time as desired.
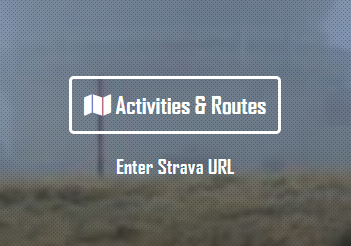
How to view Strava Routes and Segments
It’s easy to view all of your Strava Routes and Segments on myWindsock. From the dashboard, go to “Activities & Routes”, select “Strava” to begin.
Using the weather to plan your food
How much food do I need on my ride? Best check the weather. Ok, I know what you’re thinking, this is another MWS blog that is trying to make any topic about the weather but hear me out. Imagine for a second you’re doing the Ironman World Championships in Kona (or elsewhere…) where year on year the bike splits for the pro men can vary by up to 15 minutes, a time gap that’s amplified when you’re moving slower.
We know that nutrition is important for cycling, if you run out of gas and crack 15 minutes from the end of a ride it’s often enough to ruin the ride. Now, imagine you’re doing some kind of ultra endurance event that’s self supported, the amount of food you carry at any one time can make a big difference. There’s a balance between carrying enough to get by but not weighing yourself down.
In order to pack the right amount of food, you need to know the answer to two questions. How many grams of carbohydrate do I need for an hour? How many hours will I be riding for? In both the forecast and post ride analysis, myWindsock calculates energy expenditure on your ride at various points and the total amount of energy used across the whole ride.
This is where our forecasts can be valuable. Check the weather along the route, decide on your clothing. Check how long your route will take this week, pack the appropriate food. If you want to start forecasting your rides and going out well prepared, check out myWindsock here!