Is it possible to save minutes just by pacing optimally? Without getting fitter or more aero? Let’s take a look…
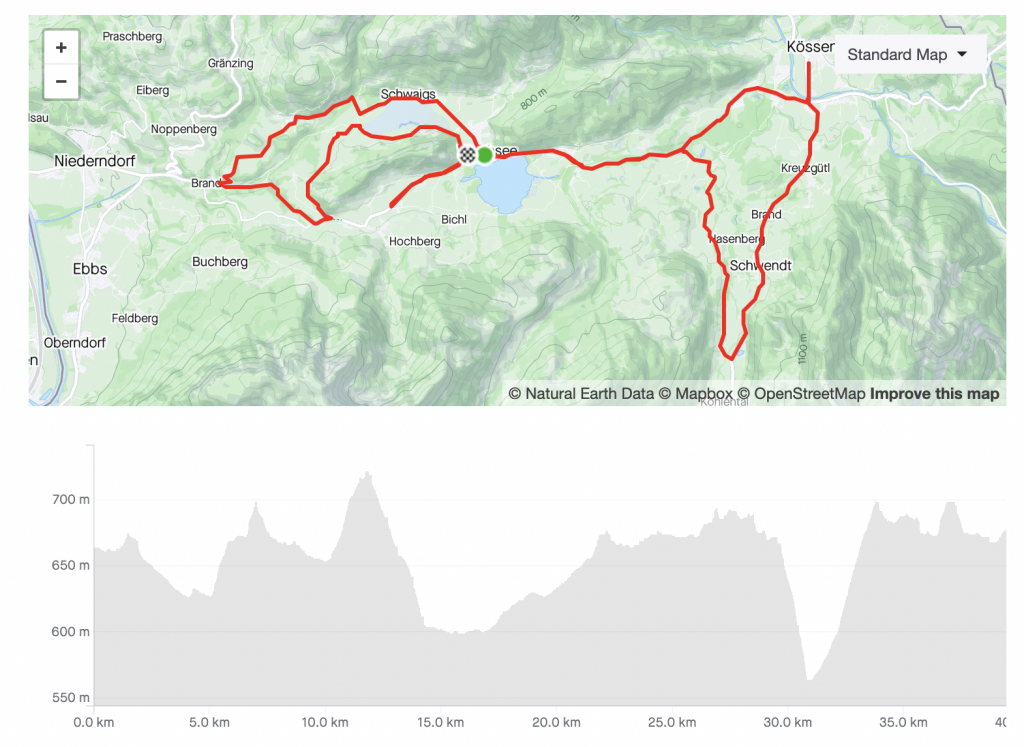
Two laps of this Strava segment are in question today – the aim is to try and get two laps done in as close to 2 hours for 300W as possible with an 85kg rider who is moderately aero (with a cda of 0.24). Let’s see what we get when we plug the course into myWindsock.
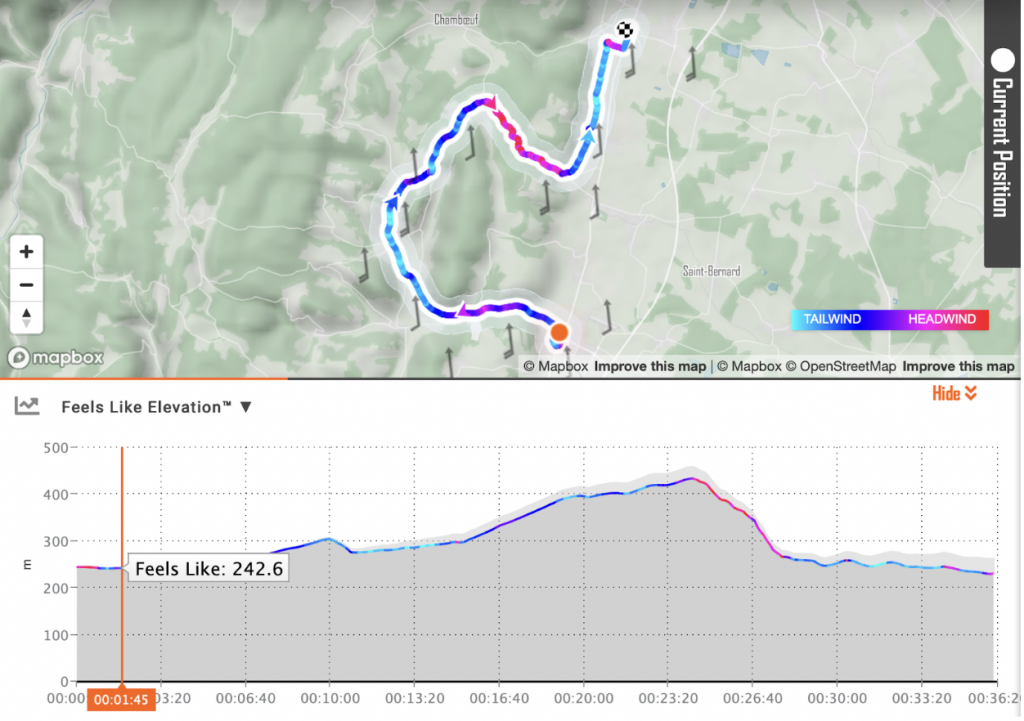
We start out with a time of 2 hours and 10 minutes for a normalised power of 210W. Now we can take a look at the power-time relation for this run.
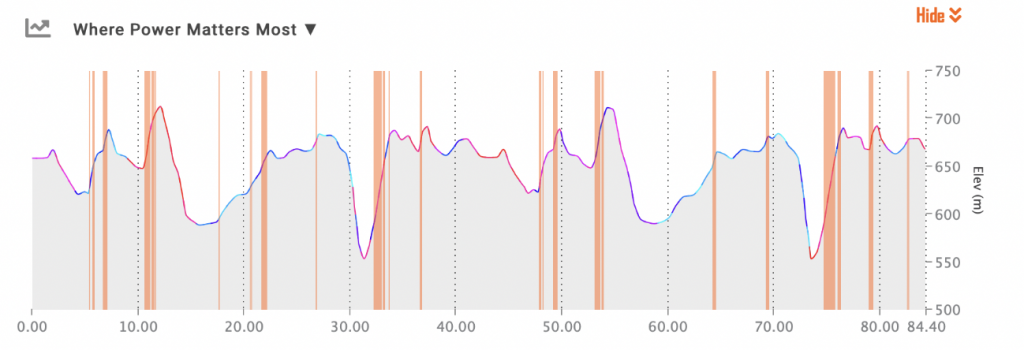
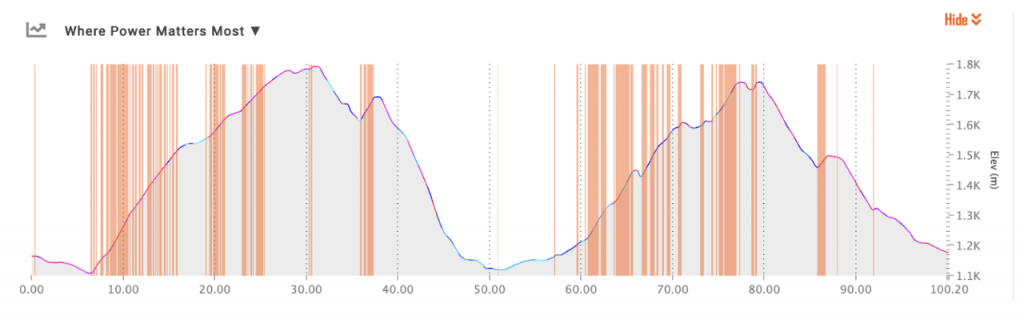
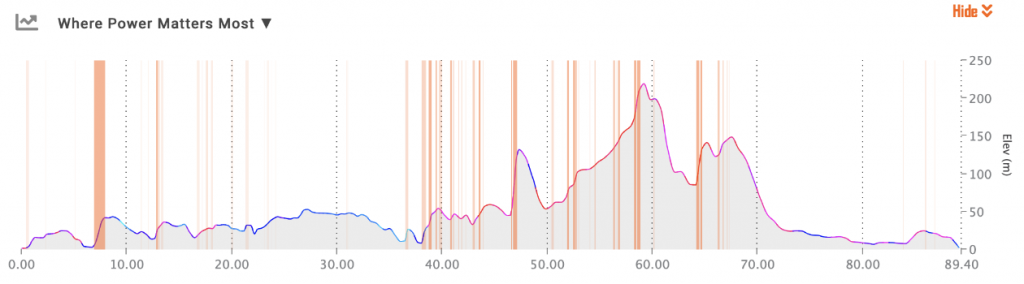
Here is our flat power curve, the spikes are just to get moving again on the steep gradients at the bottom of the descents. The climbs and descents are the main reason for pacing being so important with there being around 1000m of elevation in the whole TT. Let’s take a look at the breakdown of that elevation to come up with some pacing rules…
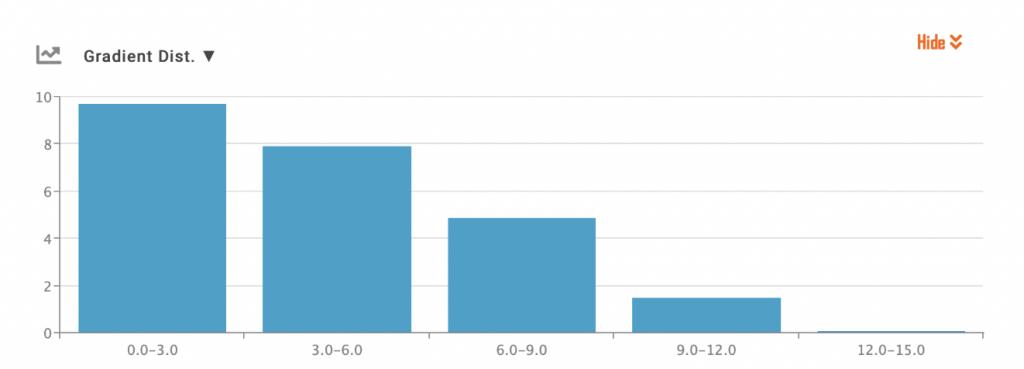
The majority of the climbing on this course is at less than 3 percent, the sort of climb you might go up in the big ring. At this point it’s important to remember to invest more energy into steeper sections where the rider will be moving slowest – the best plot to look at this is “Where Power Matters Most”.
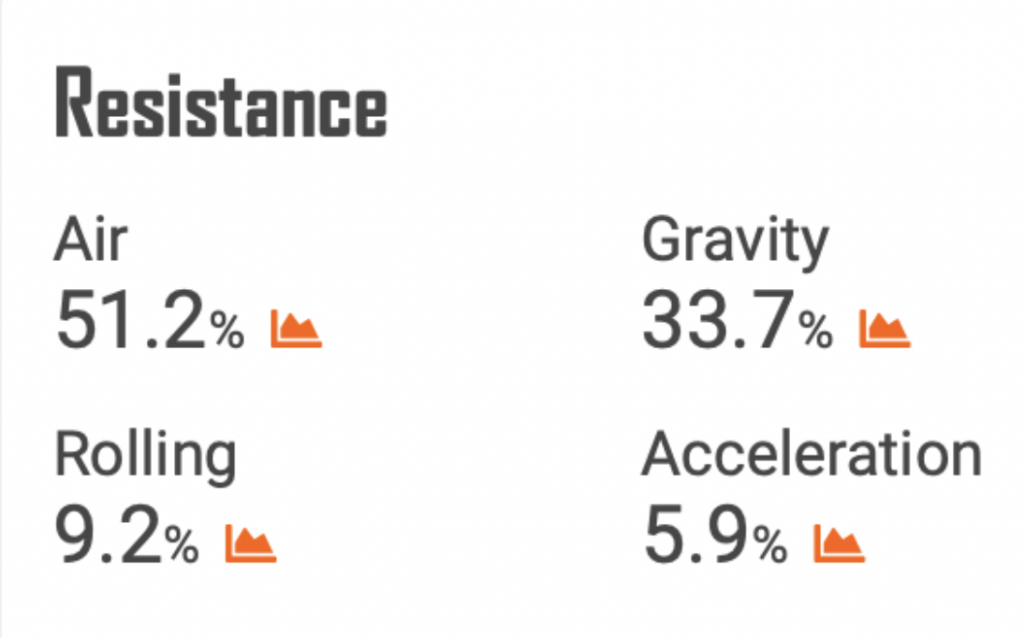
The orange bars represent areas on the course where the return on investment of energy is greatest – you’ll notice that these are pretty much all on climbs where gravity is the main source of resistance vs air resistance. This is because speed increases more at lower speeds (so your speed might double for double the power, rather than increasing one or two percent if you double the power at high speed). Let’s take a look at the resistive force breakdown on this loop…
We want to invest “over” our average pace in 33.7 percent of the ride – when we are fighting gravity. As here, we get more return on energy investment.
The aim – get as close to 40kph as we can…
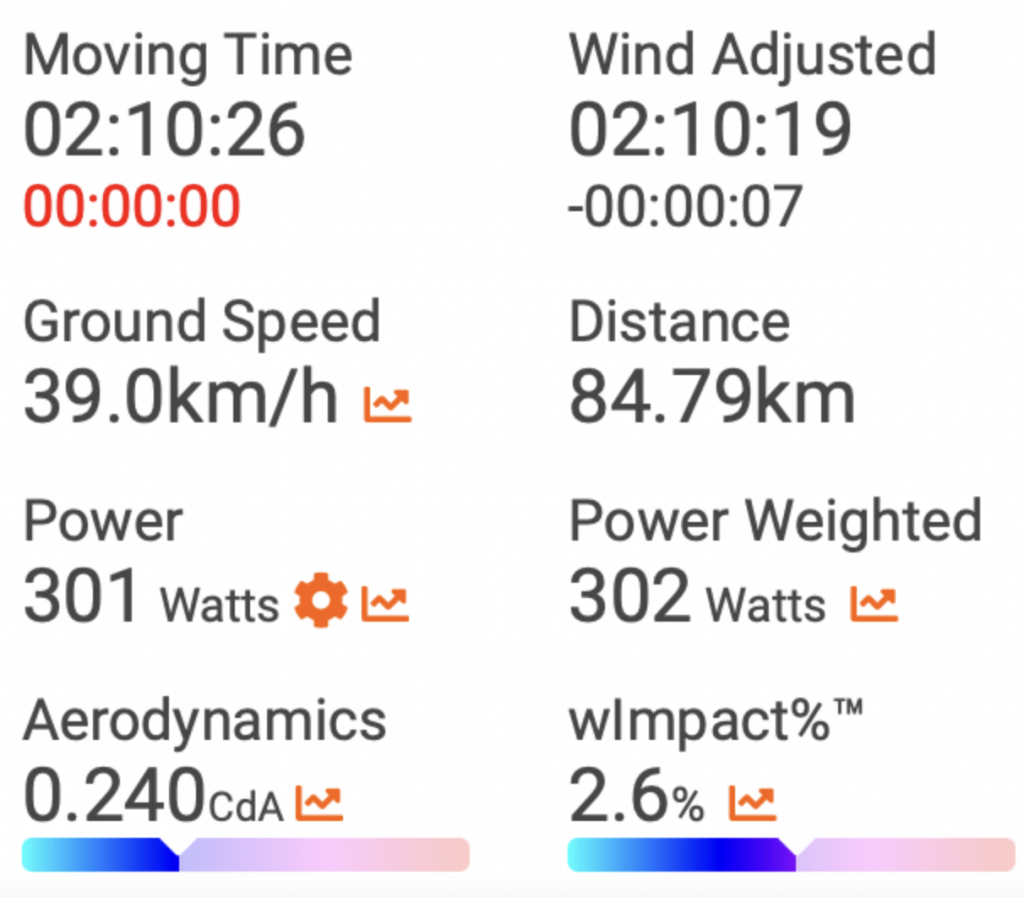
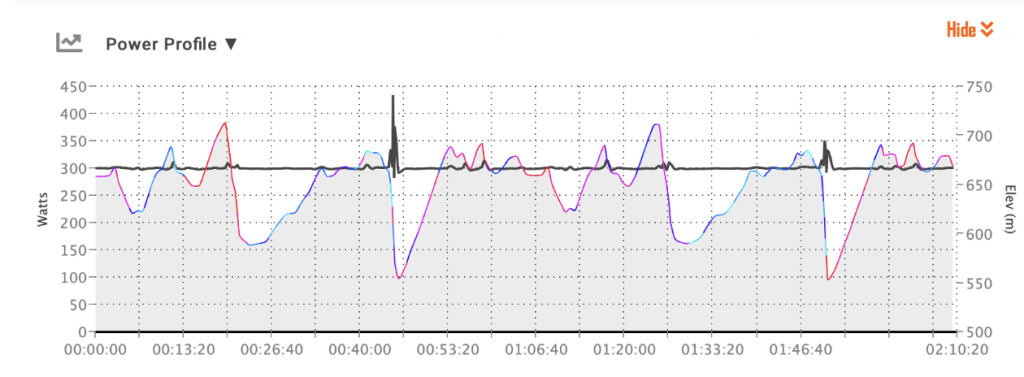
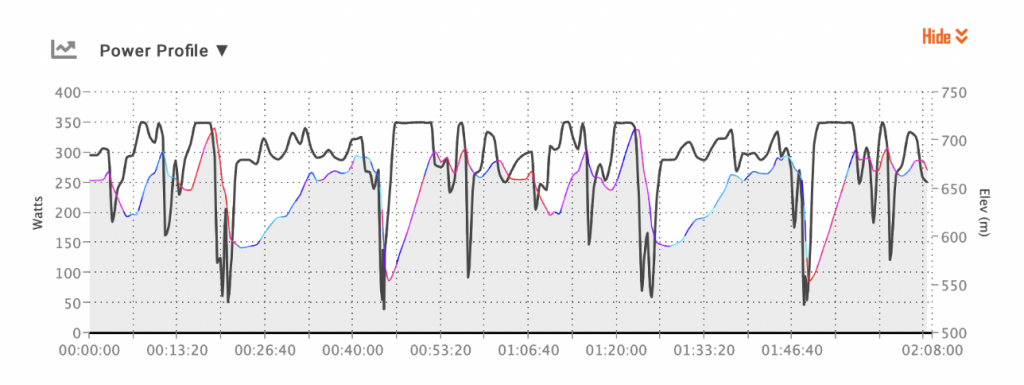
39.7kph was as good as I could get without getting more aerodynamic. I actually reduced aerodynamics allowing for sitting up on the ascents. This was a achieved with the following power profile…
For this, we set a hard cap on power at 350W, dropped it down to zero watts when descending and riding the flats at just under 300W. The result is a two minute time saving for an average power that’s 10W lower, aerodynamics being around one percent slower and for a normalised power that’s 3W lower. So, the result of pacing more effectively is a two minute saving at a lower power and being less aerodynamic.
Pacing your efforts is much easier with myWindsock. It’s the only place you can virtually test pacing strategies without having to ride them on the road. Pacing can make a bigger difference than anything, especially on rolling and sporting time trial or triathlon courses. It’s not just for solo efforts though, myWindsock can also help you spot the best place in a road race to attack! Sign up here.
In recent weeks we’ve seen two of the current crop of elite GC talent put on amazing time trials, Pogacar in the Giro and Remco in the Dauphine. The really interesting thing about this is that both riders beat “TT specialists” – Tarling was bettered by Remco Evenepoel while Ganna was beaten by Pogacar on stage 7 at the Giro. Both of these efforts were over rolling courses too and relatively long (more than half an hour) which gives us quite a rare opportunity to compare two relatively comparable time trials that took place in different countries.
What happened at the Giro – a reminder:
Tadej Pogačar of UAE Team Emirates stormed to an impressive victory on stage 7 of the Giro d’Italia back in May, dominating the 40.6km individual time trial from Foligno to Perugia. His stellar performance not only extended his lead in the maglia rosa but also brought him closer to clinching the overall victory.
Filippo Ganna from Ineos Grenadiers initially set the pace with the fastest times at both intermediate checkpoints, hinting at a potential victory for him. However, as Pogačar tackled the final climb towards the finish line, the suspense escalated as Ganna’s substantial lead began to dwindle. By the finish, Pogacar took the victory.
What happened at the Dauphine – another reminder:
On stage 4 of the Critérium du Dauphiné, the European time trial champion, Josh Tarling of Ineos Grenadiers, delivered a scorching performance but fell short of surpassing the unstoppable Remco Evenepoel from Soudal Quick-Step. Despite Tarling’s impressive run, Evenepoel, the reigning time trial world champion, seized the lead with a remarkable time of 41:49 over the 34.4km course, ending Tarling’s reign in the hot seat.
Tarling set the early benchmark, finishing just 17 seconds behind Evenepoel in second place, while Primož Roglič of Bora-Hansgrohe secured the third spot, trailing the winner by 39 seconds.
The competition remained tense through the first two time checks, with Evenepoel and Tarling neck and neck within a few seconds of each other. However, it was the Belgian rider who made a decisive push for victory in the final kilometres, securing his dominance on the stage.
Who was better?
On the fifth of July, the first of two Tour de France TTs will take place over a 25.3km course with 300m of elevation gain and the course will likely take the riders around 30 minutes – so relatively similar to the TTs we are comparing in terms of energy systems used by the athletes. The way we will decide whose TT was better is to back calculate the riders watts and cda based on their performances and what information is available and input these performances onto the course for the Tour de France stage 7 TT on July the 5th. On the surface, Remco Evenepoel’s TT looks streaks ahead of Pogacar’s – however, I have Pogacar’s performance as around 5% “better” in terms of power output for the estimated cda (however, all of these are estimated as neither rider publishes their power and, as a result of this, 5% is within the margin of error).
What will happen at the tour?
The TT suits both riders, it’s quite long and rolling. If we plug in our estimates from the TTs that we’ve seen from both riders so far this year, we get 29:25 for Remco Evenepoel and 29:26 for Pogacar with a margin of error of roughly ±30s for each rider (under predicted conditions) though we will revisit these predictions with a more accurate weather forecast in the days before the TT.
During the grand tours, myWindsock is the place to be for TT predictions. We will provide predictions for the entire race and specifically, the two TTs for the GC top 10 as well as TT favourites.
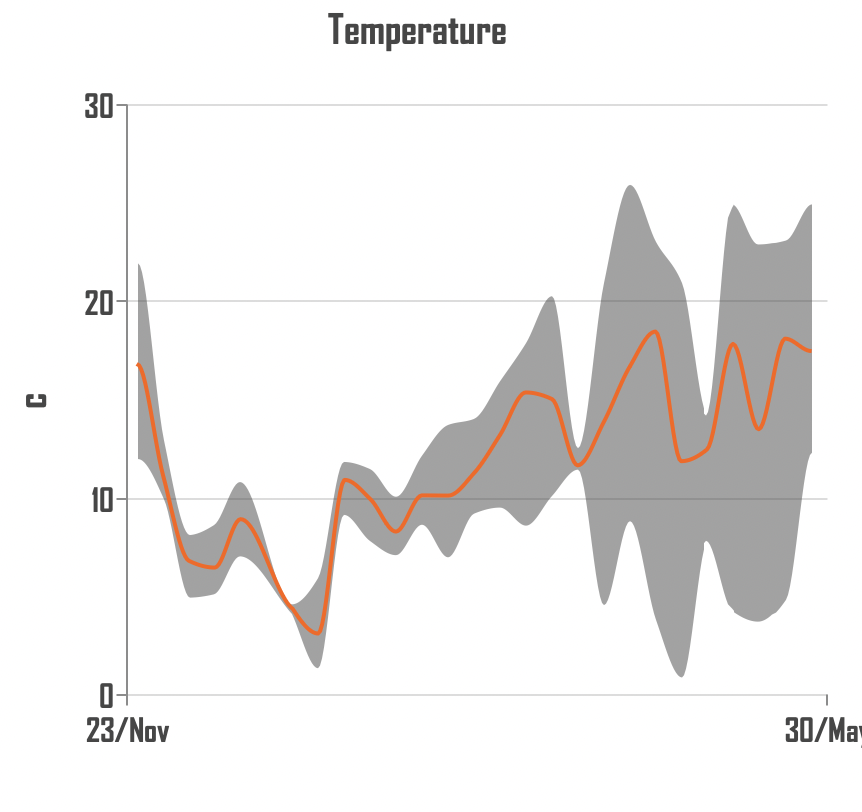
We often neglect to highlight our own features here at myWindsock and one thing that we don’t talk about enough is our trends dashboard, what these charts mean and how to use it.
Temperature over time
This plot shows you how the average temperature of your weekly riding changes over time, as well as the range of temperatures that you’re riding in. You can spot that, for me, April and May were months where it was tricky to get my layers right!
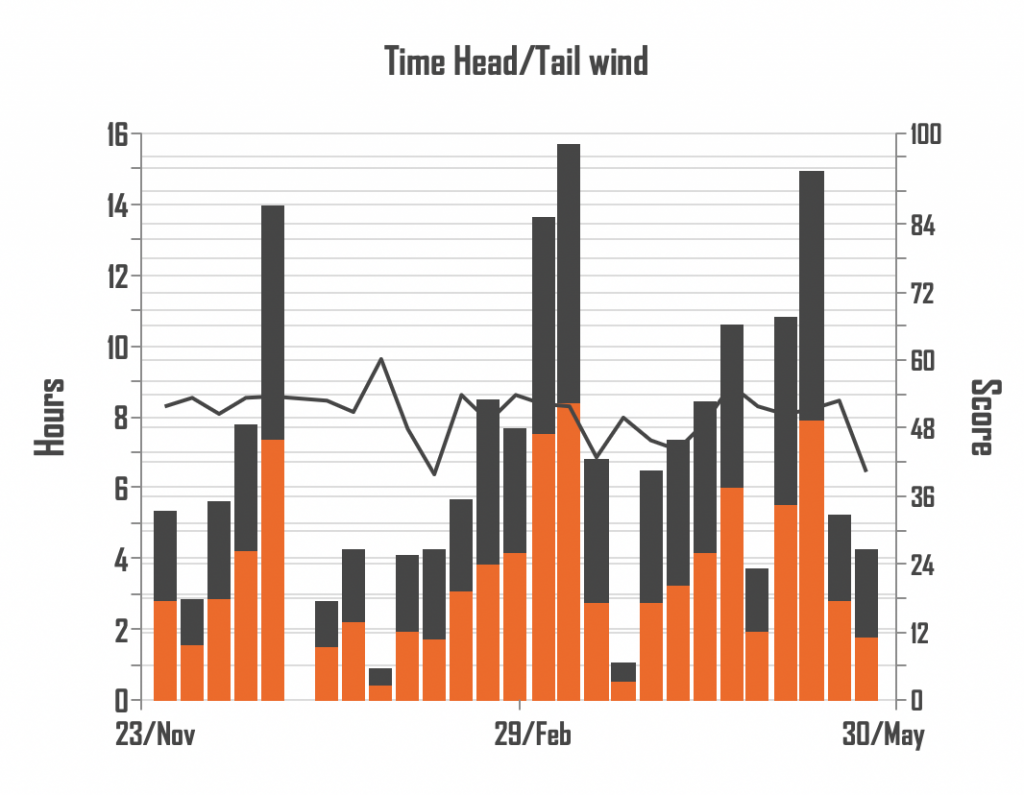
Head wind vs Tail wind
Some weeks just feel like you’re riding against the wind all the time but, according to this graph, it’s only half the time… Reassuring to know I don’t have constant headwinds though.
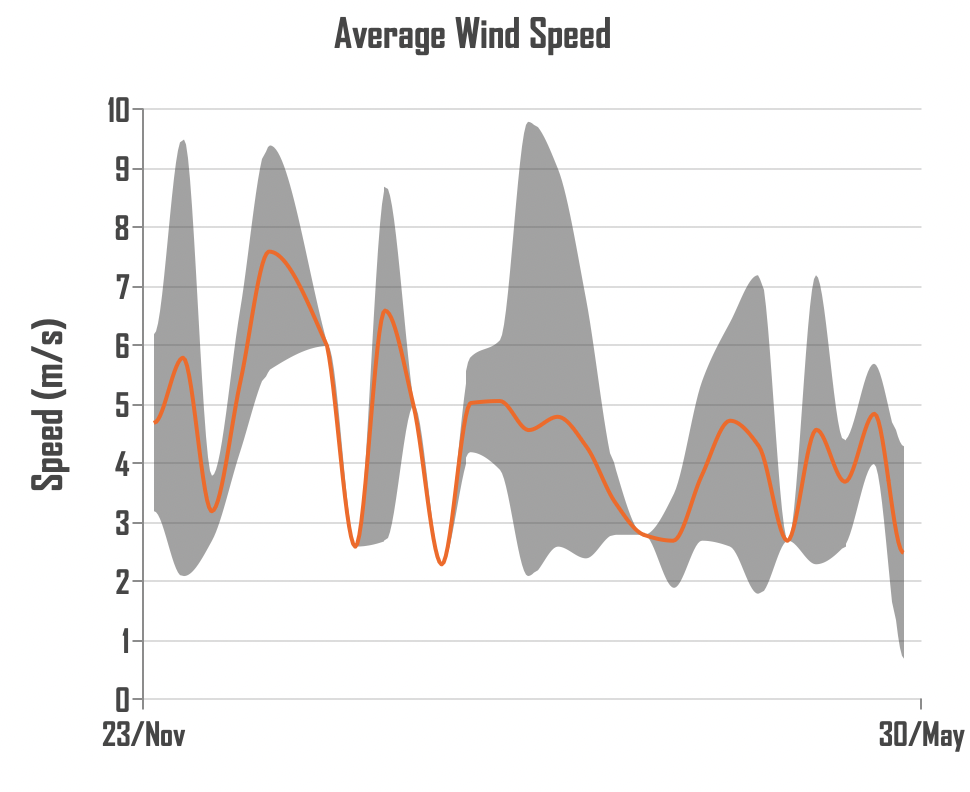
The average wind speed plot
Interestingly, you’ll notice as the temperature began to swing more wildly for me in April and May, the wind died down a little. My average wind peaked in December (I was in Belgium for most of December, so that doesn’t come as too much of a surprise for me).
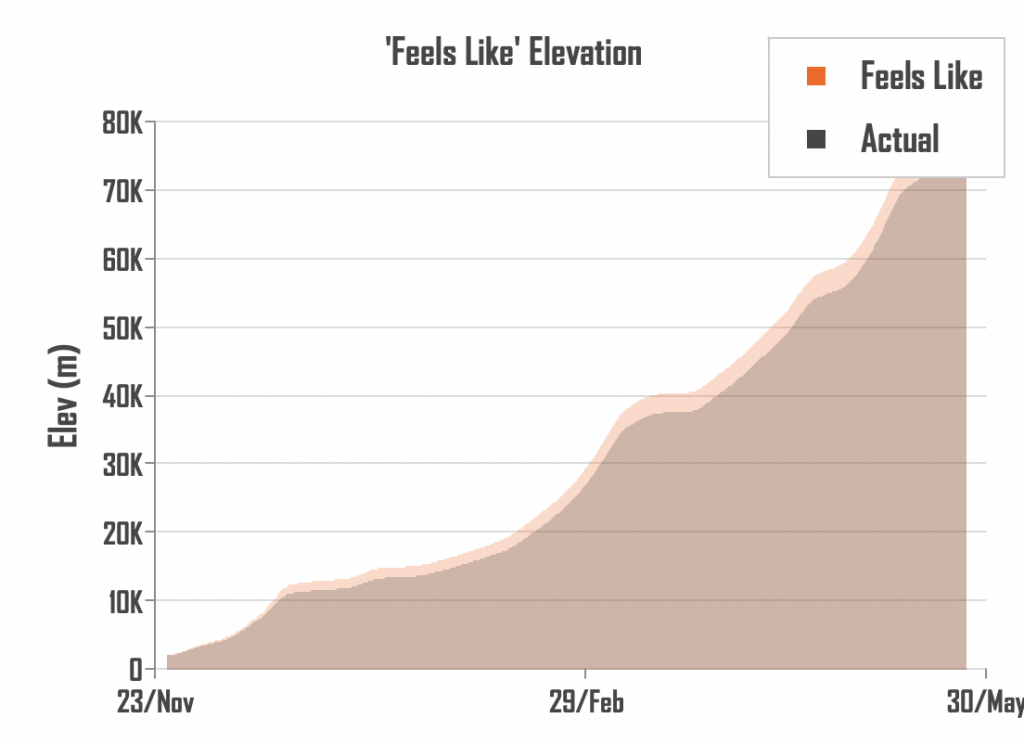
Cumulative “Feels Like” Elevation
This plot shows how my feels like elevation has been increasing since I started back training again. It basically just adds each week onto the last and you can see the culmination of the work that you’ve done against the wind and gravity.
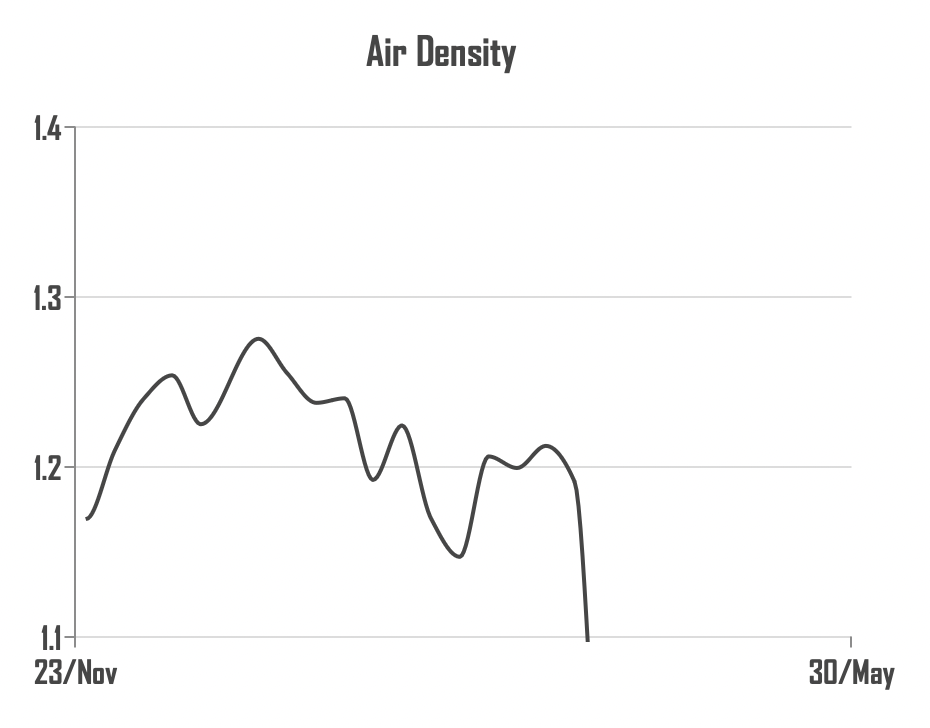
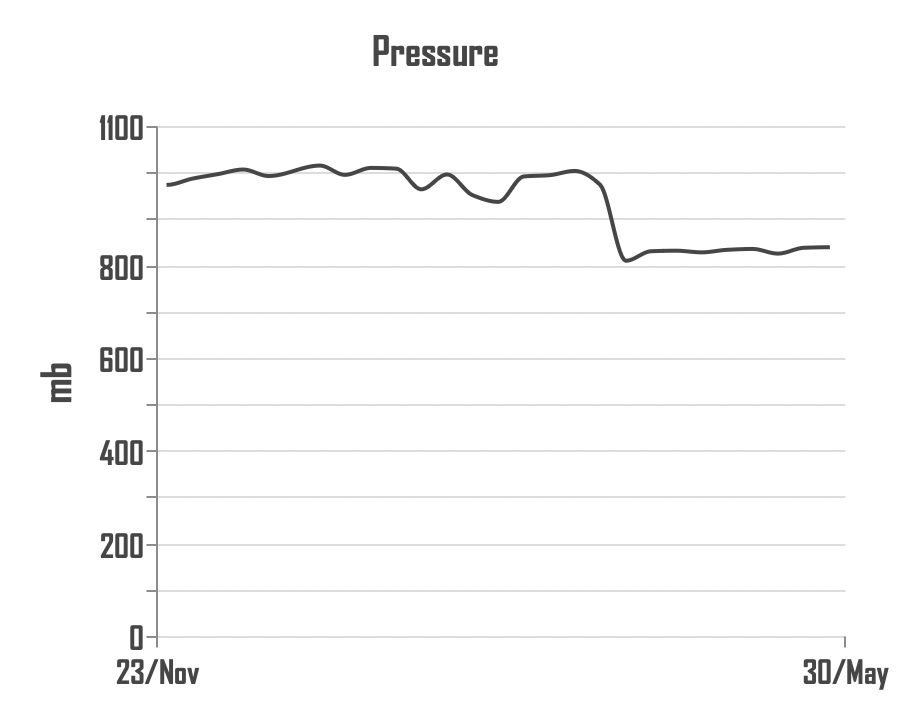
Can you spot when I went to altitude?
As you go up, air pressure and density both drop. This change is pretty marked. In early April I went to Andorra and have been staying up at 2100m above sea level. You can see the impact this had on air pressure, density and the range of temperatures that I faced!
For insights like these into the weather you train in, or to get ready for your next race, sign up to myWindsock here.
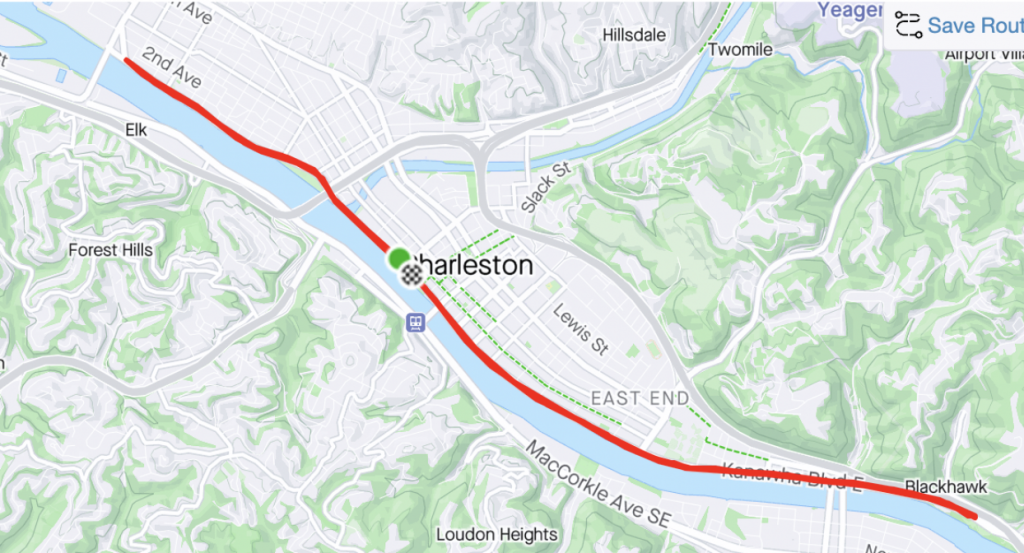
Taylor Knibb is a professional cyclist and triathlete from America. She has recently qualified for the Olympics for triathlon, which most people expected, but then won the USA national TT championships to punch her ticket to Paris for the TT as well – which less people expected, including Knibb herself who said, “I’m in shock and so is my whole team. We just wanted to go out, give a good effort, and see — hopefully improving on last year. But it just all came together.” She beat a double world TT champion in order to win, so she wasn’t racing any Mickey Mouse field. This isn’t the first time a triathlete has dabbled in time trialing in recent years, with Canadian Paula Findlay racing in Stirling at the UCI World Championships in 2023.
The nice thing about the USA National TT championships is all the riders take on the same course which means we have a larger pool of riders to pick from when calculating power numbers to figure out if Knibb can win in Paris. She also managed to top 20 the men’s race, which in a country as big as the USA, is quite impressive.
The course suited Knibb, a rider not known for her technical prowess, out and back along the river that runs through Charleston. The Paris Olympic TT is the polar opposite of this with many turns on a course that will be hard to recon (as Paris is a rather busy city). The technical aspects of the Paris time trial course will favor more skilled riders. However, a notable feature is the long, straight 5km stretch at the end, which will allow Knibb to make up any time lost in the corners. In this section, raw power and aerodynamics (watts/cda) will be crucial.
Can Taylor Knibb actually win in Paris? Three Olympic time trial gold medals have been won by American women in the past – all of which were Kirsten Armstrong, and there’s been a few others winning silver and bronze along the way. There’s most definitely pedigree and it should tell us that USAC aren’t sending her as a publicity stunt.
Figuring out whether Knibb can win in Paris is a question of working out how fast she could ride the course based on what she did at the USAC national championships then working out how fast the women’s winner of the Paris TT might go – a slightly more difficult task.
Estimating Knibb’s numbers
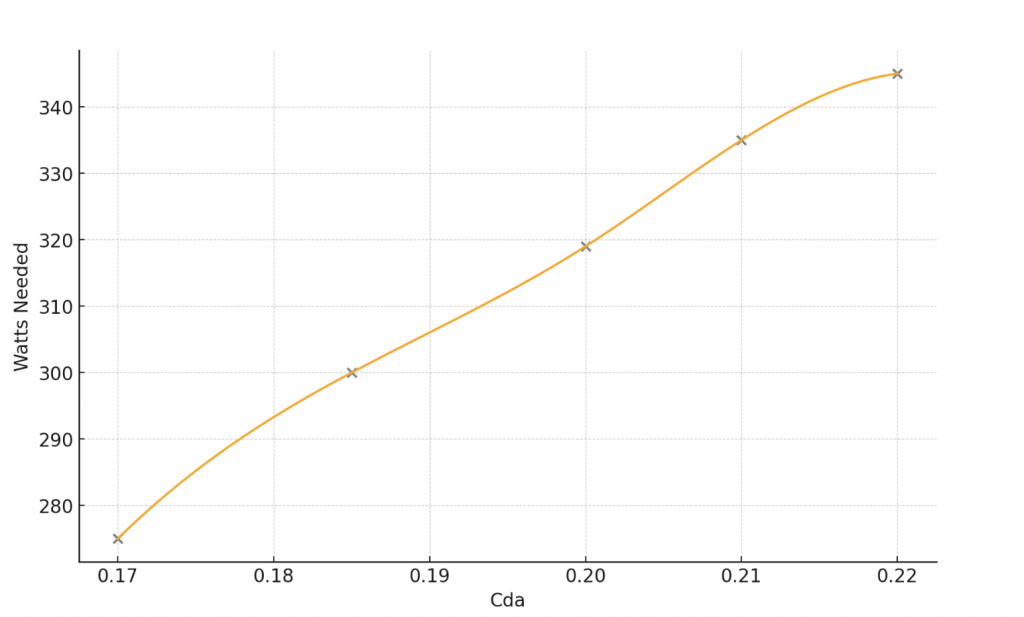
Triathlete Taylor Knibb (Boulder, Colo.; Trek Factory Racing) secured the National Title in her second-ever Time Trial National Championship, finishing with a time of 41:54.69. Fixing this time, we’ve had a look at the various different combinations of power and cda required to achieve this time.
It’s likely that Taylor Knibb’s performance lies somewhere along (or close to) this orange line – exactly where is hard to say without access to her power meter but either way, her performance was very impressive.
Is it enough to win in Paris?
There’s likely gains to be found in Knibb’s set up when it comes to aerodynamics. Purely because she has not been time trialing long – she has great sponsors and a manager who understands what it takes to win an Olympic gold medal (her manager’s wife is Gwen Jorgenson, winner of the triathlon in Rio). The woman’s TT is likely to be around a 40 minute effort in Paris – not dissimilar from the USA national championships. There are around 15 corners in the TT route in Paris and Knibb will have to improve technically between now and then to be in with a chance of winning.
Stage 14 is a flat TT this time round – no hill for Pogacar to ruin Ganna’s day!
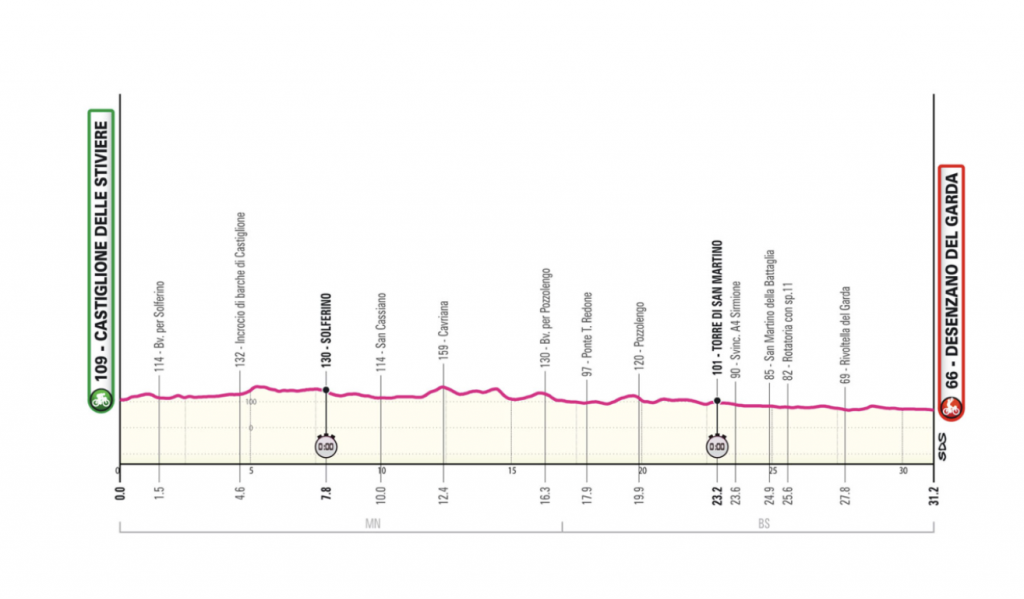
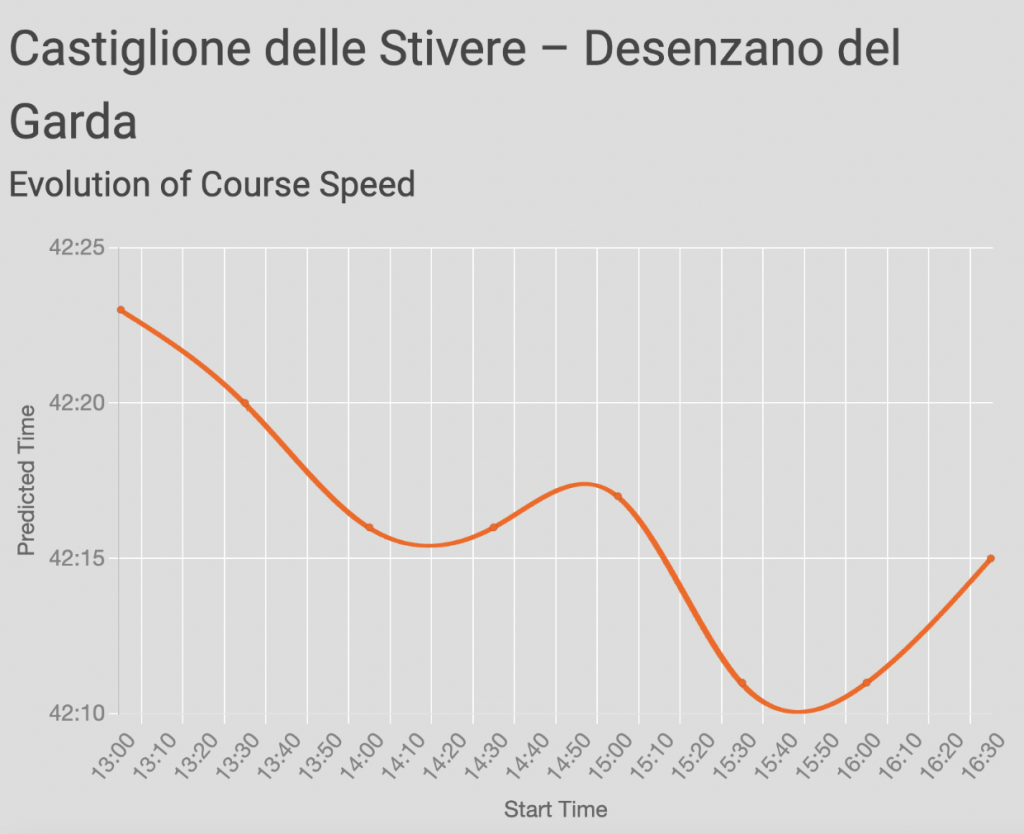
The second individual time trial culminates against the stunning backdrop of the southern tip of Lago di Garda. Spanning 31.2 kilometres, the trial kicks off in Castiglione delle Stiviere, renowned as the birthplace of the International Red Cross. Following this challenging stage, the contenders vying for the top spots will likely require some TLC for their weary legs, making this segment pivotal in determining the overall classification.
The first TT featured a category 4 climb at the end, which you can read about here. In the first individual time trial of the 2024 Giro d’Italia, Tadej Pogačar from UAE Team Emirates delivered an impressive performance. He surged up the category 4 climb at the conclusion of the 40.6km route from Foligno to Perugia, seizing the stage victory.
Filippo Ganna of Ineos Grenadiers, who had held the lead for much of the day, expressed disbelief as Pogačar turned a 44-second gap at the foot of the climb into a 17-second triumph. Adding to Ineos’ success, Magnus Sheffield secured third place on the stage, finishing 49 seconds behind the leader.
How important is pacing?
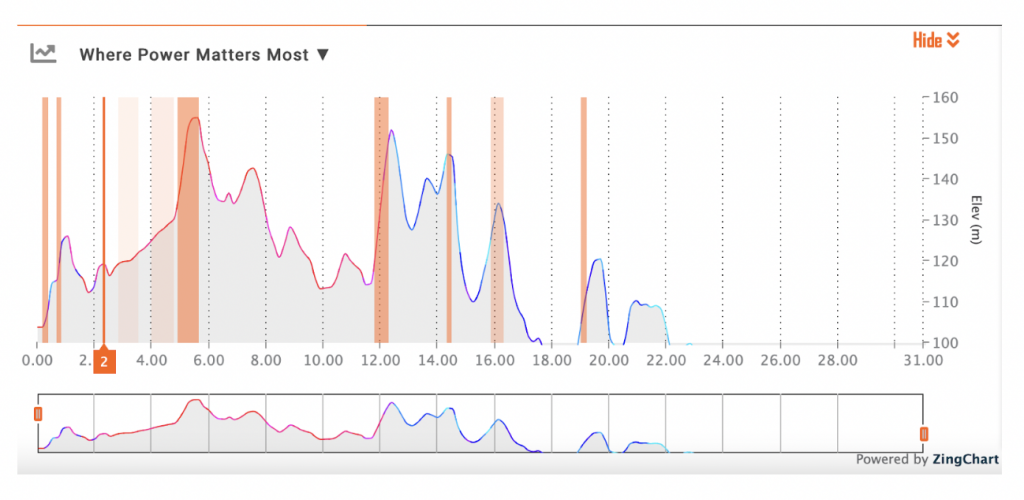
By taking a look at the “Where Power Matters Most” graph we can see that, although the profile is fairly simple, we have a lot of those orange bars and you’ll notice some are quite dark. This means that the effort for this TT will be relatively stochastic and that pacing is important. Smooth pacing vs riding the hills in a punchy fashion, with all other things equal, is about 40s slower so teams will have a pacing strategy.
The flip side of this is the physiological penalty for riding the small climb from kilometre three to kilometre six too hard and losing time in the second half of the race. It’s likely we will see a number of impressive time splits at check one, which sits 7.8km into the course. The second split is 23.2km in – is likely to be relatively final.
How much do conditions change during the day?
We’ve seen, over the last few years, conditions in Giro TTs change quite a bit over the course of the day.
The course profile suits some Ganna flavoured redemption but with his ramp time being 14:35 and the GC guys heading off later – if it’s close then Pogacar could be in with a shout with a slight assistance from the weather. That said, there’s not a huge deal of difference between the fastest and slowest point of the day.
If you want to check out the TT loop for the Giro TT – have a look here.
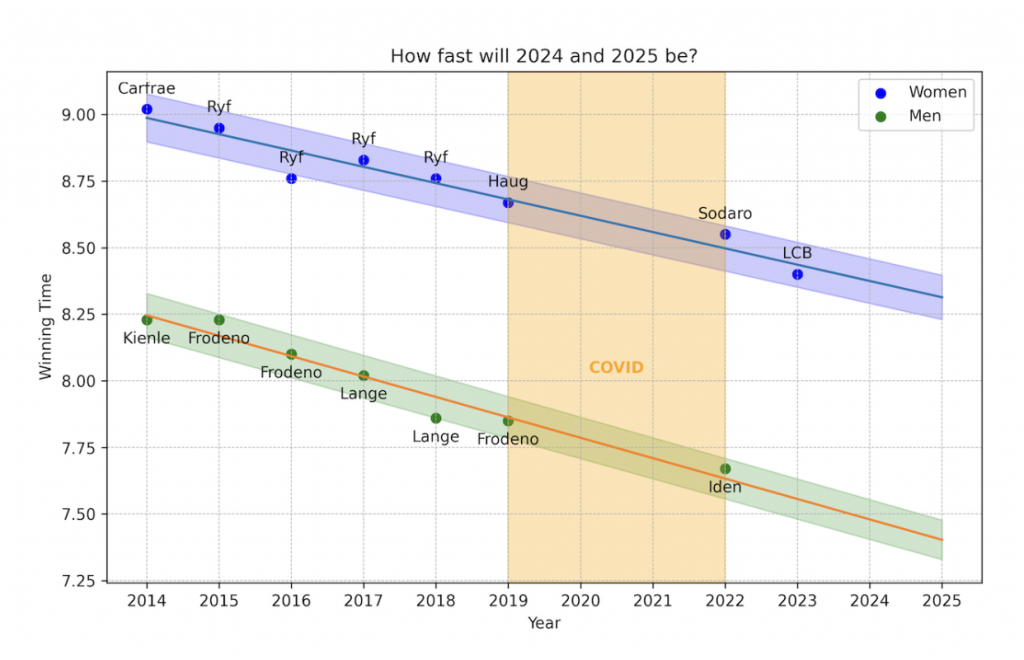
The pandemic was an interesting period for endurance sport – we all had nothing to do other than ride Zwift, do time trials and ride alone. This was the same for the professional triathletes who had no racing for the best part of a year. When we came back from the pandemic, tentatively in 2021 and then more comprehensively in 2022, times started getting faster and, as is often the case with endurance sports, eyebrows got raised.
Given the history of endurance sports, the eyebrow raising was probably justified and a healthy amount of scepticism keeps sport honest (ish). The question was, given the gap in time, was the extra scepticism warranted? For this example, we will use IRONMAN World Championships in Kona for two reasons, firstly, it’s on the same course every year which is obviously not the case for something like Le Tour du France which makes performances more comparable – especially when we can normalise for the weather conditions which we’ll have a go at later. Secondly, I just really like triathlon and often use this blog to look into stuff that interests me and hope myWindsock users also share my esoteric interests.
The first step is just to take a look at the Kona times since 2014 (because that’s as far back as IRONMAN publish race results without me having to look really hard) and just draw a line through them to today (a straight line because it works pretty well) and see if any of the performances jump out at us…
From this, we can do a little more analysing. Firstly, we can discount Lange and Lucy Charles-Barclay’s performances as exceptional – it turns out they were within the expected values for that day. Daniella Ryf’s 2016 Kona performance, however, would appear to be the best performance of the last decade being the only one that sits outside of 1% of what we’d expect.
Going forward, the times will probably continue getting faster. In 2024 the men are in Kona (and the women in Nice due to some post pandemic location shuffling) and it’s likely that, in order to win this race, someone will have to go under 7 hours and 30 minutes for the first time.
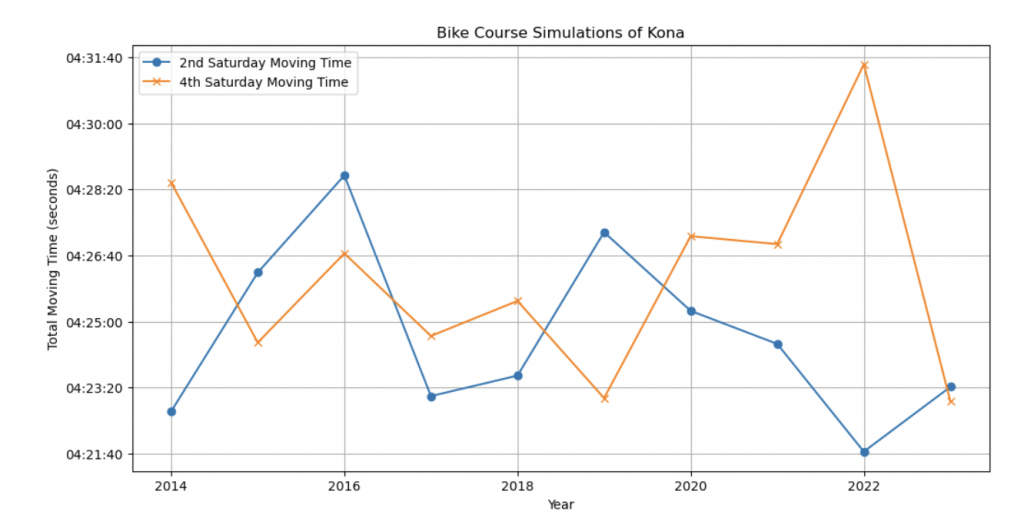
They’ve moved the date of Kona a bit over the years – is that why times are getting faster?
Good question reader. I checked, broadly no but there’s one outlier – the Men’s race this year (2024) is on the 26th of October – as late as it’s been for some time (maybe ever?) and I wonder what difference this might have on the conditions. The 26th of October is the 4th Saturday of the month and traditionally, Kona has been on the second Saturday. Will these two weeks make a big difference?
In general, Kona tends to experience trade winds, which are typically stronger in the summer months (May to September) and weaker in the winter months (October to April). Therefore, October might have lighter winds compared to the preceding summer months, but it can still experience occasional windy days, especially in the afternoon. This means, the famous cross winds on the Queen-K might be a bit gentler this time round as the race is later. Let’s have a look though…
Here we analyse moving time for the same rider conditions each year. Roughly 60% of the time, the 4th Saturday is markedly slower than the 2nd Saturday of each month. There is also a weak trend of October becoming slightly faster in general over the years – this does not fully account for the increase in finish times though. The trade winds which famously blow over the Big Island reduce in their prevalence between October and May so this might also make the Kona course easier toward the end of October.
Broadly speaking, the answer to our question is no. The trend of races getting faster is not much to do with the weather. It’s probably due to materials, decreases in resistance due to aerodynamics, faster tyres and other things.
The upshot
In 2024, to win the Ironman World Championships in Kona (only the men are racing) you’ll have to finish in sub 7:30 according to the trend that appears to be in place. If you add up all the current records for individual disciplines and add very quick transitions we get sub 7:30. The likelihood is we will see a sub 4 hour bike split if the weather plays ball. By 2030, sub 7 might well be on the cards. One day, we will look into what that might take.
Aerodynamics matter when it comes to riding fast, but pacing is often overlooked.
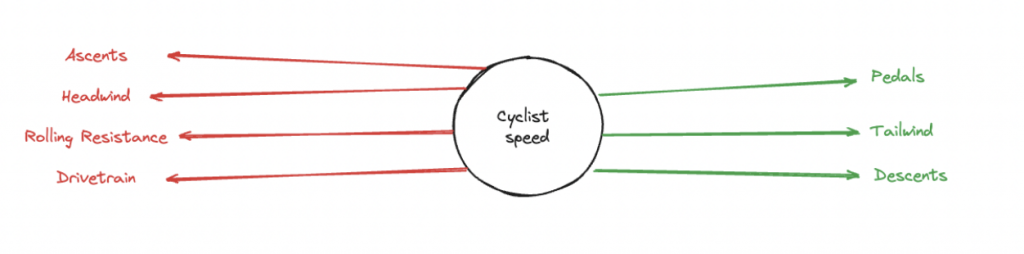
Personally, my favourite graph in myWindsock is “Where Power Matters Most”. This plot essentially tells you where you should ride a bit harder. This is a plot I’ve spoken about quite a lot on this blog before but today we will take a look into why power matters most – rather than where. In order to do this, we need to take a little look into what actually slows a cyclist down when they’re riding.
This is the graph that shows where power matters most. The orange bars show that if you invest energy here, you will get more return on the investment of that energy in terms of speed.
How is it calculated?
Let’s consider the factors that speed a cyclist up and what slows them down. In slowing down we have headwinds, rolling resistance, drivetrain resistance and going up hills. The things that speed our cyclist up include tailwinds, going down hills and the obvious one – pedalling. The intuitive explanation for Where Power Matters Most is simple – when the things slowing you down are on the up, and there’s not much other than your legs contributing to your speed. The old time trial adage of “minimising the amount of time spent going slowly” is key here.
This shows a breakdown of the different forces that will impact a rider’s speed. The sum of all of these forces will tell you whether you’re likely to be speeding up or slowing down at a given instance on the race course.
The simple way to think of this is by looking at this little drawing and if there’s more red than green, power matters more. This is the same as adding up all the forces acting on the cyclist and if there’s more slowing them down than there is speeding them up – power matters more. The greater extent to which this is true, the more power matters! On the graph, a long region of uphill with a headwind will show where power matters.
In an ideal world, we will get up to target speed and keep the green arrows and the red arrows in balance. If, when you’re riding, you imagine the sum of the green (positive) and red (negative) arrows changing and your job, when pacing, is to keep their sum as close to zero as possible by adjusting the power input through the pedals.
The penalty for overadjustment is a blowup of course, go too hard up the first climb and you won’t have enough gas for the second. This is where myWindsock can come in handy, as we can, using the critical power model, calculate your effort for you.
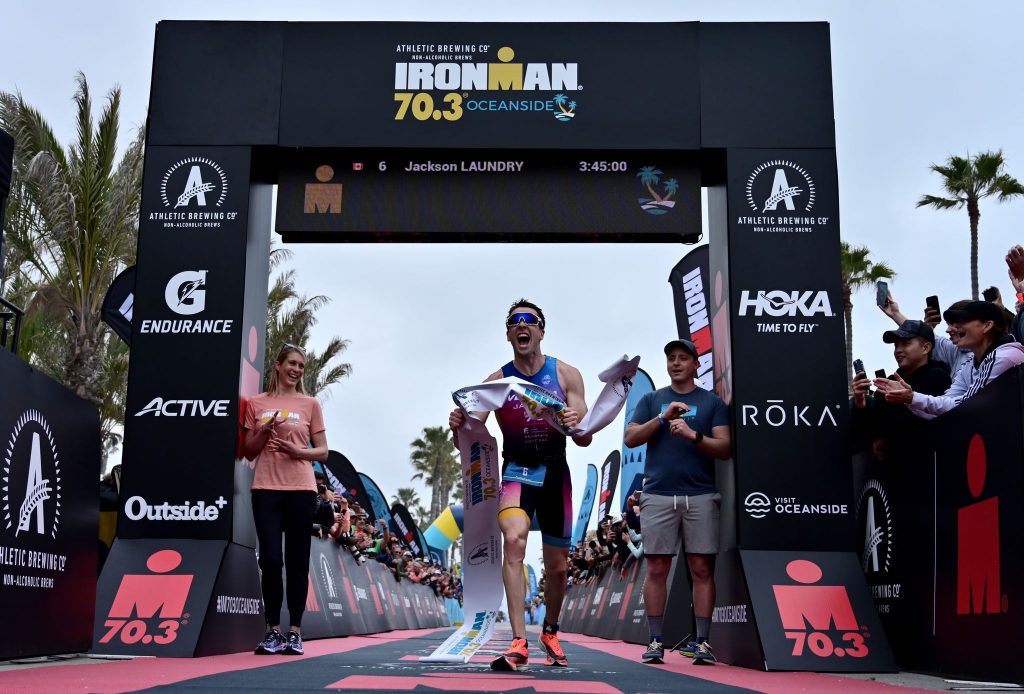
Jackson Laundry is one of my favourite professional triathletes. Everyone in the sport will tell you he’s one of the good guys – they’re not wrong either. He’s been kind enough to share his race file with us from his most recent podium at 70.3 Oceanside and it makes for great reading.
How did the race pan out?
In a field with a great deal of swim talent, most people had their money on an athlete like Marc Dubrick to lead out of the water in Oceanside, but instead it was relatively unknown German pro Magnus Manner who exited the water first. Magnus Manner is a great swimmer and this was not unexpected to anyone who knows anything, that said. Stringing out the front group, Manner led Dubrick, Canadian Olympian Matthew Sharpe and Italian Mattia Ceccarelli out of the water by a couple of seconds, with the next group half a minute down.
In the second pack, there was plenty of firepower for the bike leg ahead, with German Florian Angert and American Dylan Gillespie just ahead of a group of eight which included pre-race favourite Jelle Geens and two-time Kona champion Patrick Lange. Lange will have been pleased with this swim, but probably not much else as he took a wrong turn on the bike and was then anonymous for the remainder of the race. Further back, a number of other contenders were still in the mix, with Braden Currie down +1:05, and Lionel Sanders out in 25th at +1:38. Miami T100 runner-up Sam Long was +2:38 down, with British fan favourite Joe Skipper looking at a deficit of +3:40 out of the water.
Dubrick was first onto the bike. During the initial stretch leading up to Camp Pendleton, Geens took the initiative, swiftly manoeuvring through the field during transition and seizing the lead by the time the front group had covered the first 20km of the bike course. This would prove to be a major tactical error by the Belgian as he was unable to follow Sam Long later on in the bike. Meanwhile, further back, Long and Sanders emerged as contenders, steadily gaining ground on the leaders. Hailing from Tucson, the duo began to assert their presence in the race. By the halfway point, they, along with Jackson Laundry and Currie, had surged to the front of the pack.
Upon closing the distance, Long accelerated the pace, driving alongside Sanders, Laundry, Justin Riele, and Maximillian Sperl to initiate a breakaway with less than 20km remaining. As they entered transition, the leading quintet remained cohesive, leaving the rest of the field far behind. Geens, the closest pursuer in sixth position, trailed by +2:34, while Dubrick and Gillespie lagged a further 90 seconds behind the Belgian.
Unless Geens produced a monster run split, it seemed the men’s winner would come from this front group, with Long, Laundry and Sanders trading blows over the opening kilometres. Dropping Riele, then Sperl, then Laundry, Long and Sanders pulled ahead after 5km, before the Canadian made an early move for the win, opening up a ten second gap, which gradually doubled by the halfway point. Keeping his foot on the gas, Mr “No Limits” looked unstoppable over the middle section of the run course, and with less than five kilometres to go had a lead of over a minute back to Long, who had thirty seconds over Laundry back in third. Pushing like only he knows how, Sanders never relented despite the gap, as his lead continued to grow and grow. Taking the tape in an emotional finish, Sanders put Long and Laundry to the sword with a 1:10:40 run split.
How hard did Sam Long make everyone ride?
The race was won on the bike, with the podium all coming from that lead group. Pre race favourites Sam Long, Lionel Sanders and Jelle Geens all made their impact on the bike. Sam Long attacked, Lionel Sanders held on (before going on to win the race on the run) and Jelle Geens went out the back door. Sam Long attacked the bike very hard, and it was a select lead group of 5 that managed to hold on until the end. Our man Jackson Laundry rode with the front group, showing that on his day, he can ride with anyone in the sport.
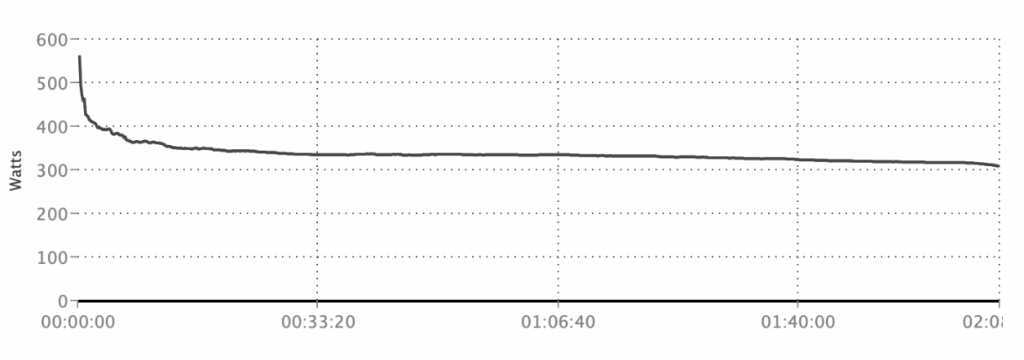
The headline stats.
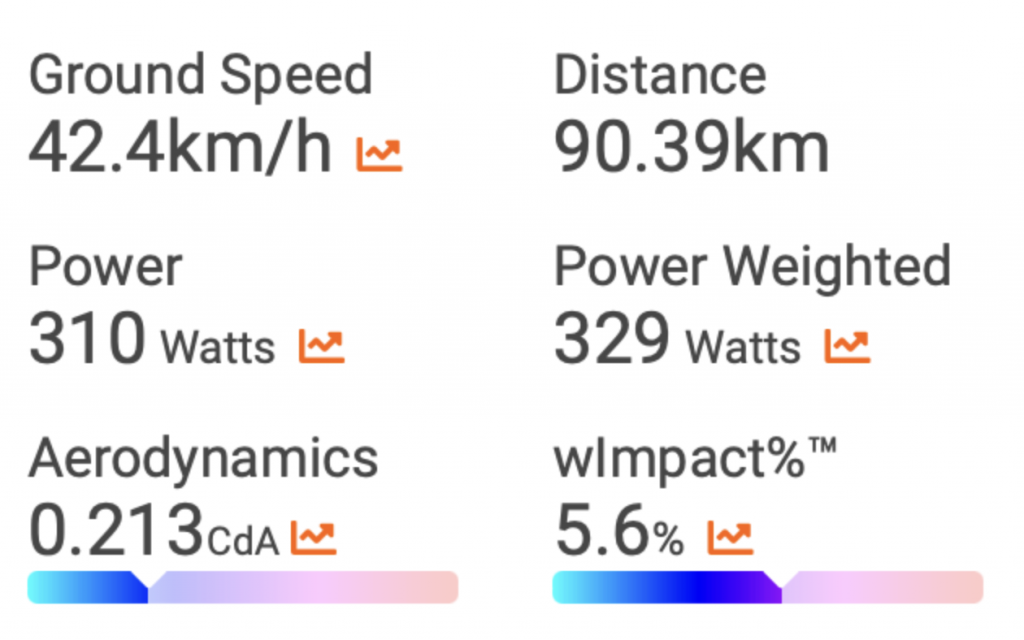
The variation between average power and weighted (think Normalised Power) power is quite high, this shows that the race had a lot of surges in it which tallies with what athletes like Lionel Sanders have said about that front group.
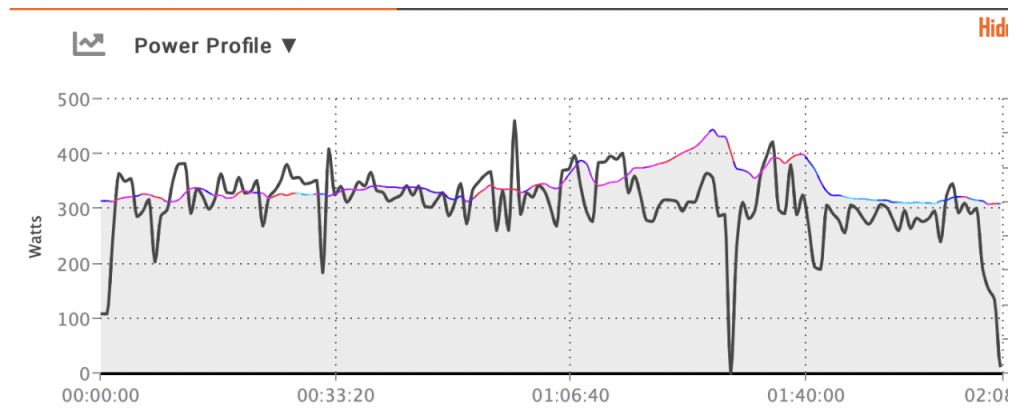
This graph shows Jackson’s power as a function of time. We can see that it’s far from a smooth line. The two climbs on course required extended periods of time around 400W for Jackson. Hard surges are needed in 70.3 races to close gaps and pass riders. That said, our man Jackson is an experienced 70.3 athlete so he kept himself in good position all race.
This is his power duration curve. Though his average power was around 310W, he did have a period of 30 minutes where his average power was 340W and his normalised power was higher than this. The main difference between age group racing and professional racing is this surging – there’s a big difference in physiological requirements between the kind of efforts shown here and a smooth 310W.
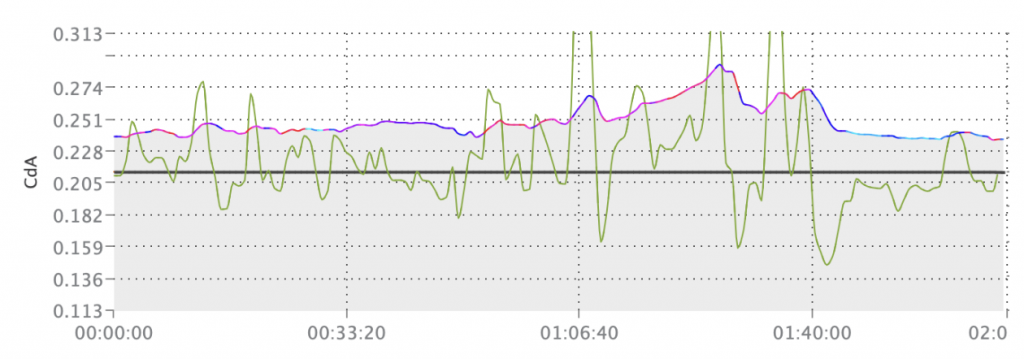
The modelled cda plot is interesting here. It shows us that there is a significant change in the resistive forces that was felt by the rider. The cda shoots up on steep portions of the climbs where riders get out of their aero bars as speeds reduce.
I had a brief exchange of messages with Jackson after the race and he put his bike success onto spending all winter on the turbo (he lives in Guelph, where temperatures in winter drop below minus ten Celsius). He told me that Sam was pulling very hard for most of the ride. Post race, Sam mentioned that he was worried about Jelle Geens on the run.
Interestingly, the fastest run of the day was done by Connor Weaver, down in 38th position who pulled a 1:10:01 out the bag.
Stay tuned for more ride analysis from pro races. If you want to be as well prepared as these athletes, sign up to myWindsock here.
Former winner, Jackson Laundry, will be hoping to repeat what he’s done in the past and take the win in this stacked field.
This weekend, Ironman Oceanside 70.3 is set to kick off the Ironman pro series for 2024. The start list is completely stacked.
70.3 Oceanside holds the distinction of being the longest-standing event on the current 70.3 calendar, tracing its origins back to 2002. Over time, it has cemented its reputation as the primary “season opener” for North American triathletes, both amateurs and professionals alike.
The anticipation surrounding the new series has drawn considerable interest from professional athletes. Consequently, Oceanside boasts an impressive start list comprising 117 registered pros – 80 men and 37 women. If all goes as expected, this event could potentially surpass previous records, including the 97 overall starters at 70.3 St. George in 2021, 65 male starters at the 2009 70.3 Worlds, and 46 female starters at the 2022 70.3 Worlds. It promises to be an enthralling spectacle.
We won’t do an in-depth preview of the runners and riders – you can check one out here but we will look in depth at the bike course in Oceanside, which is much less boring than most North American 70.3 races.
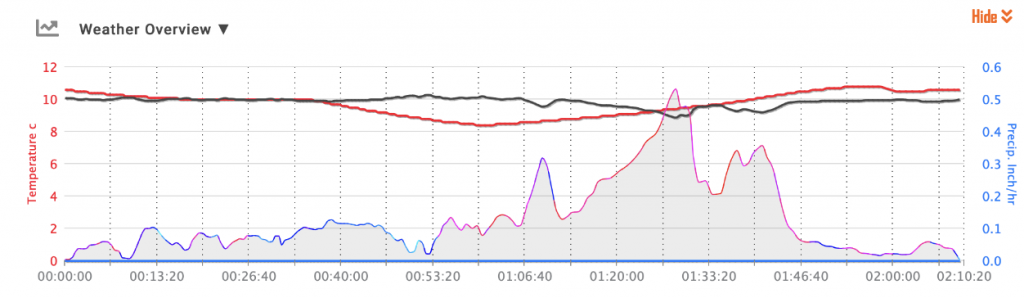
The temperature
Oceanside 70.3 is always a cold race, but the lows predicted on course drop to around 8.8 degrees celsius on the bike! The main consequence of this is speed related – cold air is more dense! Luckily, it’s looking extremely unlikely that it’ll rain.
The elevation
You can see that the course is rolling most clearly with the “Where Power Matters Most” plot. The orange boxes show us where an investment in energy delivers the most return. The Oceanside course is littered with these showing a clear distinction between the most efficient transfer of power and riding a flat time trial effort.
The wind
With a 12m draft distance, the wind coming entirely from the side will aid splitting up groups. It’s also interesting to note that the wind is blowing off the short onto the sea – which you might not expect. That said, wind speeds are low so we won’t spend too much time worrying about this.
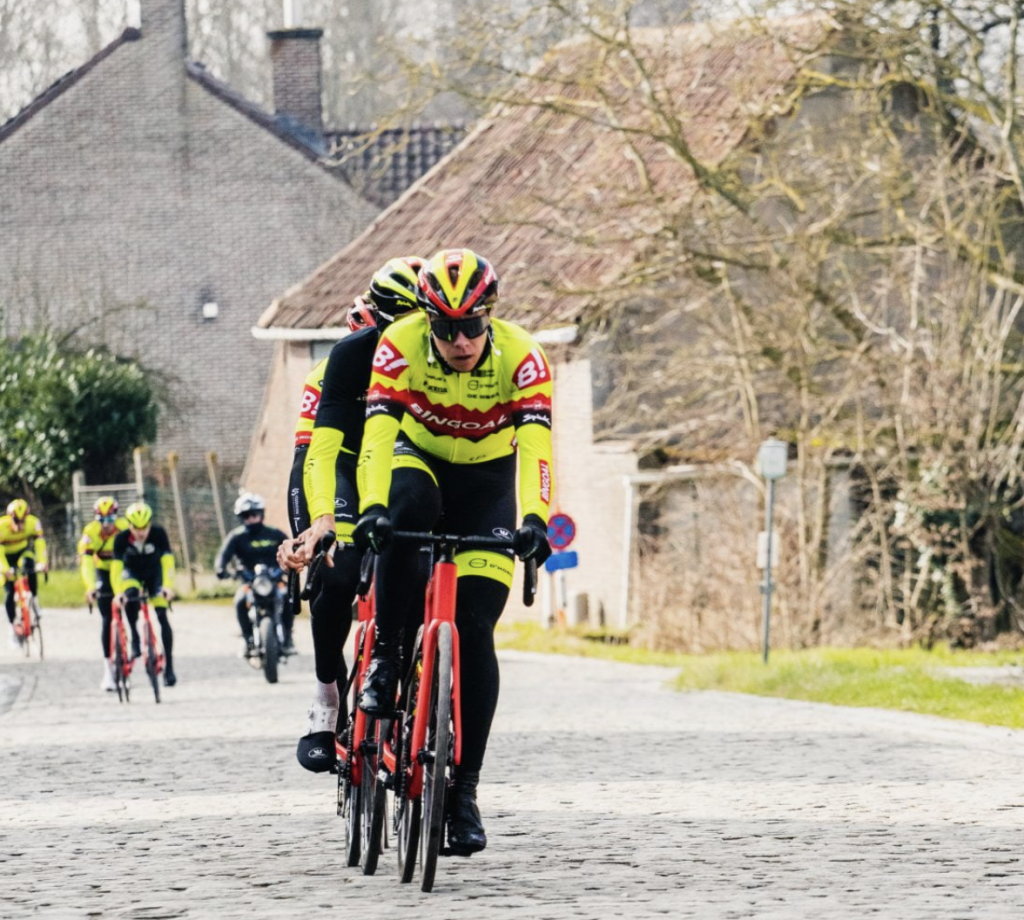
Our supported team, Bingoal, will be taking on the cobbles of Flanders.
The Tour of Flanders, affectionately known as “De Ronde van Vlaanderen” in its native Belgium, stands as one of the crown jewels of professional cycling’s spring classics. Steeped in history and tradition, this iconic race traces its roots back to the early 20th century. First held in 1913, the Tour of Flanders has evolved from a modest local event into a monument that captures the imagination of cycling fans worldwide.
The race is characterised by crosswinds which has led to splits in the peloton before the “hard” parts of the race even start (it’s probably all pretty hard).
Let’s check the route
The Tour of Flanders route for 2024 has undergone significant revisions, with race organisers opting to return the start location to Antwerp after a recent alternation with Bruges. Focusing on safety, Flanders Classics has redesigned the route to incorporate more major roads leading to the finishing circuits around Oudenaarde and a revamped approach to the challenging Koppenberg climb.
Scheduled for this weekend, March 31, 2024, the elite men’s race will commence with a team presentation at the iconic Grote Markt in Antwerp, followed by a neutralised passage through the city covering 5 kilometres before the official start of racing. Tomas Van Den Spiegel, CEO of Flanders Classics, highlighted the anticipated spectacle along the route, particularly through notable landmarks such as the Oudaen and the bustling Meir shopping district in Antwerp, promising captivating imagery for viewers and fans alike.
This new route at the start has lead some commentators to write the race will be easier for the first 100k in the past, let’s check the forecast and some myWindsock graphics to see if that’s true.
How does the forecast look?
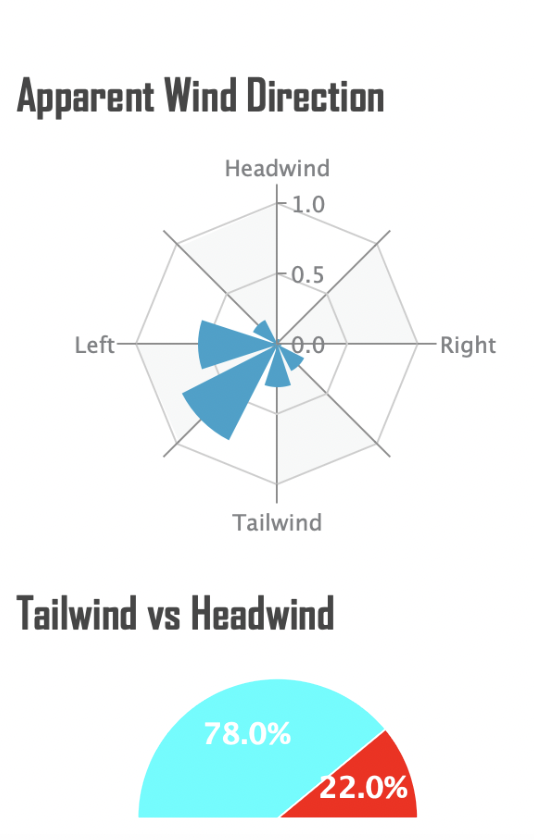
In terms of “unexpected action”, we know it’s going to kick off when they get to the circuit, but is there any chance of the wind blowing on the roads from Antwerpen to Oudenaarde? Broadly speaking, if we are going to see action early, the wind will need to cooperate which will mean we want it forecasted to be blowing fairly hard across this route.
Plugging it into myWindsock, we see that this is one you’ll want to watch from the flag drop. It’s likely to be cross tail!
This, combined with the fact that the wind is blowing across the circuit, tells me that when Rouleur wrote that the first 100k would be easy, they didn’t check the wind.
“Plugging it into myWindsock, we see that this is one you’ll want to watch from the flag drop. It’s likely to be cross tail!”
This wind speed of around 16 to 37kph is enough to split the bunch at points if it’s blowing in the right direction – which it appears to be.
Why is a cross-tailwind harder?
One slightly odd thing about classics season is that cross tailwinds are harder than block crosswinds and there’s a mathematical explanation as to why that is and it’s all to do with resolving forces and the fact that, hopefully, cyclists are moving continuously forwards.
When a force acts on a body, using a bit of trigonometry, we can resolve these forces (that is to say, break them down along component directions) it along whatever axis we like – which for our purpose we will chose a line along the motion of the rider and one that’s perpendicular to his direction of motion.
Resolving all of these forces essentially tells us that a rider on the wheel is going just as hard as the guy on the front, and the faster they go, the less shelter they get and it all gets continuously harder. With a block crosswind, this resolves to more headwind meaning a rider in the wheels gets more shelter (and as you go faster, more shelter is received). Cross tail on the other hand resolves to cross wind.
How to watch?
Live terrestrial coverage of the race will be available in numerous European countries. Italian national broadcaster RAI will offer live and on-demand coverage, while RTBF and VRT will broadcast the race in its entirety in Belgium. Additionally, ESPN will provide coverage of the event in many territories outside of Europe. For viewers with a VPN, accessing live coverage may be possible by registering and logging in to the broadcaster’s website. Furthermore, Discovery Plus subscribers will also have the option to log in and watch the race live through their platform. The men’s race will be available to watch from 9am UK time, the women’s race is on from 2pm.