The 2023 Tour de France stage 16 time trial has proven somewhat of a talking point. We have tried to make sense of the numbers, as at first, they seemed interesting. Essentially, we (Tom) vastly underestimated how fast Jonas would go in this TT but, with a couple of fresh assumptions, we can come up with some good (but not alien-like) numbers for the TT performance that the small Dane managed.
Where was the time gained?
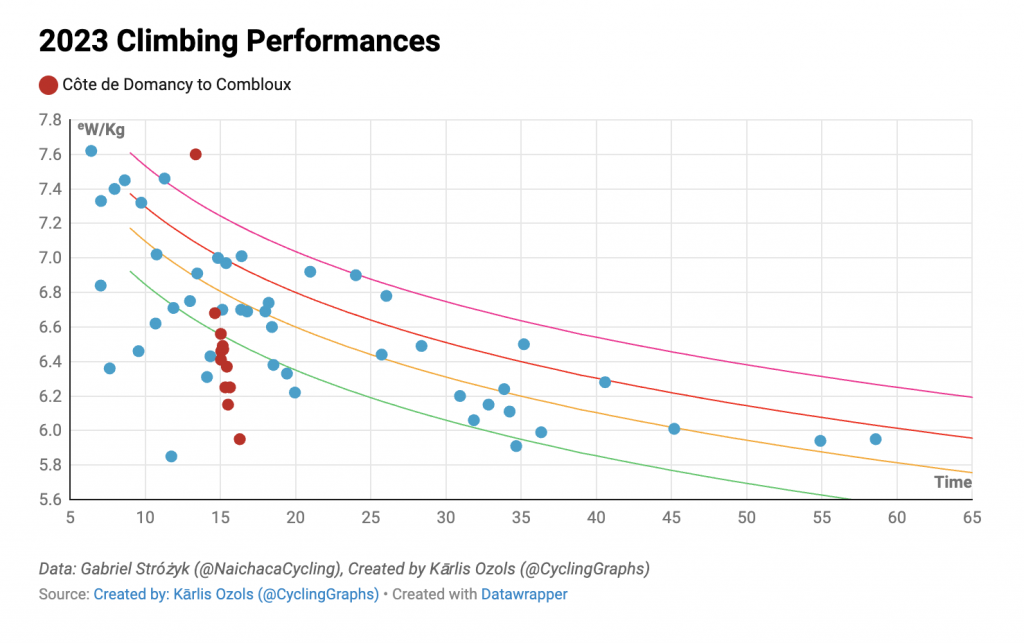
During the short time trial, Vingegaard managed to gain 1 minute and 38 seconds over the Slovenian Pogacar. The TT finished with an ascent of the Côte de Domancy (6.05 km, 6.84%) after a rolling course in the earlier part. Notably, Jonas Vingegaard delivered a truly historic performance, outshining even Pogačar on the 22.4 km route by an impressive 1 minute and 38 seconds, while leaving all other competitors behind by a margin of at least 2 minutes and 51 seconds. Our, and others who have also done this, calculations reveal that Vingegaard achieved a remarkable 7.60 W/Kg for a time of 13 minutes and 21 seconds. This would undoubtedly rank among the greatest performances of all time.
Pogacar lost 77s over the course of the climb, which does include a bike change.
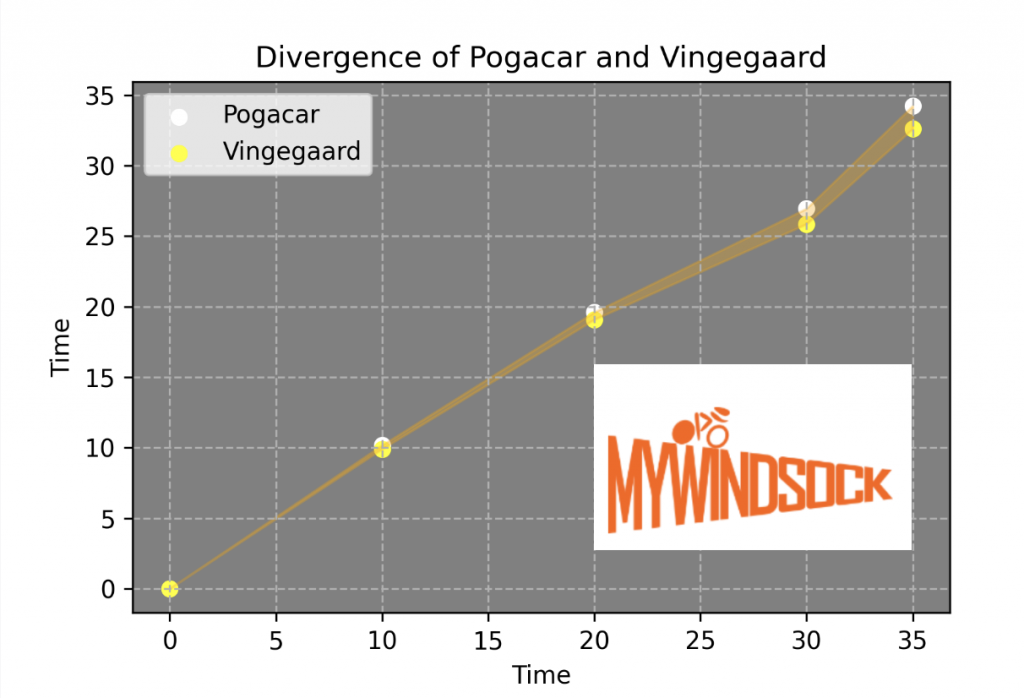
The climb – Côte de Domancy
A myWindsock model of the performance
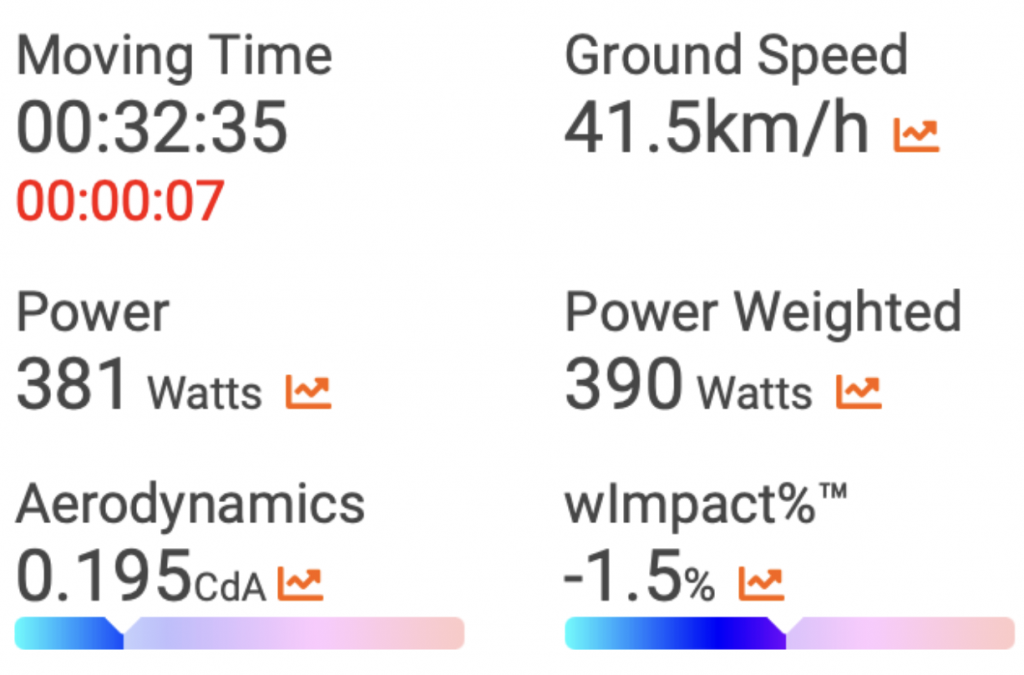
It was clear that Jonas’ strategy was a simple one, rail descents, ride the flat sections at a reasonable tempo and absolutely whack the last climb as hard as possible.

The conditions

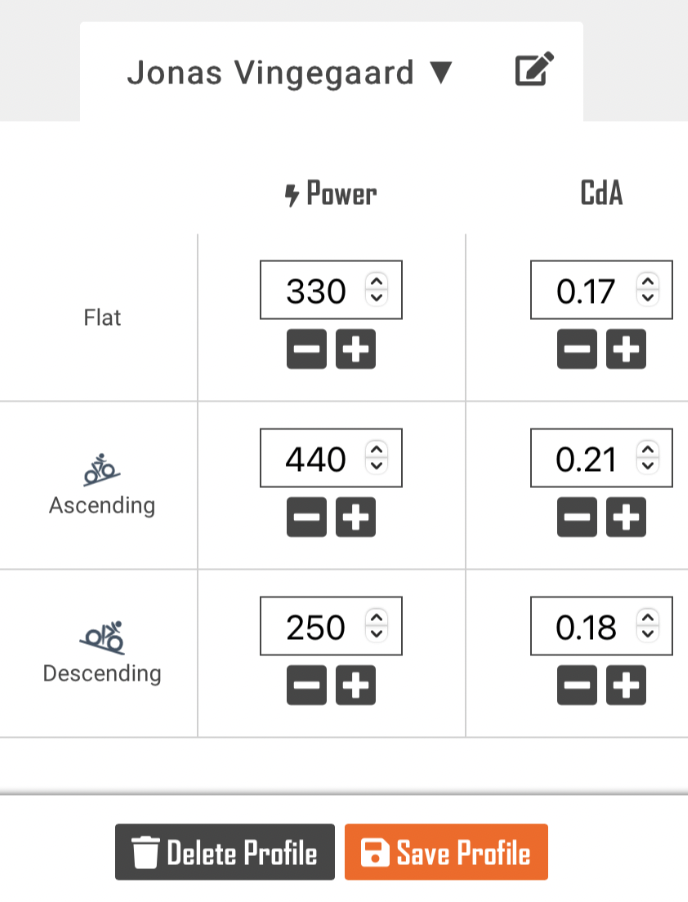
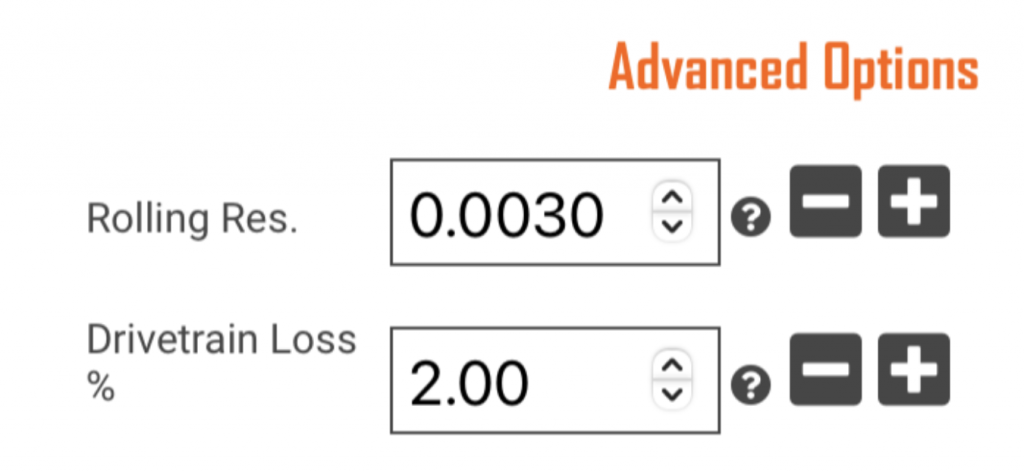
The settings we used for Jonas
We asked Ineos Grenadiers’ Dan Bigham about some realistic numbers for CRR and drivetrain resistance and, with a few caveats used the settings below as a rough estimate. In reality, especially with a course such as this one where speeds, gearing and cadence change so drastically these values vary with time but for our purpose today average values over the course of the TT will suffice.
This was an extremely good ride from Vingegaard and he must have had to produce close to his peak average power for that duration in the time trial position. Something that is possible with incredible dedication to time trialing – something we know he has worked on extremely hard. From our analysis, it seems Vingegaard had a perfect day, on a perfect bike with perfect conditions and produced an other-worldly performance on that final climb. Given how aerodynamic it’s possible for a rider of that size to be and how well he descended, it’s possible he came into the base of the final climb relatively fresh. It would be interesting if Jumbo would publish his power files, as seeing how he paced this would certainly help us when predicting future performances.
If you’d like to bring a new level of analysis to your time trial performances, check out myWindsock here.


 UK Time Trial Events
