


We have been working on the desktop user interface. We noticed, the most frequently selected chart item was ‘Summary Data’. Switching between the activity or interval Summary, whilst experimenting or learning about your activity, isn’t very efficient.
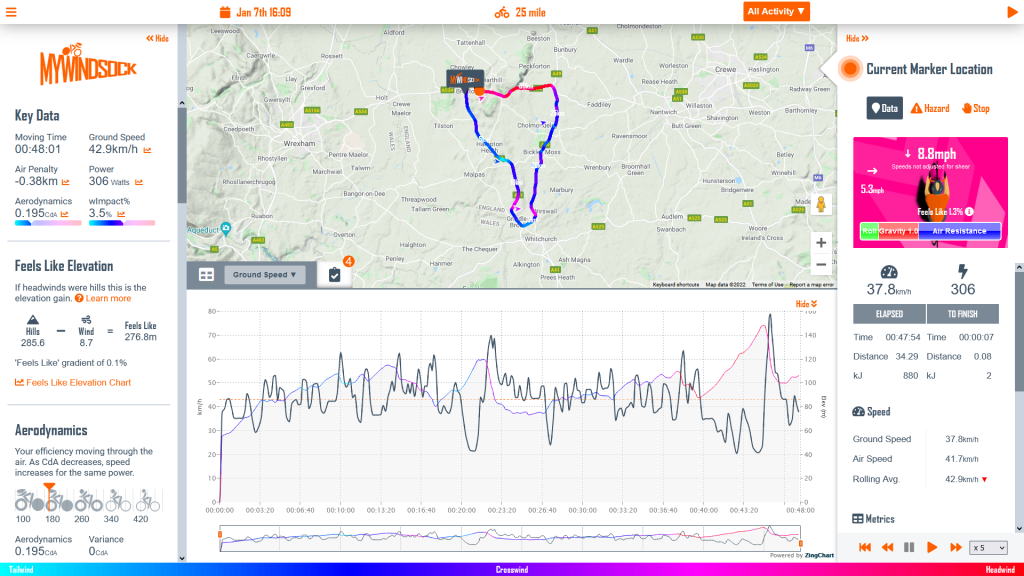
You may not always want the Summary in view, or even charts and Current Marker Location. So we have added the functionality to hide each of these as required. Simply click on the “Hide” button on the required panel.