


Time trials are a strange kind of race. Figuring out whether or not you’ve done well isn’t as simple as it is in a criterium, road race or cyclocross race where you can simply see how you’ve done against the rest of the field. Time trials aren’t that simple, where conditions on the day and equipment can make for wildly unfair comparisons between the rest of the field. Sure, you can look at power data but as we know – watts aren’t everything and aero is. Without a device measuring how aerodynamic you are, how can you tell how you performed?
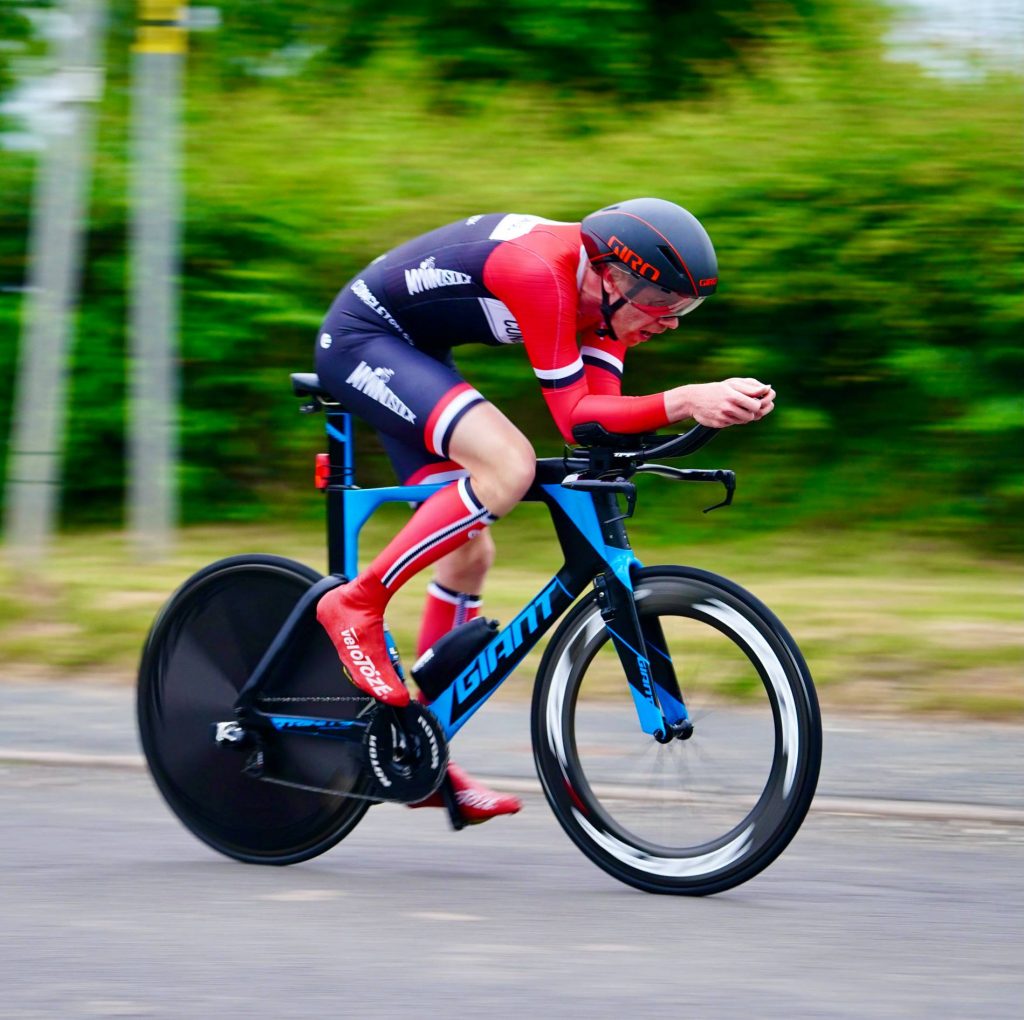
Recently, I took part in a road bike time trial and found myself kind of underwhelmed with my performance. On paper it was fine, I averaged 40 kph on a relatively grippy course but my power was low and I felt rubbish with a high heart rate. The race was on Saturday and on Monday I woke up ill – which explains some of it but how can we look at performance?
The aims of a time trial
Time trials are a quest for efficiency. You’ve got two factors, the efficiency of your body in producing power at the legs (biochemical efficiency) and then your mechanical efficiency which dictates how much of your leg power is converted to speed. The beauty of time trials is that we are really only racing ourselves and an improvement could mean that the answer is yes to any of the following questions…
- Did I produce more power?
- Was I able to push myself harder than before?
- Was I more efficient? (More power for a lower heart rate, more speed for the same power etc…)
The thing is, working these out does require a little bit of post race analysis. For this, I use Training Peaks and myWindsock, this blog will show you how…
Did I produce more power?
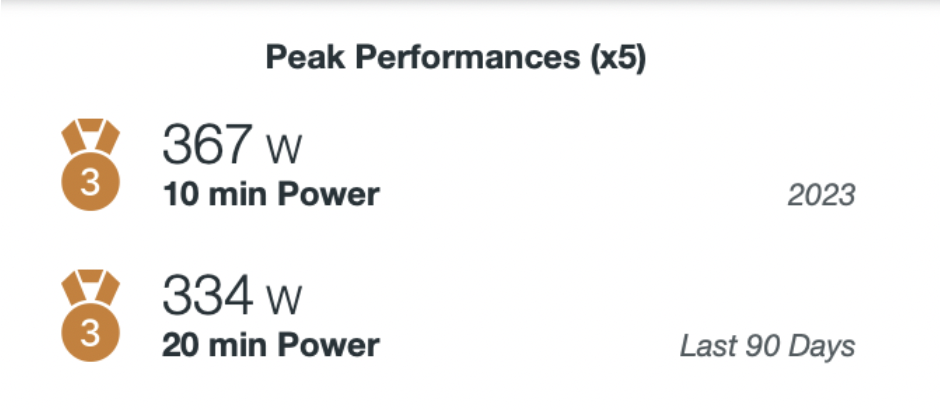
Shortly put, not really. I did my third best power of 2023 but I hadn’t really done a maximal ten minute effort and, as you can see, my power from ten to twenty minutes declined horribly. The strange thing was that I am quite fit but didn’t even get close to my previous best efforts. I woke up quite ill on the following Monday which explains this.
Was I able to push myself harder than before?
At the time, I felt like I was going full gas. Burning lungs, legs and the copper taste in my mouth. It turns out I should have been a little more suspicious of the post race cough which basically continues to this day!
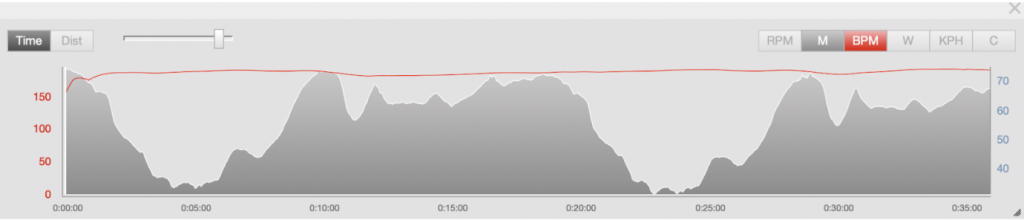
My heart rate was pretty high and quite stable during the race, usually I’d expect it to come down on descents and it wasn’t doing this. I did push myself hard, but I suspect this was achieved as a result of illness more than anything else.
Was I more efficient?
Hopefully, this part will allow me to salvage some kind of positive from the time trial. We can use myWindsock’s Strava report to have a look at this! My average cda for this, according to myWindsock, was 0.308! This is shockingly high for me. Usually, in a road bike time trial myWindsock has me around 0.25±0.02.
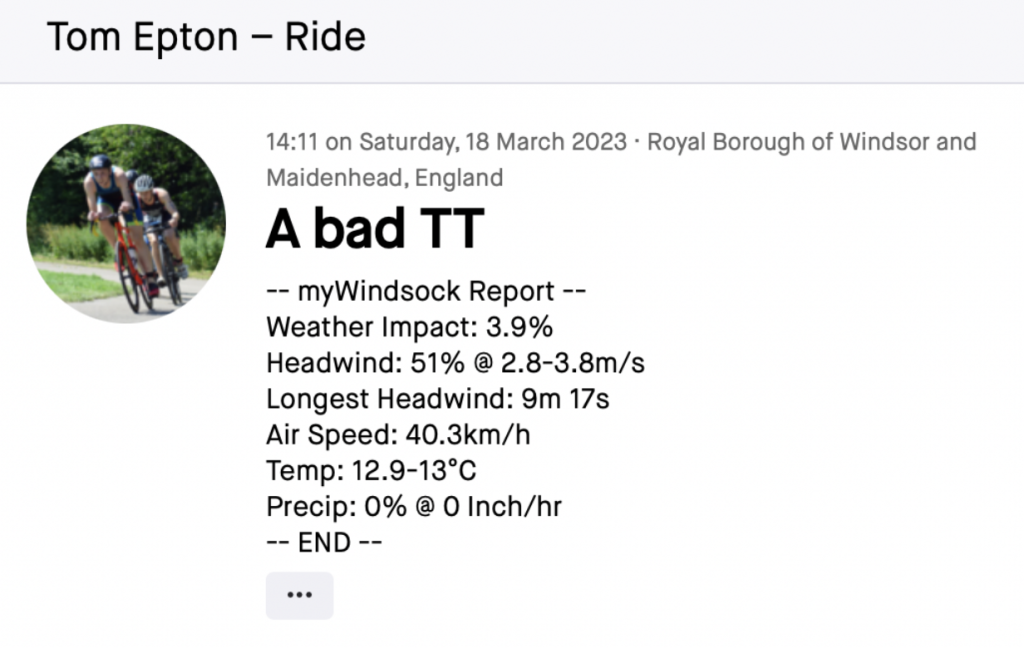
We can also see a low weather impact of 3.9% and ideal temperatures with no rain. The road surface was not perfect but I’m not sure that explains the woeful performance from me.
When is a bad day simply a bad day?
The neat thing about myWindsock is that, for me here, it was the final piece in the puzzle to solidify the fact that I was just rubbish. Sometimes, that happens. My power was low, my heart rate was high, I wasn’t very aero yet it was a relatively fast day. A weather impact of less than 5% is minimal and definitely not enough to be an excuse.
If you want to analyse your performances in the context of the conditions – check out myWindsock here.