


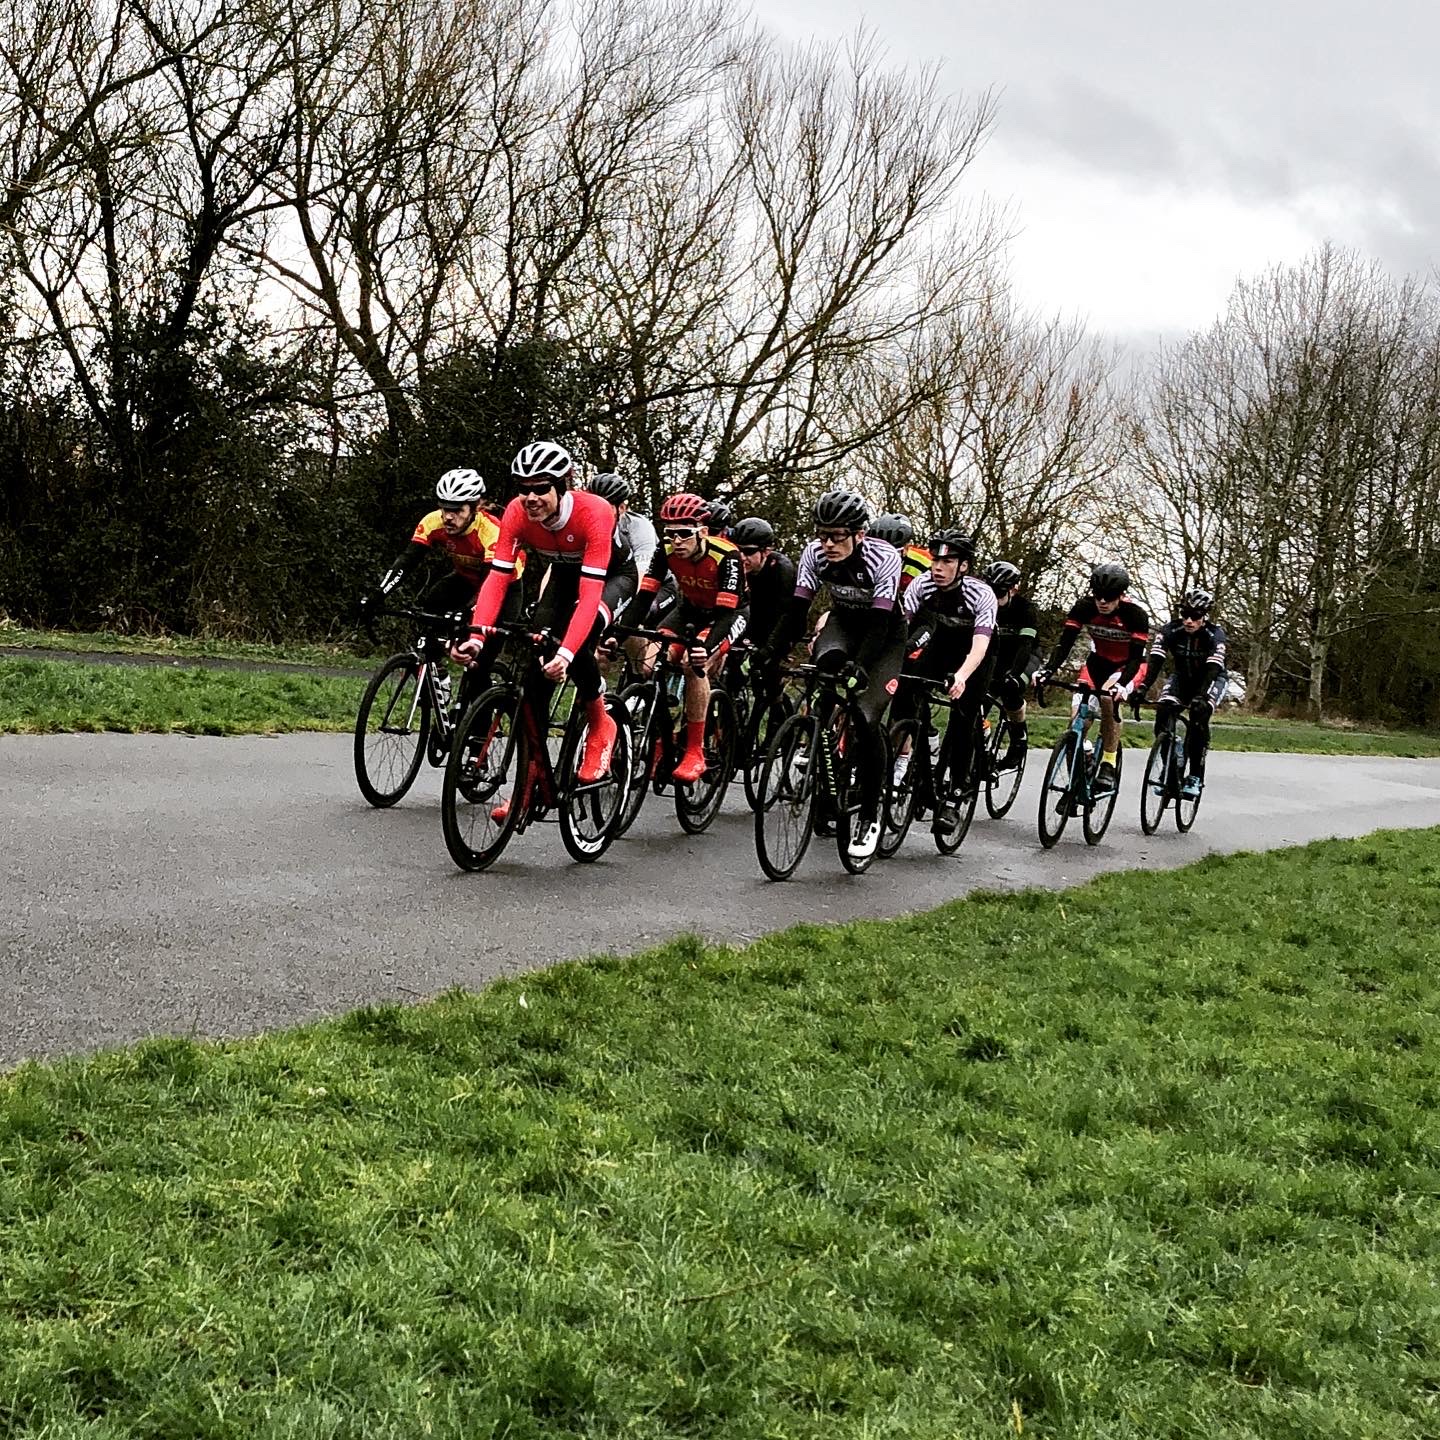
I took part in my first bunch race last Saturday. It has been a great opportunity for me to understand the applications of myWindsock.com for planning and analysing mass start races.
One especially cool thing from racing on a circuit is that I am collecting loads of aero data. Each time I cross the same point on the circuit myWindsock.com caclulates my CdA (Aero Efficiency). So this is what I thought I’d show you here. Then you can do the same analysis for your own races. How well do you shelter in the bunch? Find out by analysing your race on myWindsock like this.
My Race’s Aero Analysis
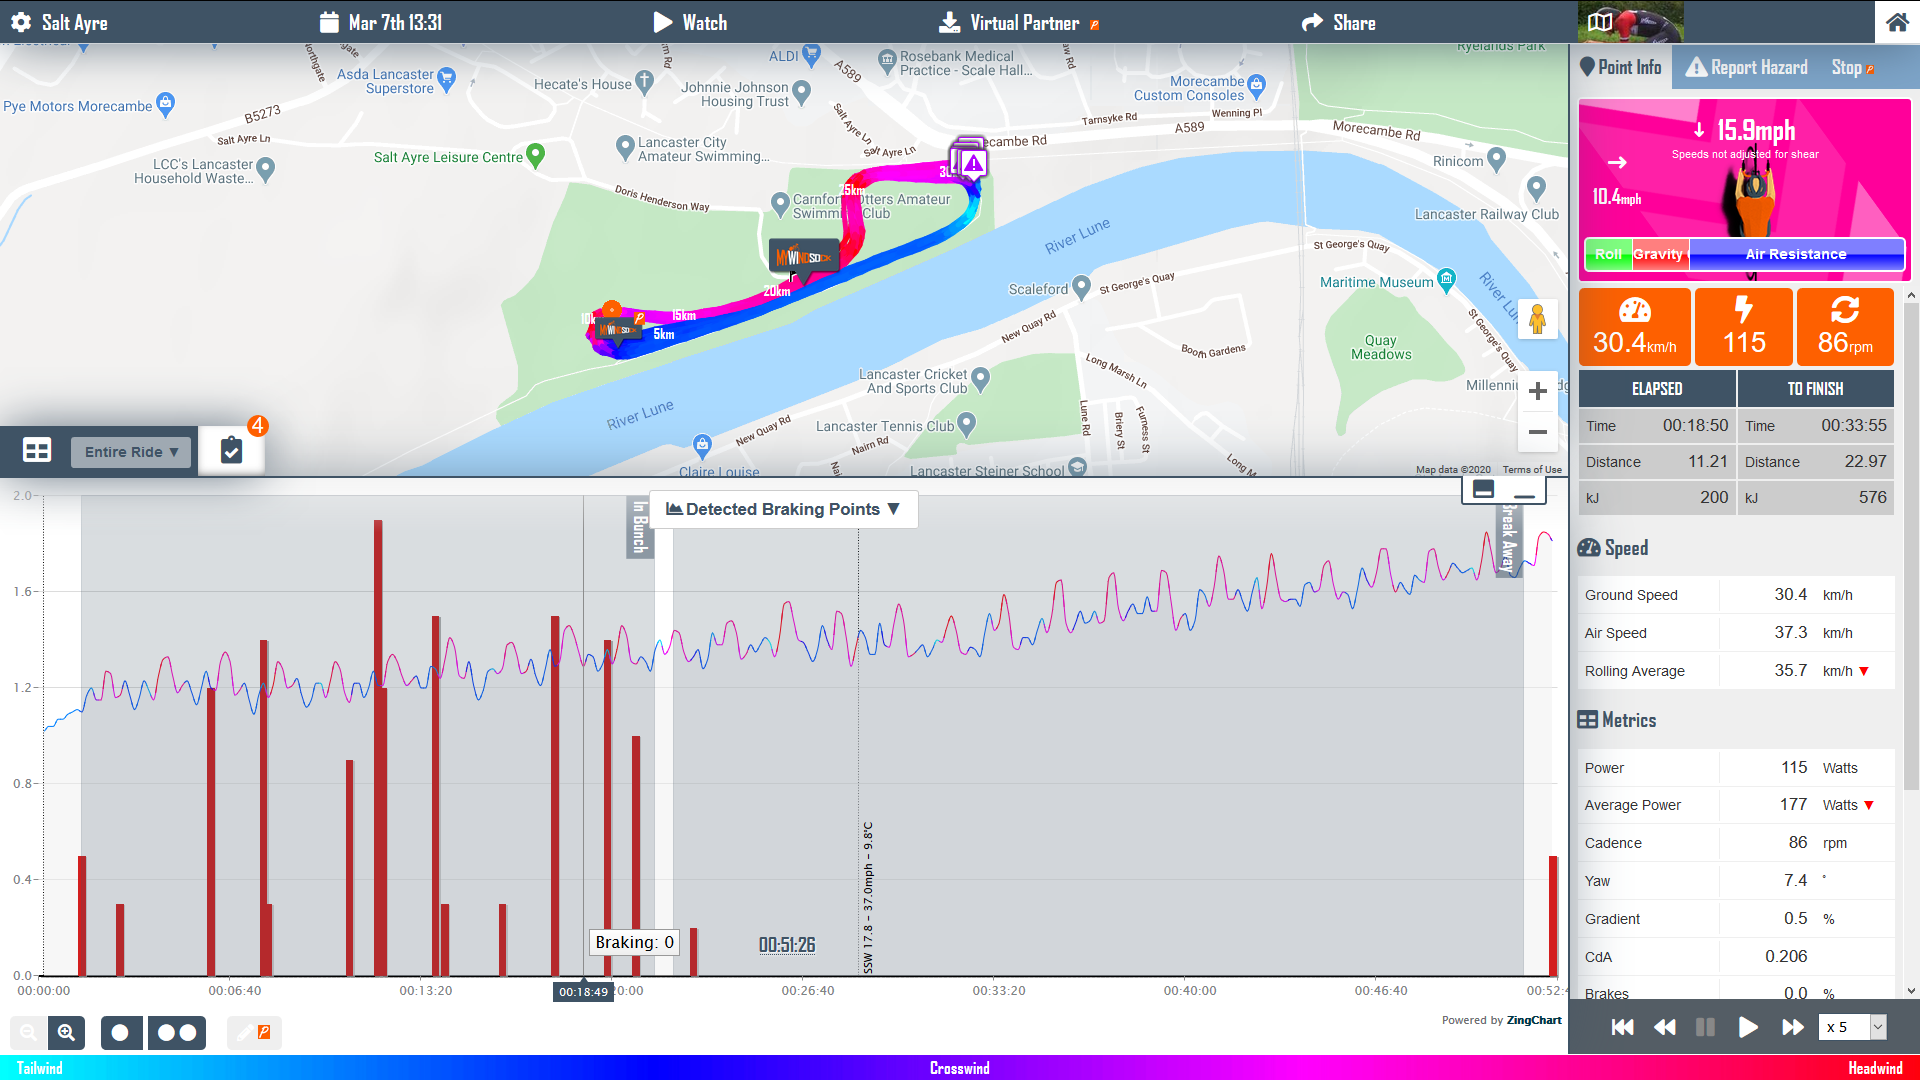
Have a look at my CdA profile for the race…
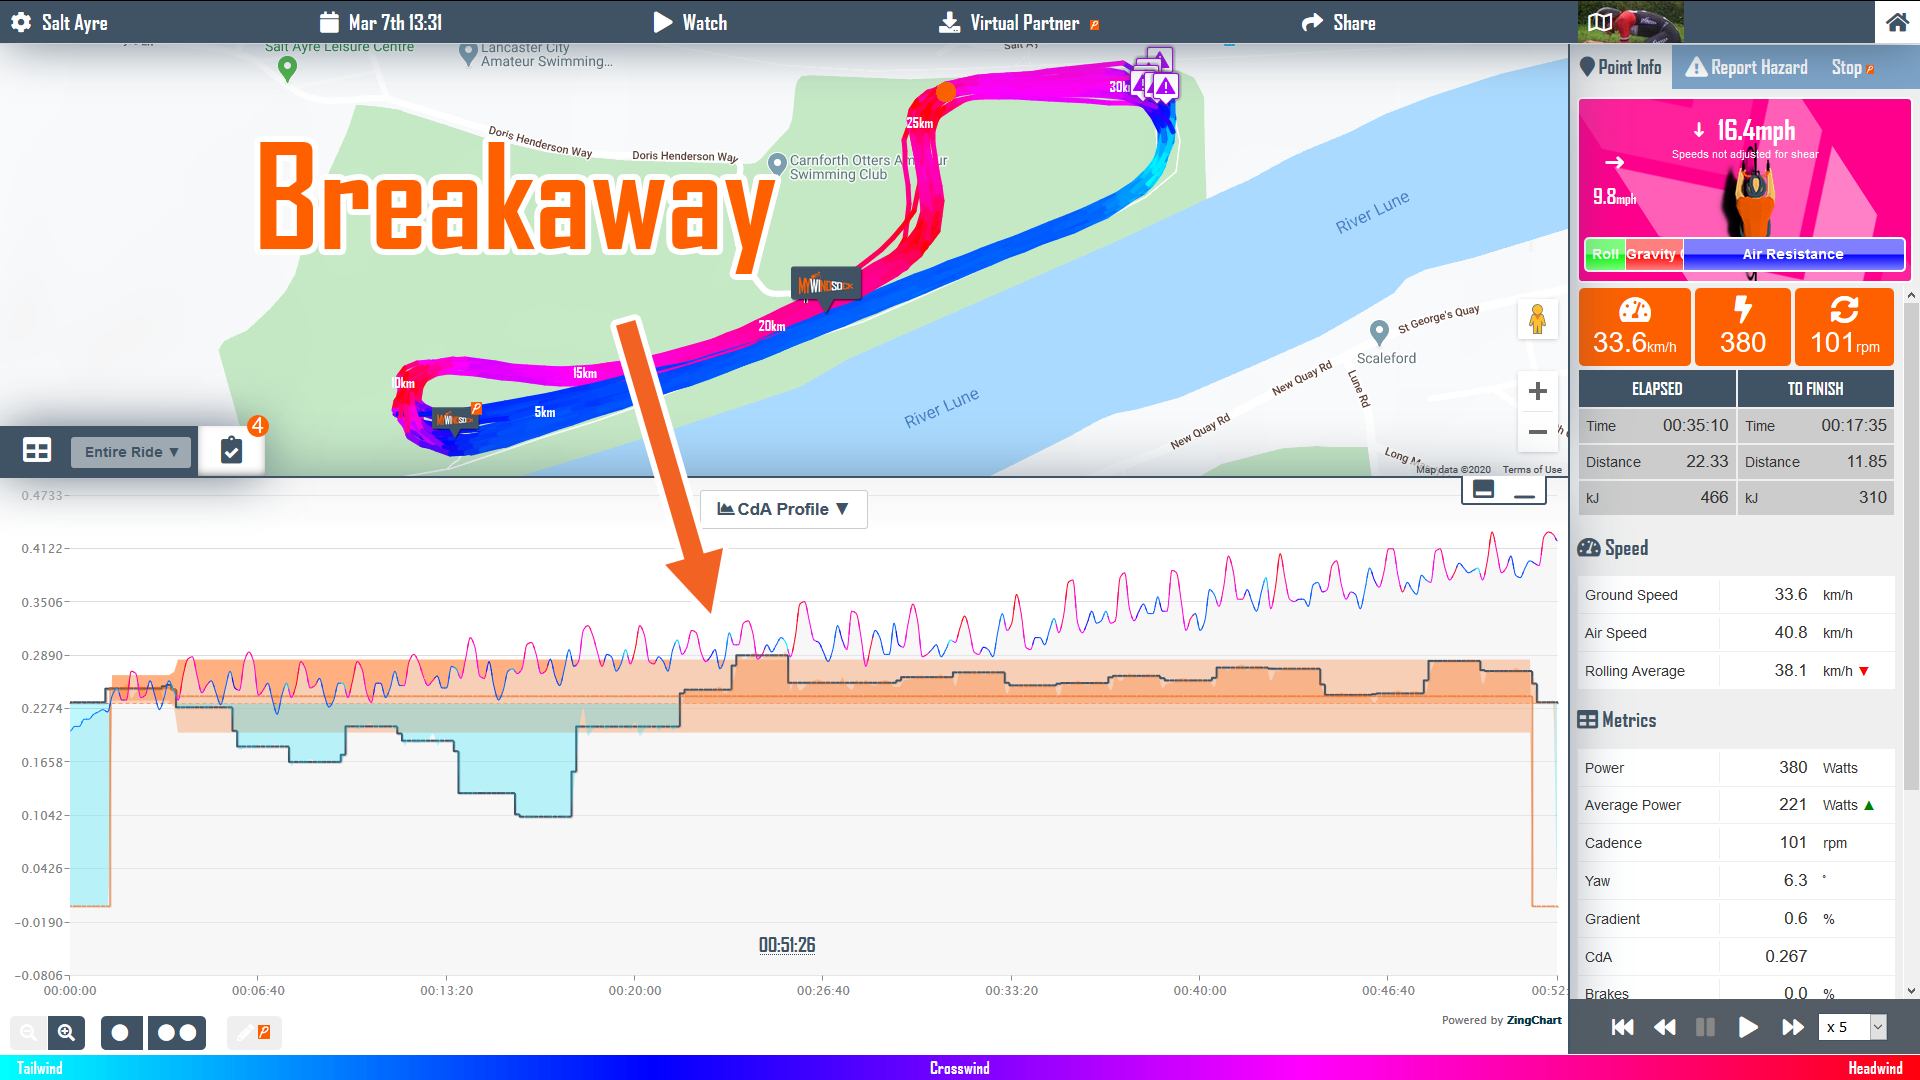
You can see the Blue section is where I was in the bunch. Hey look! good for me with practice I became more efficient using the bunch for shelter from the wind. I can see this because the Stepped line representing each lap’s CdA gets lower and lower. The blue represents me being more aero than my average CdA for the whole activity.
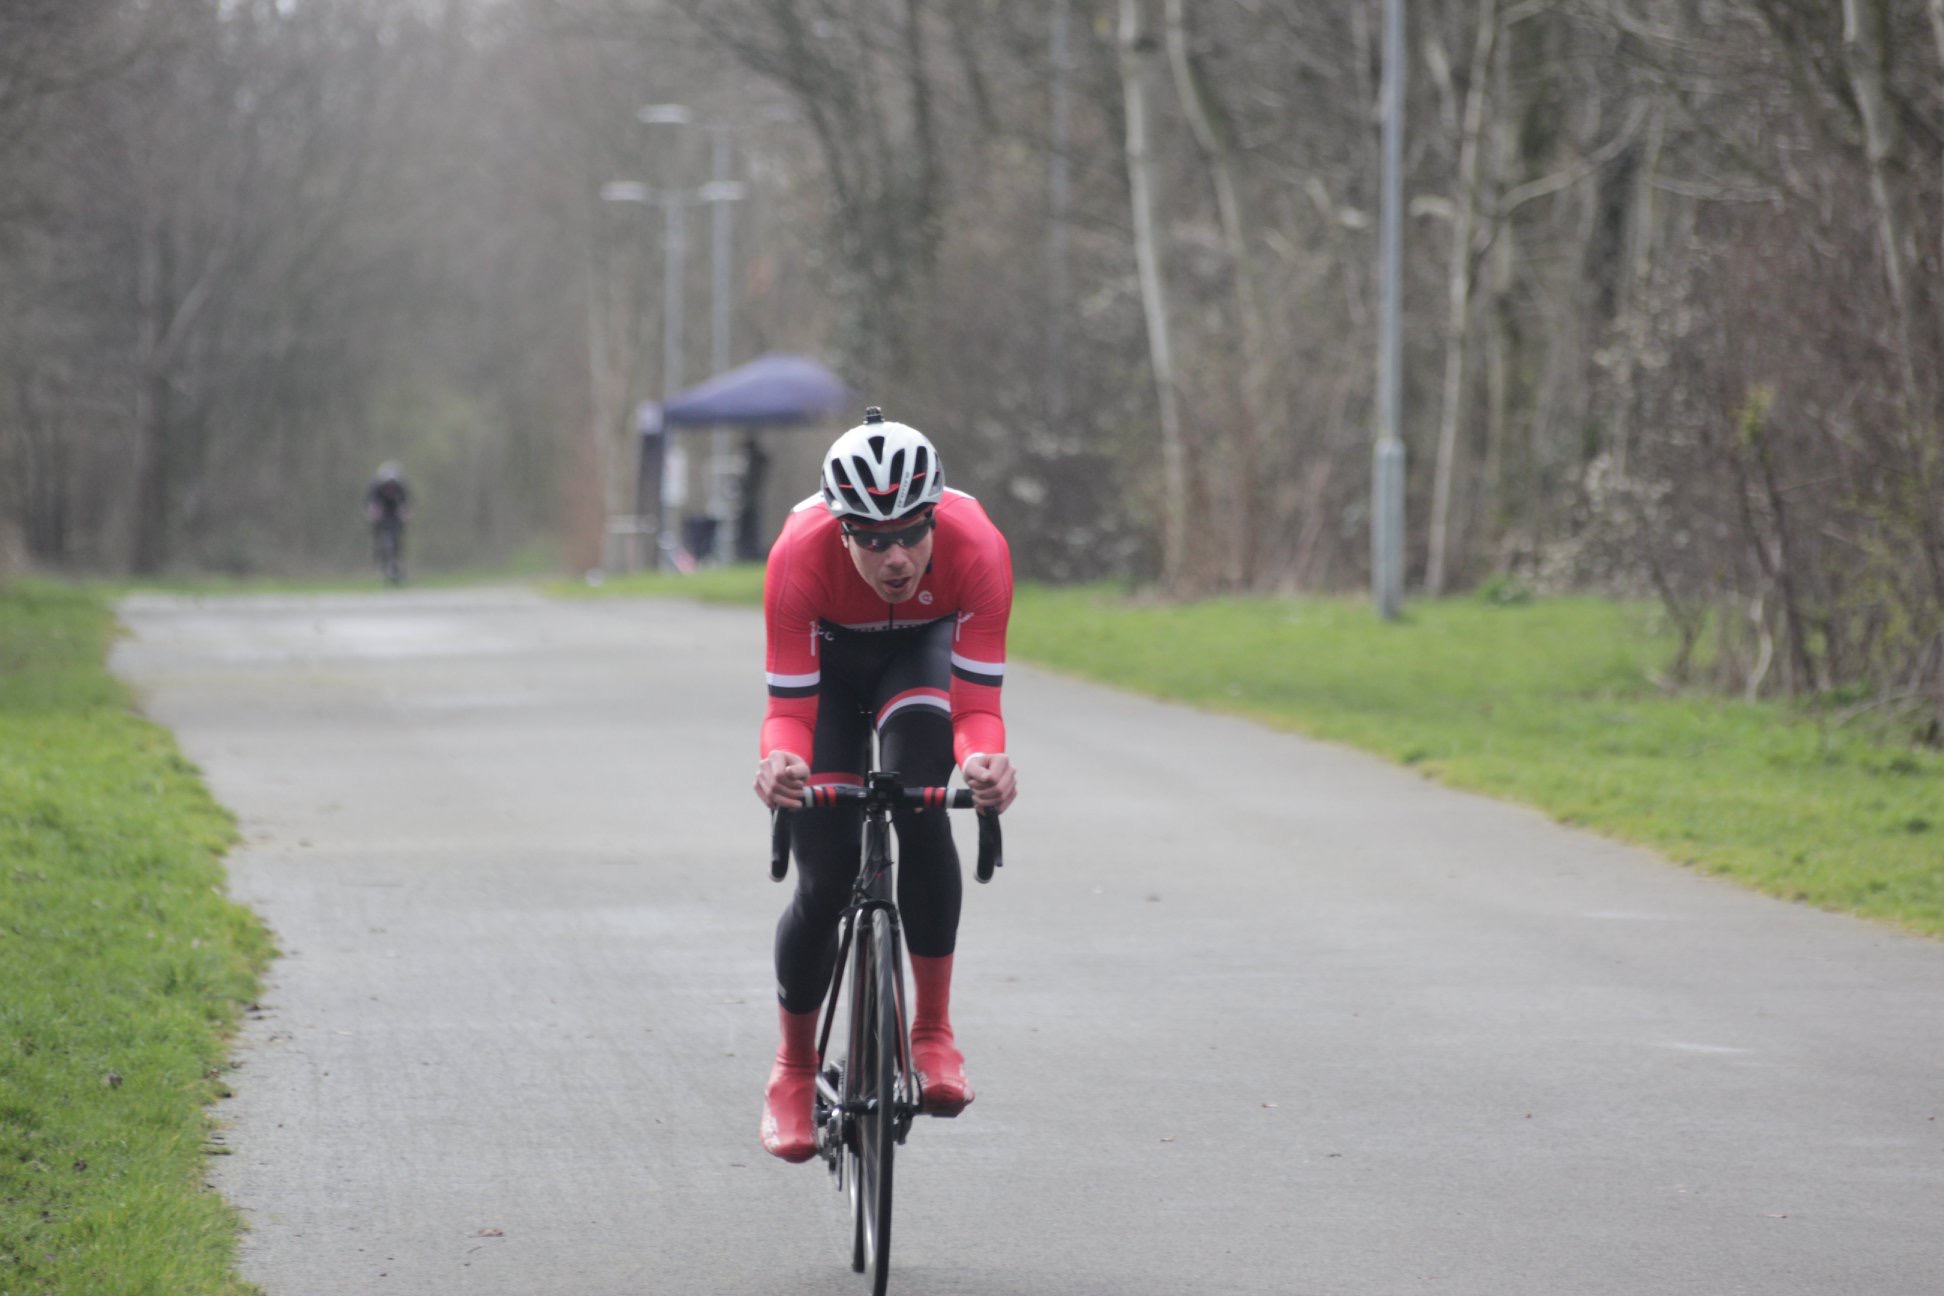
The Breakaway
After 20 minutes I decided to go for a breakaway and except for a couple of laps to start with, it was solo effort to the finish. You can see this on the above graph, I stop being in the Blue and my CdA is up in the shaded orange section, I am now less aero than my average CdA. Each step in the line represents my CdA for a lap. I am happy that I was pretty consistent at keeping my Aero Position.
Overall Aero Stats
So how did my aerodynamics change from the Bunch to my Solo Break. Using the conditions on the day I have also used myWindsock to estimate Watts to lap the Salt Ayre course at 25mph.
| CdA | Watts @ 25mph | |
|---|---|---|
| Full Race | 0.238 | 315 |
| In the Bunch | 0.188 | 265 |
| Break Away (Solo) | 0.264 | 350 |
One more thing… Braking Analysis
In the below picture you will see the myWindsock.com Detected Braking graph. Interestingly I only used the brakes when in those first 20 minutes when in the bunch. Braking is taking away your energy. By attempting to reduce the amount of braking by being less reactive when riding in the bunch may be away to further conserve energy. This is just a thought.
Analyse your rides and races
It’s easy to access your ride’s CdA and analyse with myWindsock. You can connect Strava to myWindsock.com and view all your Activities and Segment efforts immediately. Or simply upload your ride file to myWindsock.com Get started here.
Look for some pre-race weather and analysis? Check out the British Cycling Event forecasts before your next race.