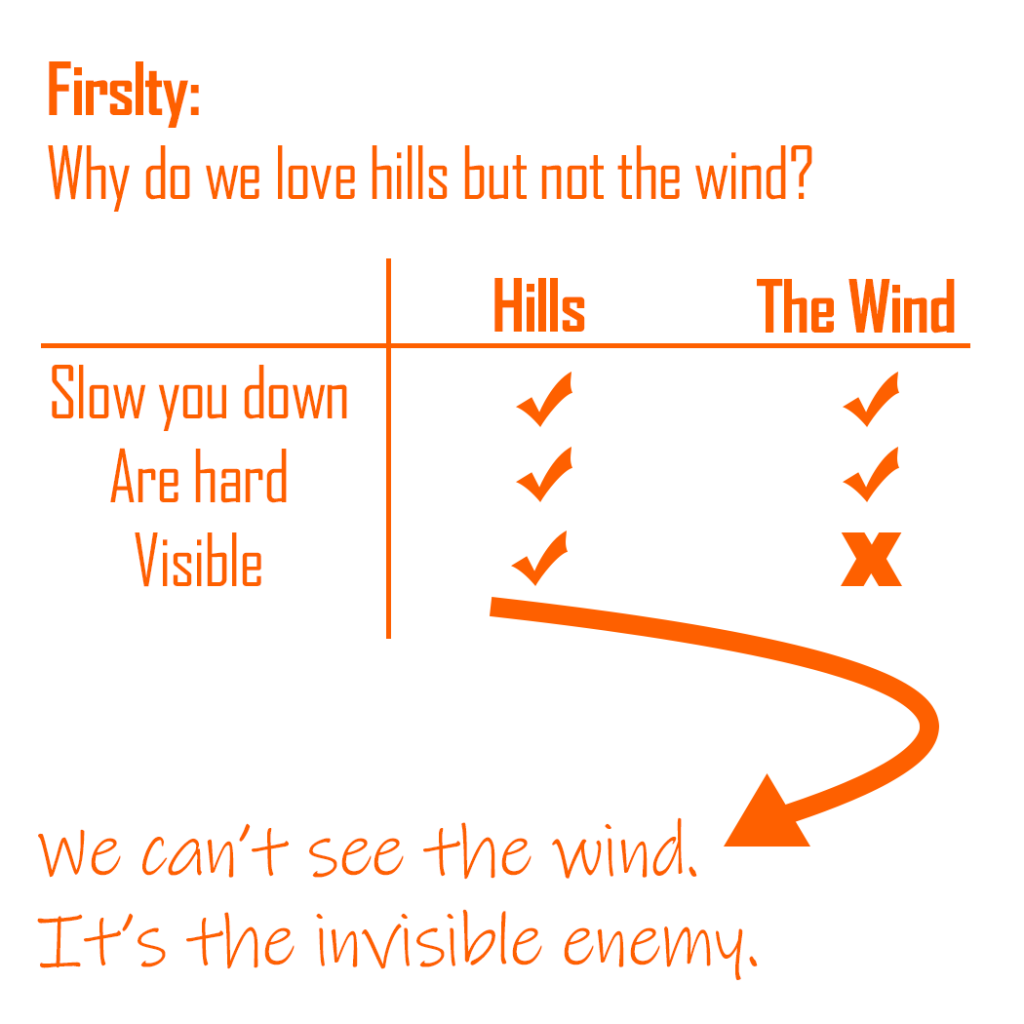
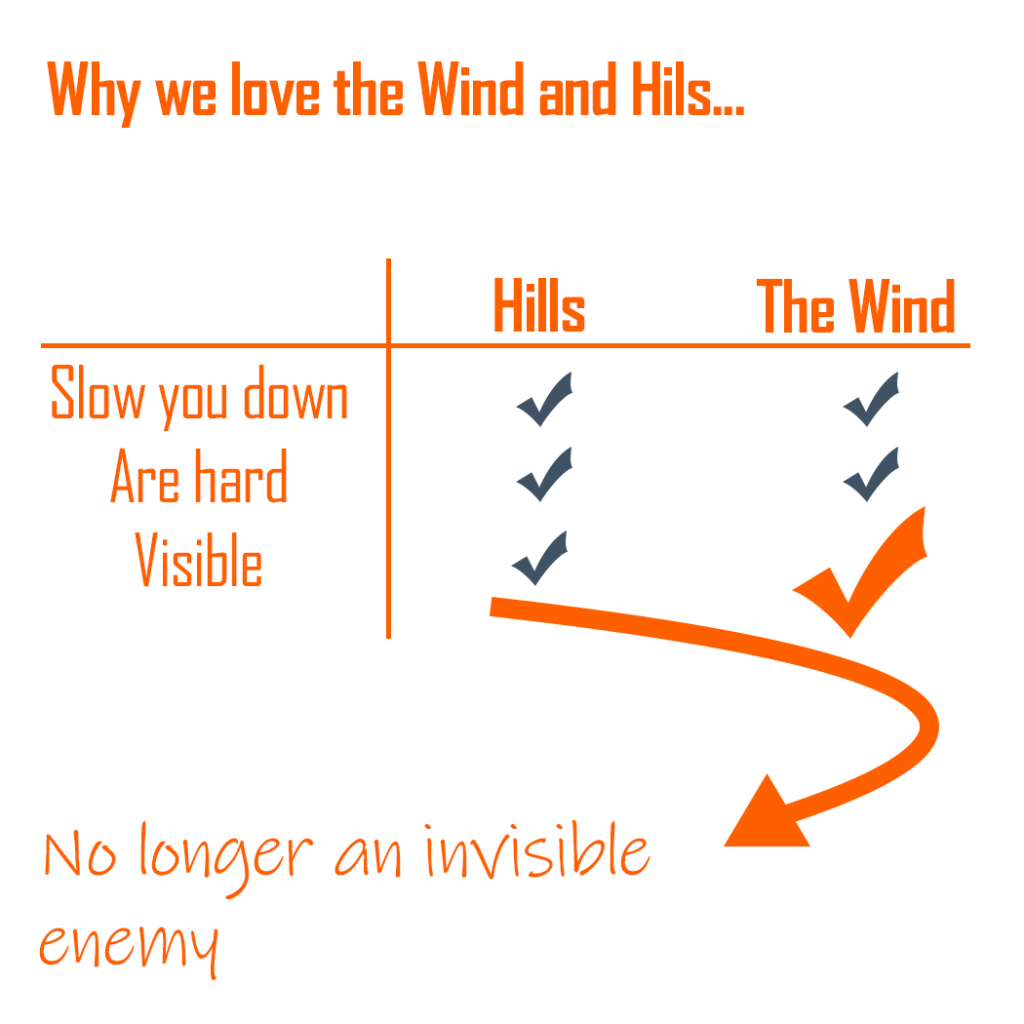
We cyclists have a love, hate relationship with the wind. We love the fast tailwinds. But the headwind, not so much.
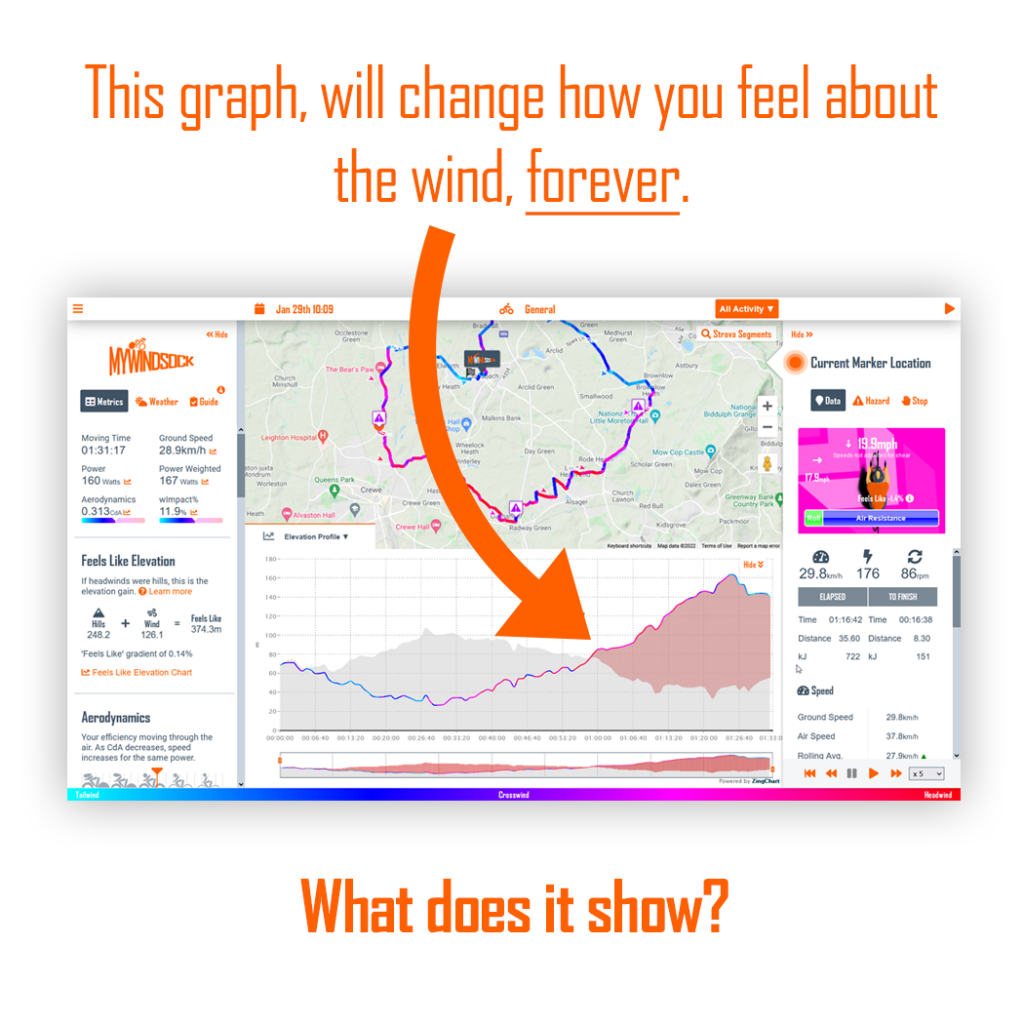
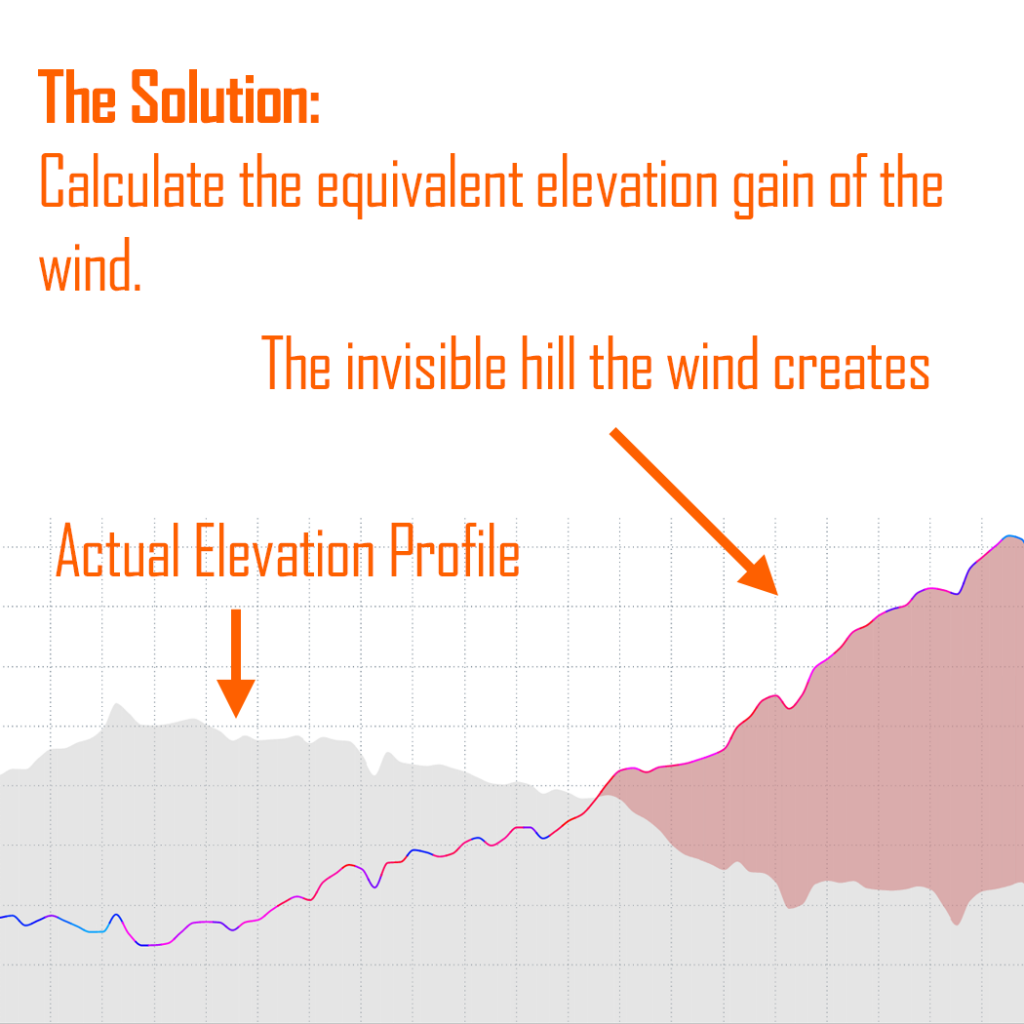
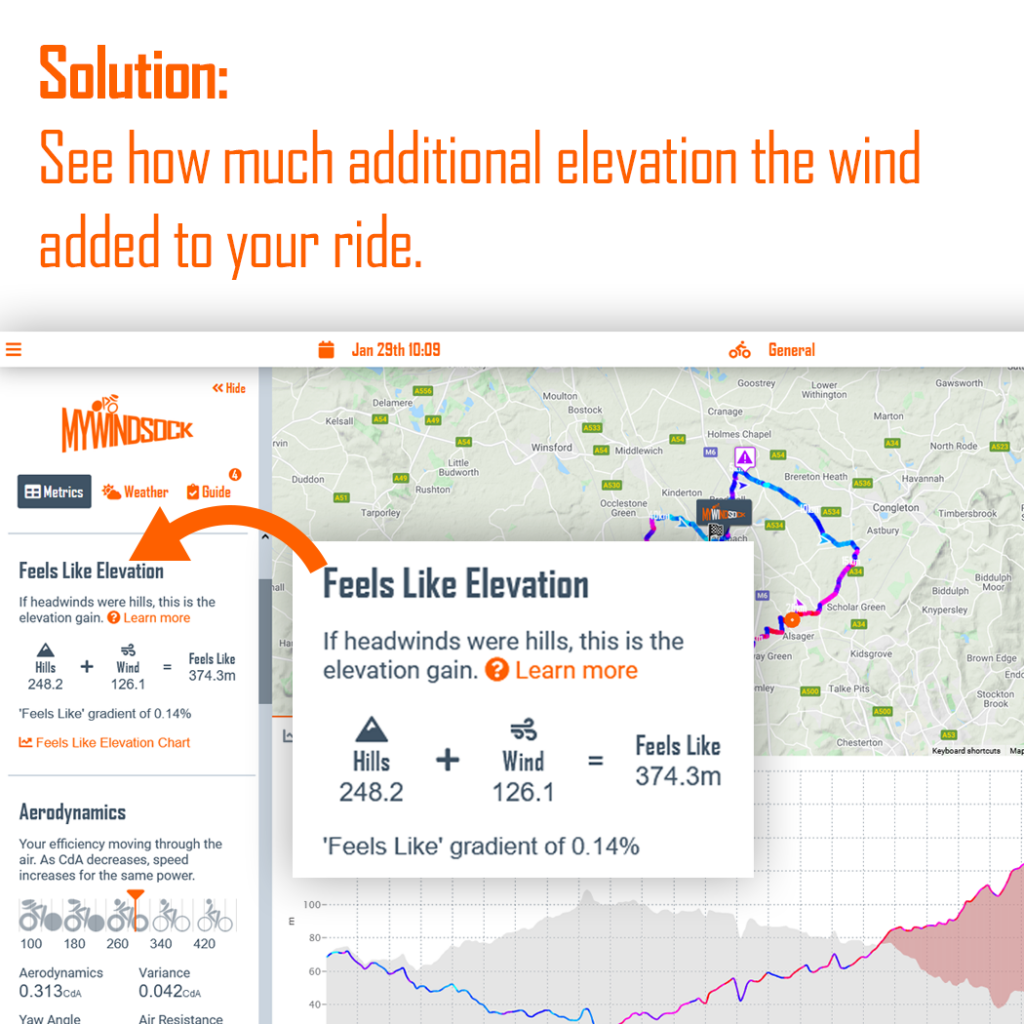
One way we visualise the impact of the wind, on your bike ride, is to show the equivalent elevation gain. We show you the hill that you climbed battling each headwind.
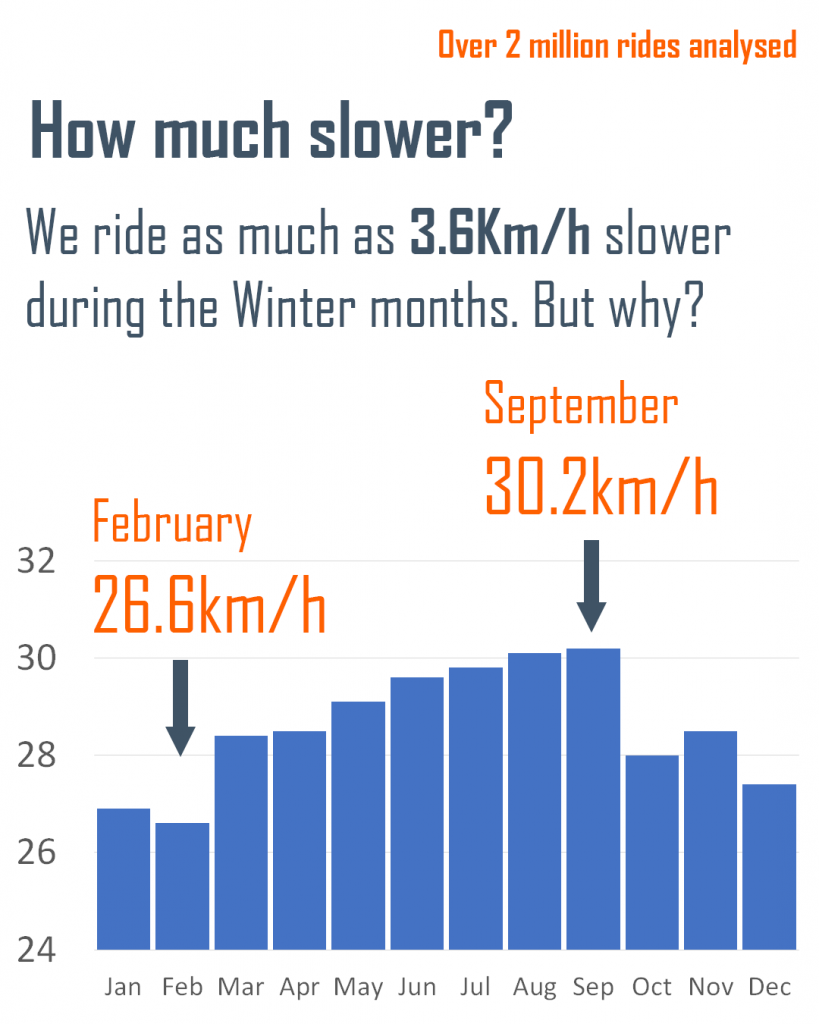
We’ve analysed 2 million rides to find out. Do we ride slower in winter? and if so why. Purely to make ourselves feel better about our current off season performance.
February is the Slowest month, with an average ride speed of 26.6kmh. Speeds begin to pick up in March, rising through Spring and Summer, to peak in September at 30.2kmh.
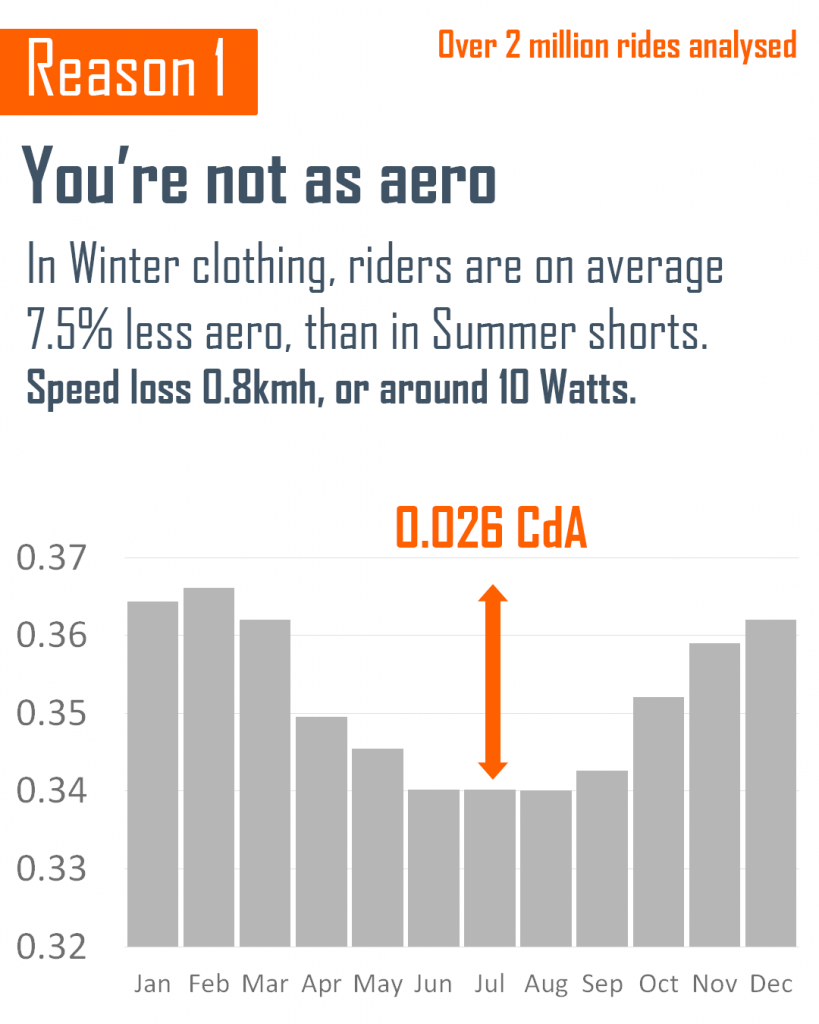
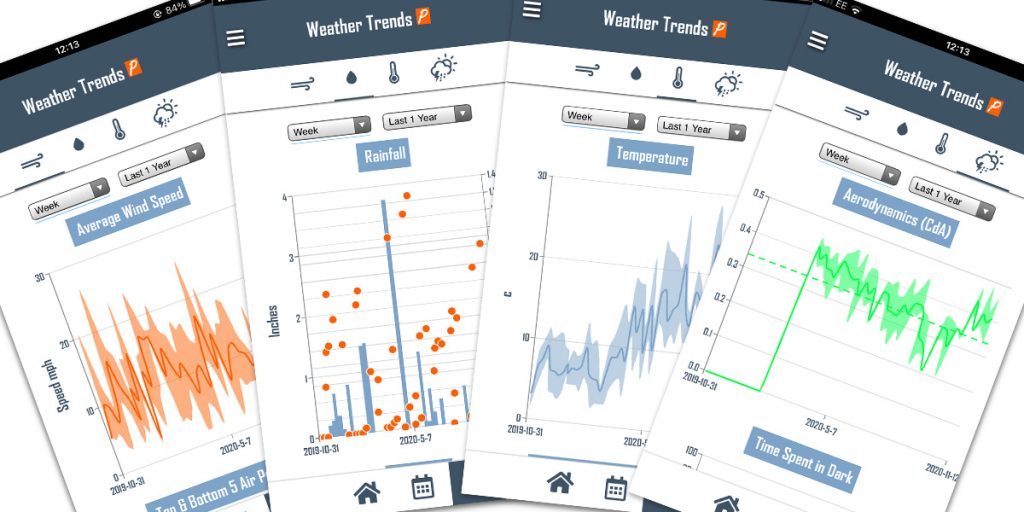
The first reason, in our unique analysis of 2 million rides, is the reduction in aerodynamic efficiency. CdA is the overall measurement of an object’s efficiency moving through the air. As CdA increases so does the power to maintain the same speed. Or, a reduction in speed for the same power.
myWindsock calculates CdA for every ride that has power data. Subscribers can monitor their aerodynamics ride by ride, learn more.
In February, CdA is 7.5% higher than in July where the average CdA was 0.340, compared to 0.366 in Winter. The difference at an average speed of 30.2kmh is around 10 Watts.
Why? We don’t dress quite as minimally as we do in the Summer. Short sleave jerseys are replaced with rain and wind repellent jackets. Lights, mudguards and less aerodynamic bike frames also contribute to the reduction in aerodynamic efficiency.
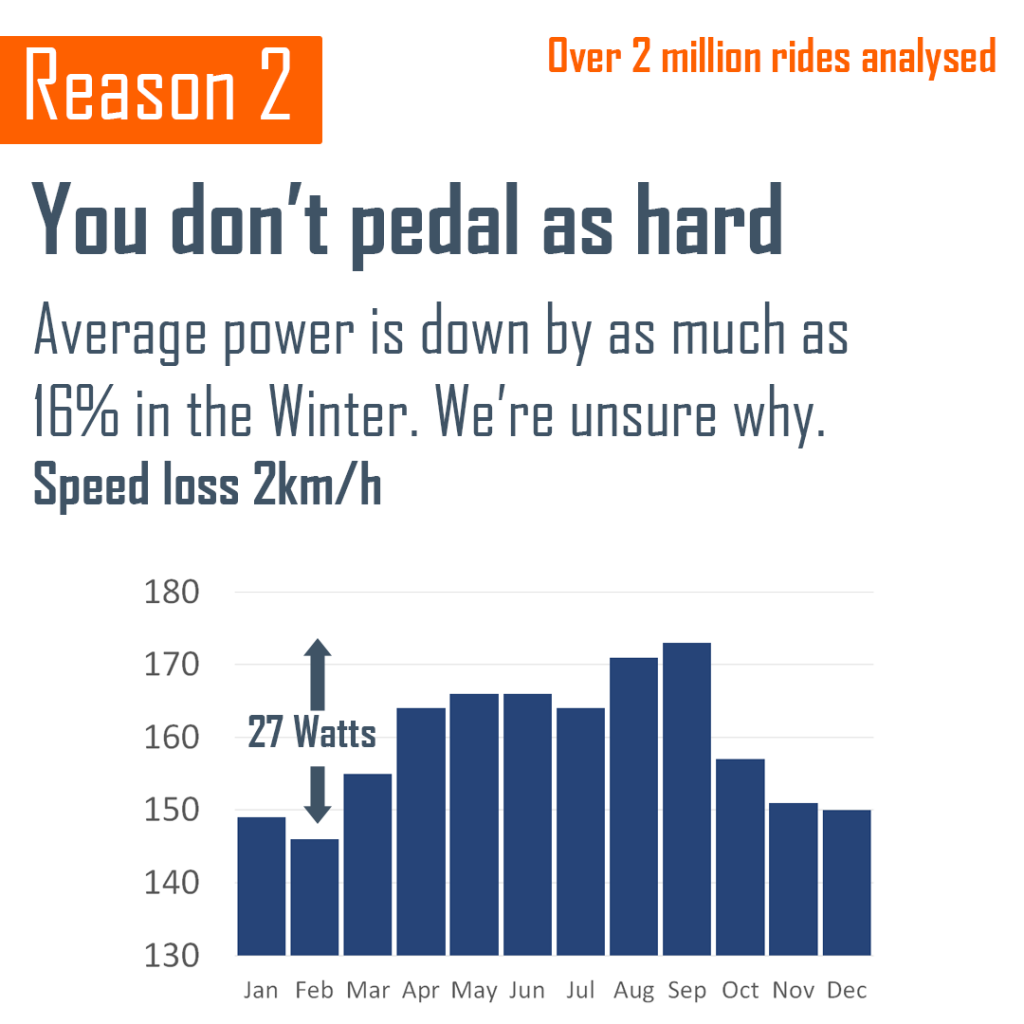
Reason 2, cyclists in Winter don’t pedal as hard. We expected this, however we are suprised at by how much. Riders are averaging 173 Watts in September. By February we are down to 146 Watts. On our Instagram page @mywindsock we’ve had so speculation as to why this is.
@itsjakevita “Most cyclists that train only do Z1/2 rides all Winter and the higher FTP stuff in Spring/Summer.”
@ade_fox71 “Wet slippy roads, cold temperatures never good for fast riding. “
@fazzasphotos “Keep some spare energy to get home as you don’t want to be on your last legs and breakdown at 2 degrees. Plus it’s mainly endurance, efforts are done on Zwift.”
The myWindsock population of athletes tend to be actively racing, this may also account for the difference in power. During Peak racing season1 to 2 rides a week are likely at full race pace during the Summer months.
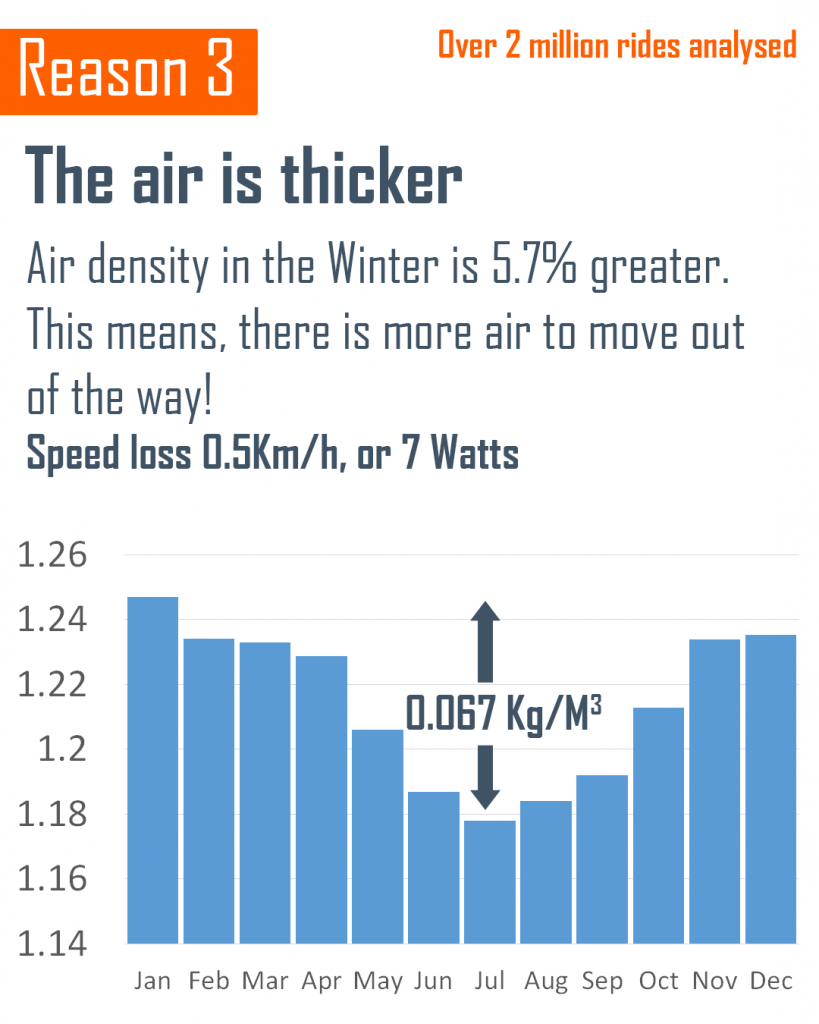
A very typical myWindsock weather stat here. Air Density becomes greater as the temperature decrease. Meaning, in the Winter, there is literally more air to move out of the way when riding along. The air density between Summer and Winter can cost as much as 7 Watts, or 0.5kmh off the average speed.
Conclusion
If your speed is lower in the Winter, you’re in good company. You now know it’s a combination of your clothing, a natural change of pace and the colder air holding you back. For safety, it’s probably not a bad thing our speeds are a little bit lower. Carrying a little less speed into potentially slippy corners is not a bad thing. It also makes Summer special. Remember ‘Winter miles mean Summer smiles’.
Would you like to discover more about your own rides? It’s easy to discover your CdA and more about the weather conditions you ride in. Start by signing up to myWindsock and connecting your Strava account for free.
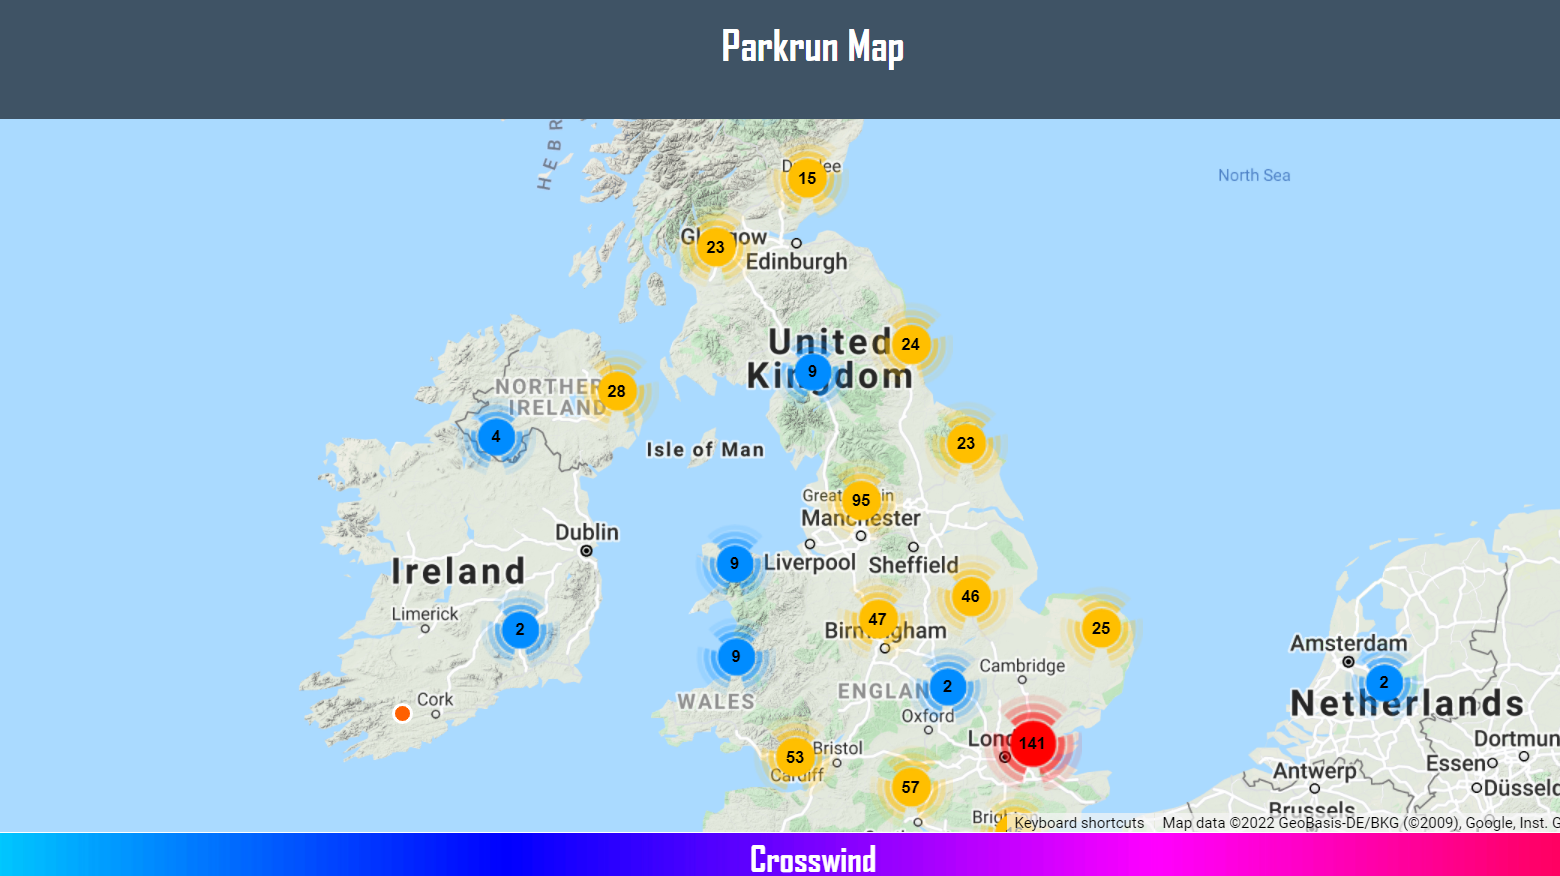
Did you know we have all the parkrun courses uploaded on our site? (If your course is missing or an old version, please let us know here and we can update it for you.)
Simply click on your location to find a course near you.
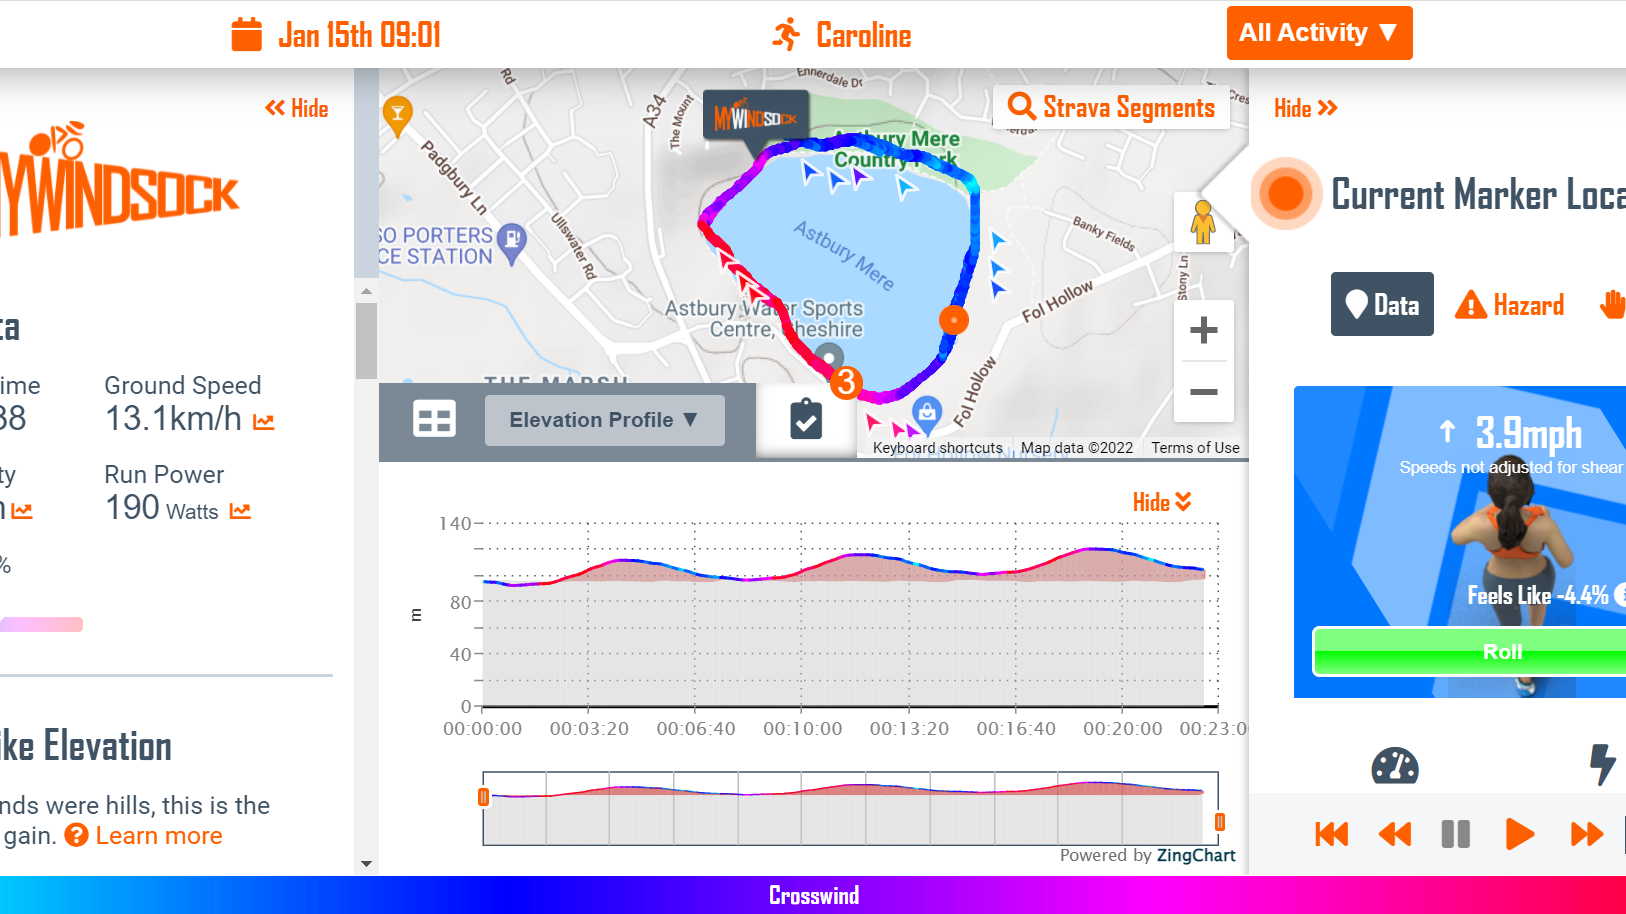
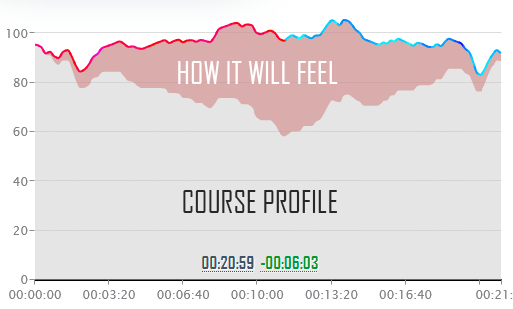
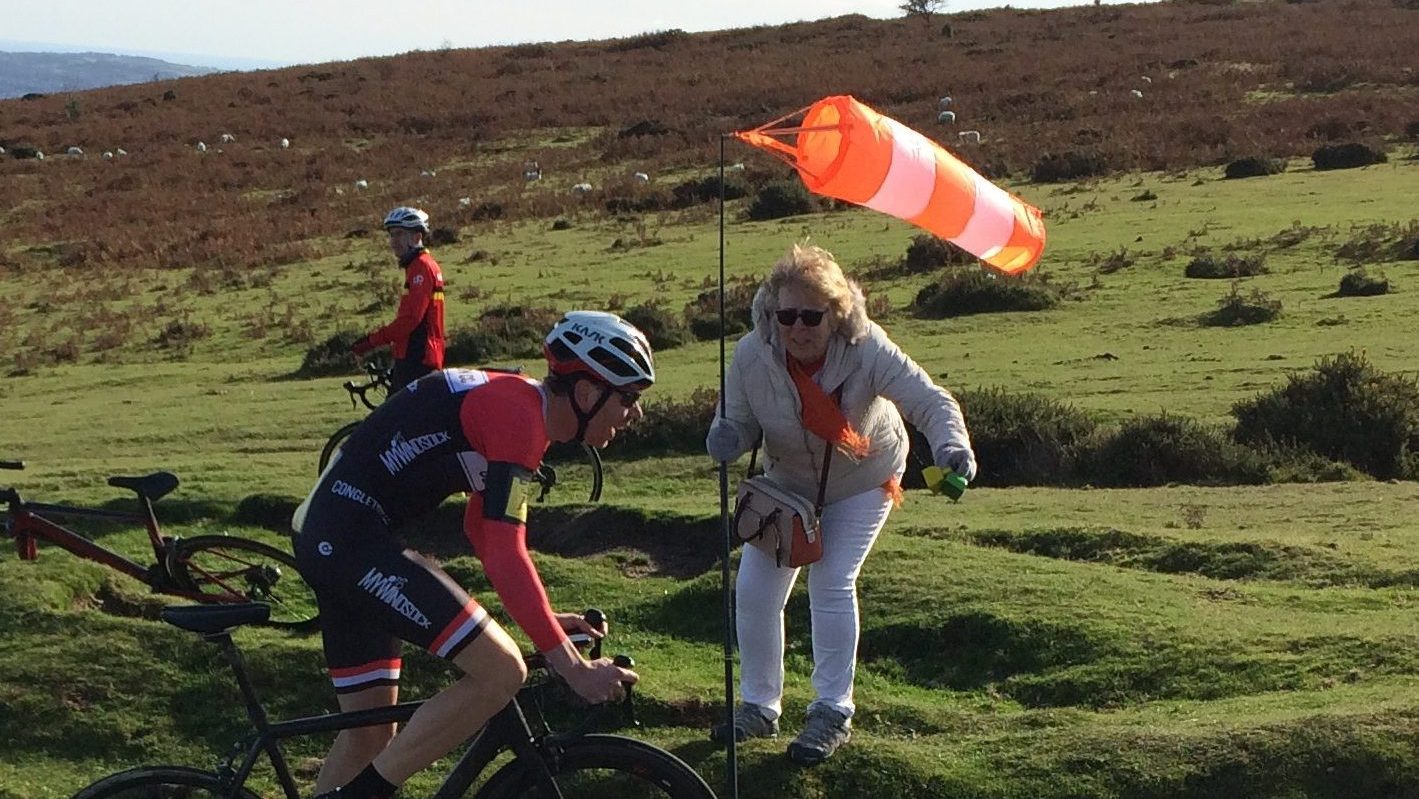
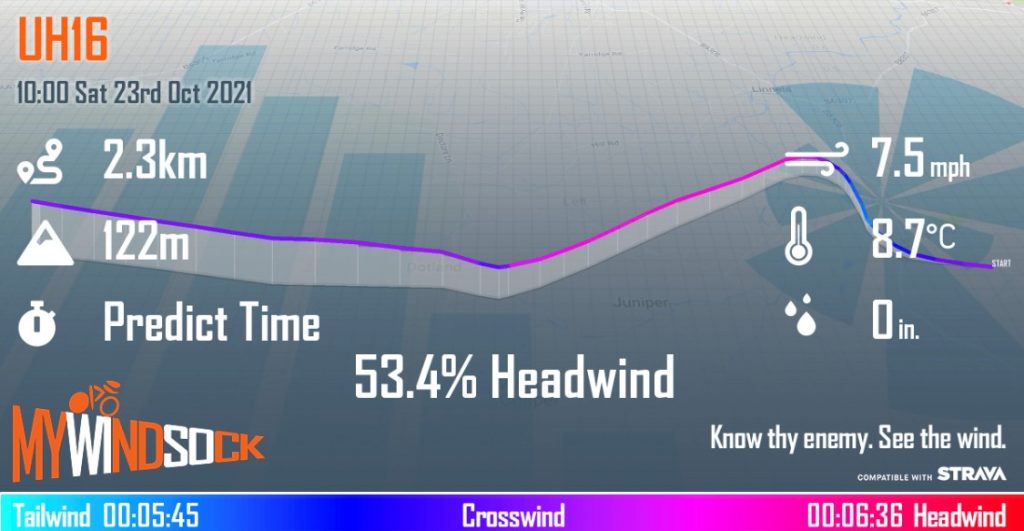
MyWindsock gives you a full detailed course and weather analysis. See how the wind and weather affects your run on a given day either post run or pre run to help you prep. For example, here we have Congleton Parkrun at Astbury Mere, which is normally a flat course (shown in grey). We can see how the wind gives a small up hill, down hill feel with the wind direction so this can help us better prepare going into our run and pace ourselves accordingly.
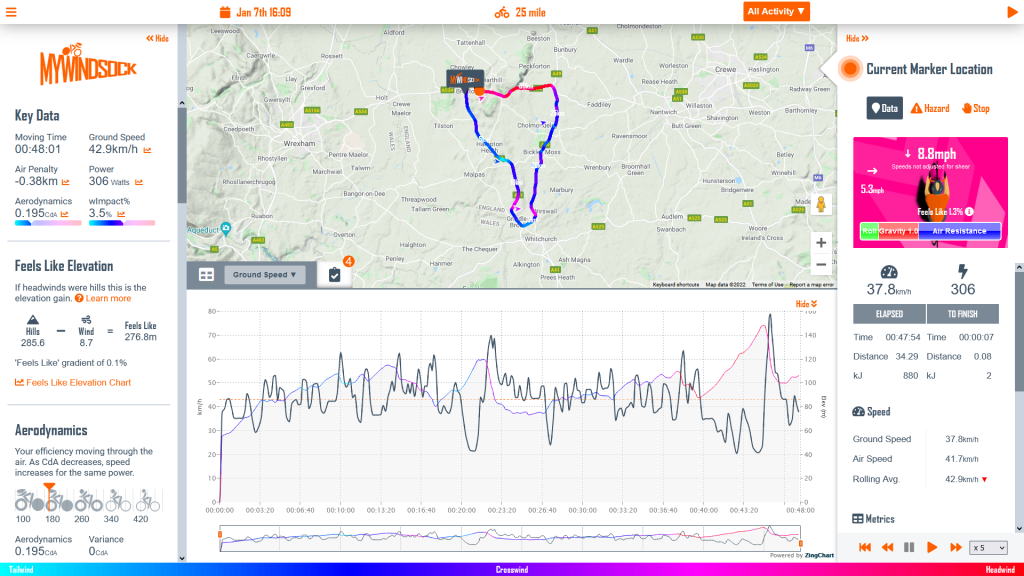
We have been working on the desktop user interface. We noticed, the most frequently selected chart item was ‘Summary Data’. Switching between the activity or interval Summary, whilst experimenting or learning about your activity, isn’t very efficient.
In desktop view, you can now view the Summary Data (left panel), along side charts and Current Marker Location (right panel).
You may not always want the Summary in view, or even charts and Current Marker Location. So we have added the functionality to hide each of these as required. Simply click on the “Hide” button on the required panel.
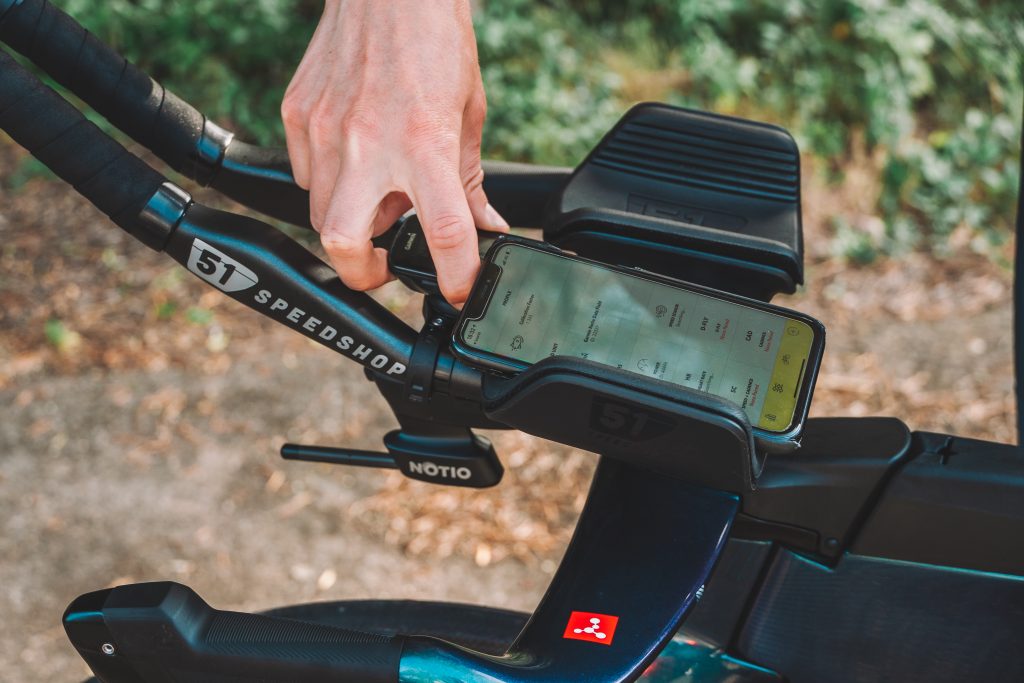
Enhance your myWindsock analysis* and measure your CdA in real time, with the world’s premiere on-bike aerometer. Maximize your gains by testing your position and equipment for the ultimate aero advantage.
Upgrade to any myWindsock Premium (yearly) plan, this Weekend, to receive $50 Off a Notio Aerometer!
Upgrade from only £9.99/$14.99 per year, to receive this offer. Learn more
Attach a Notio to your bike and you’ll be recording live air speed data. With this data, your aero computations are enhanced with moment by moment calculations. Combine a Notio with myWindsock Premium and you’ll have the ultimate package for aerodynamic analysis*
How Aero Analysis helps you go faster
To go faster you can either produce more power, or become more efficient. One of the ways to become more efficient is to move through the air with less resistance. Making changes to your position, or choosing better equipment, can lead to big improvements in your aero efficiency.
myWindsock Premium enables you to track your aero changes and make informed choices.
We measure your efficiency in CdA. The more efficient you are at moving through the air, the lower this number will be. Typically a road cyclist will be between 0.300 – 0.400. A racing cyclist on a road bike will be in the 0.250-0.300 range. Time trial cyclists will be even lower, with some specialists below 0.180.
Upgrade this Weekend to any myWindsock Premium package, to receive a Notio $50 Off voucher. Offer available 26th-28th November 2021. Please note the Voucher must be redeemed this Weekend.
Upgrade now from only £9.99/$14.99 per year, to receive this offer. Learn more
You already cheat the wind with myWindsock Premium, but now you can get even more aero with $50 off a Notio! Measure your CdA in real time with the world’s premiere on-bike aerometer and maximize your gains by testing your position and equipment for the ultimate aero advantage.
Not already a myWindsock Premium subscriber? Upgrade now from only £9.99/$14.99 per year, to receive this offer. Learn more
Attach a Notio to your bike and you’ll be recording live air speed data. With this data, your aero computations are enhanced with moment by moment calculations. Combine a Notio with myWindsock Premium analysis and you’ll have the ultimate package for aerodynamic analysis*
*Notio data analysis in myWindsock is expected January 2022.
How Aero Analysis helps you go faster
To go faster, you can either produce more power, or become more efficient. One way to be more efficient is to move through the air with less resistance. Making changes to your position, or choosing better equipment, can lead to big improvements in your aero efficiency and speed.
myWindsock Premium enables you to track your aero changes and make informed choices.
We measure your efficiency in CdA. The more efficient you are at moving through the air, the lower this number will be. Typically a road cyclist will be between 0.300 – 0.400. A racing cyclist on a road bike will be in the 0.250-0.300 range. Time trial cyclists will be even lower, with some specialists below 0.180.
Premium gives you many more fascinating insights into your activities. Here is a run down of some pretty cool things to look at post-ride.
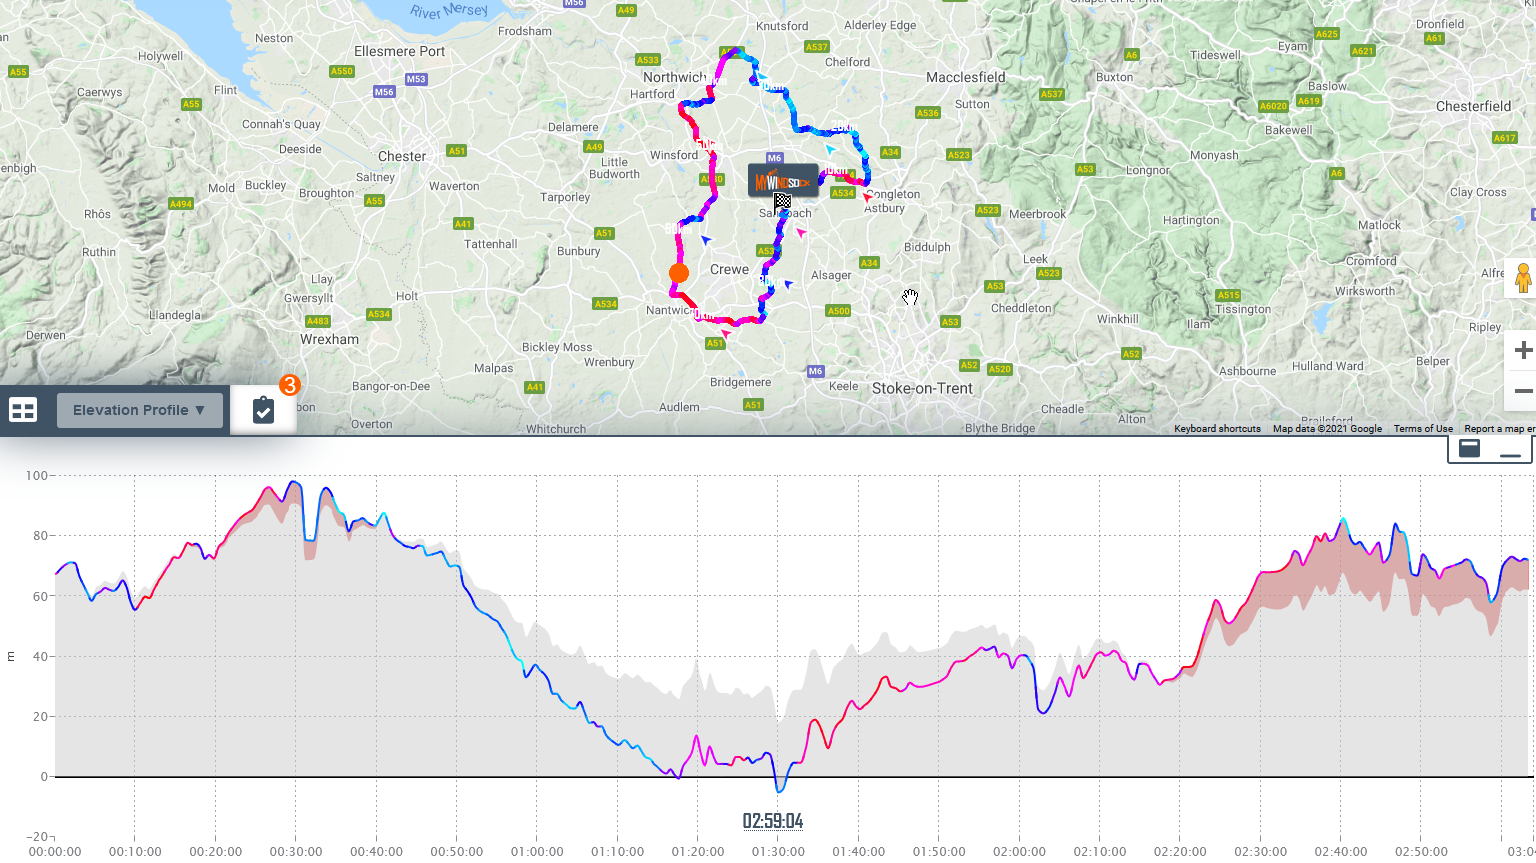
Feels Like Elevation
A Feels Like Elevation chart.
Metres or feet climbed on any ride gives an insight into how tough the terrain was. Bragging rights are given when huge elevations are ridden. We’ve developed Feels Like Elevation. A combination of the wind and elevation to give a true picture of how tough a ride was.
Whilst the elevation profile indicates it’s down hill out and up hill back, combine the feel of the headwind the profile looks a lot different.
Headwinds will increase the elevation by the relative effort to ascending hills. Similarly a nice tailwind will make the road feel a little more down hill and the elevation profile is corrected to reflect this.
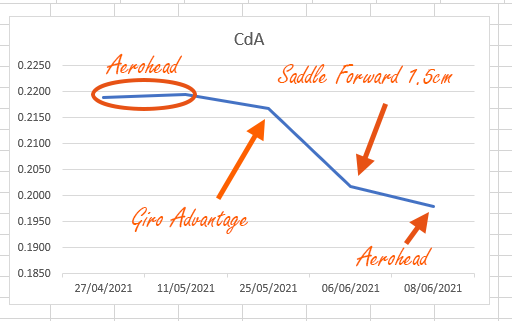
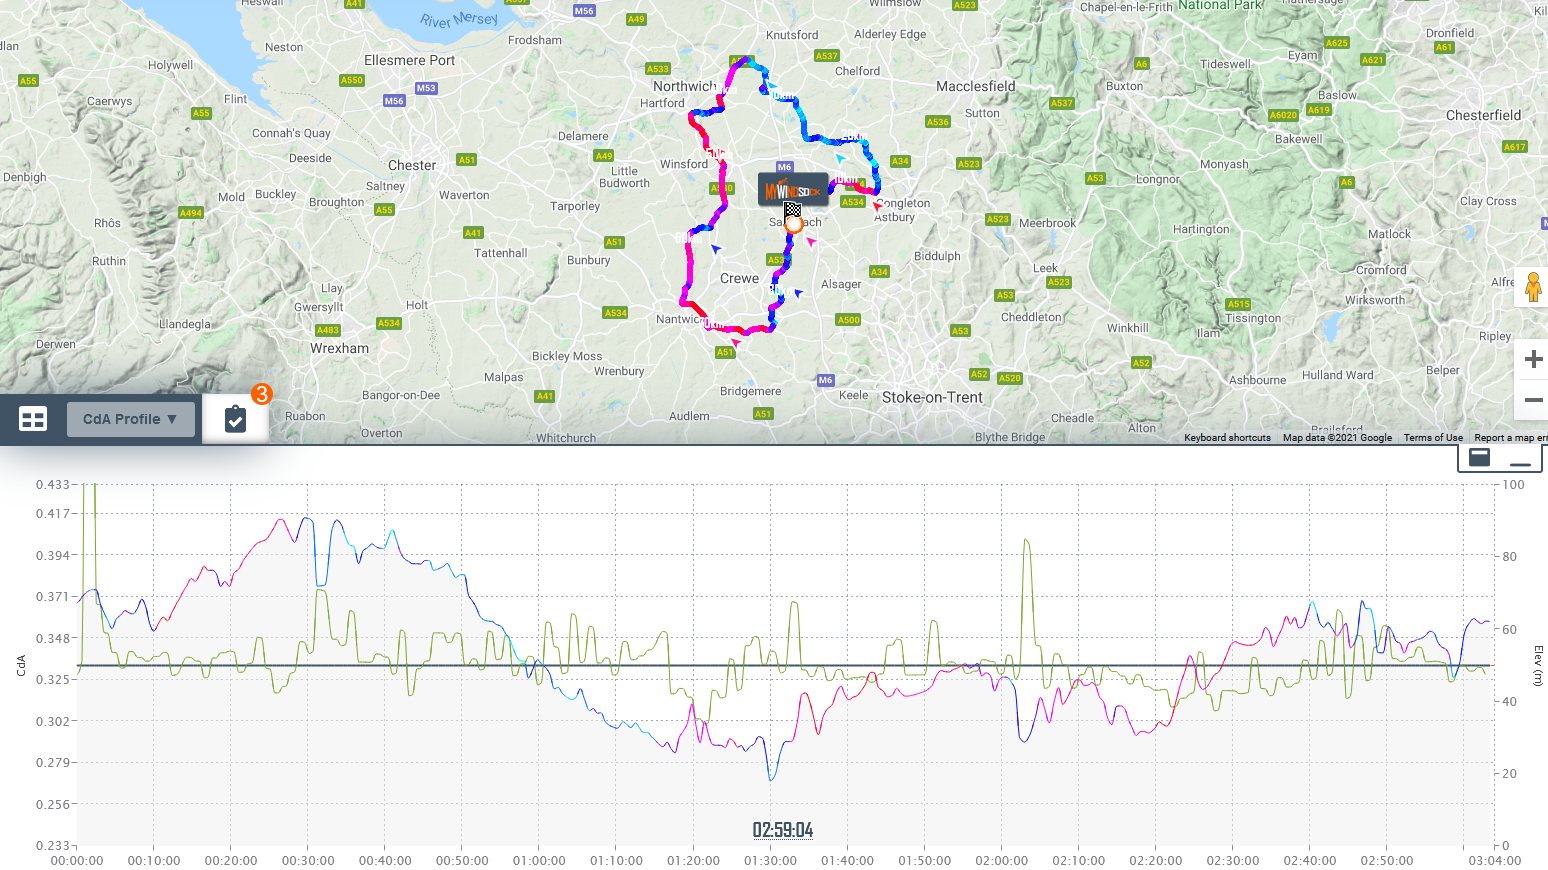
The CdA Profile depicts your aero efficiency during your ride.
Just how aero are you? Aerodynamics can now be tracked, just like your FTP and other performance metrics. Having an eye on these numbers during training keeps you in the competitive athlete mind set. Aerodynamics is reported in a metric called CdA. The lower your CdA is, the faster you will go for the same power.
Go further this Winter and actively work on your aerodynamics. Train your ability to hold your position.
Pro tip: Find a repeatable loop of a around 10-20 mins, where you can safely focus on your position. Complete 4-5 loops and see how your CdA alters on each loop. Do you start to notice a change with fatigue? See how steady you can keep the CdA.
Weather Impact is a key myWindsock Premium metric. It combines all enviromental factors to give a definitive rating of how great the a cost or benefit the weather was. We add this metric to your past rides, routes and very interestingly Strava Leaderboards.
On every Strava Segment effort we record the Weather Impact. On your latest activity use the Premium Strava Segment Filter to reveal the interesting Segments you rode through. Then access the Leaderboards, view how your best efforts compare and the top 10 Weather Impacts.
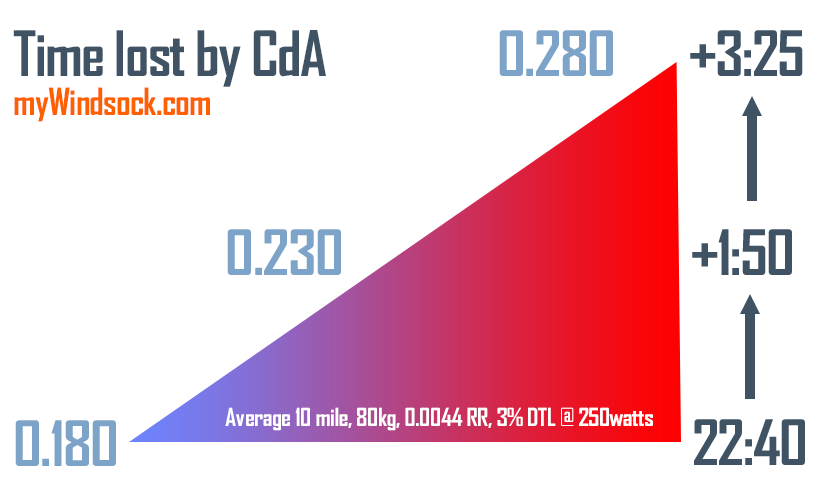
So lets get on to what we’re all really interested and look at how we can be the fastest possible.
Hammer the power?
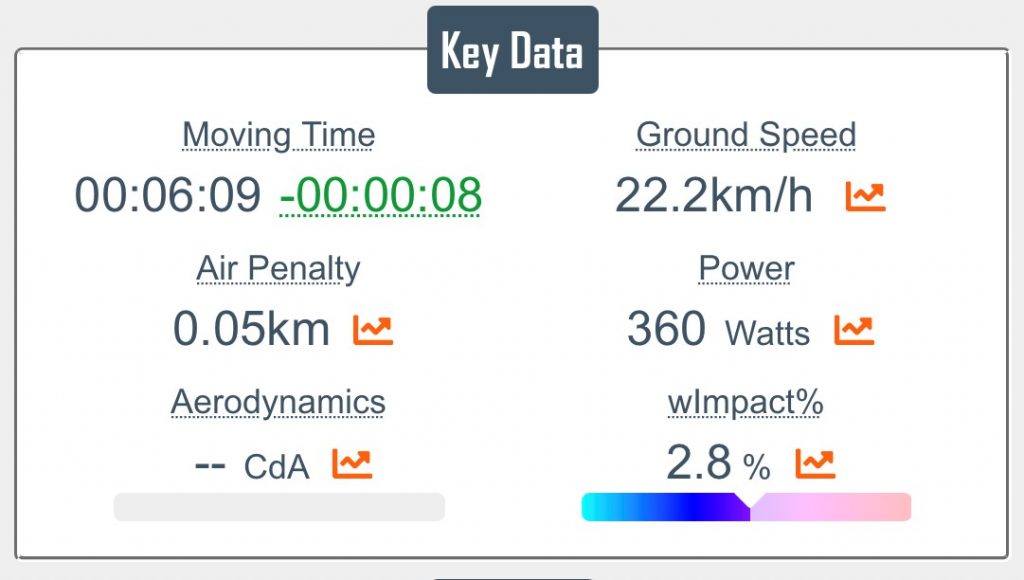
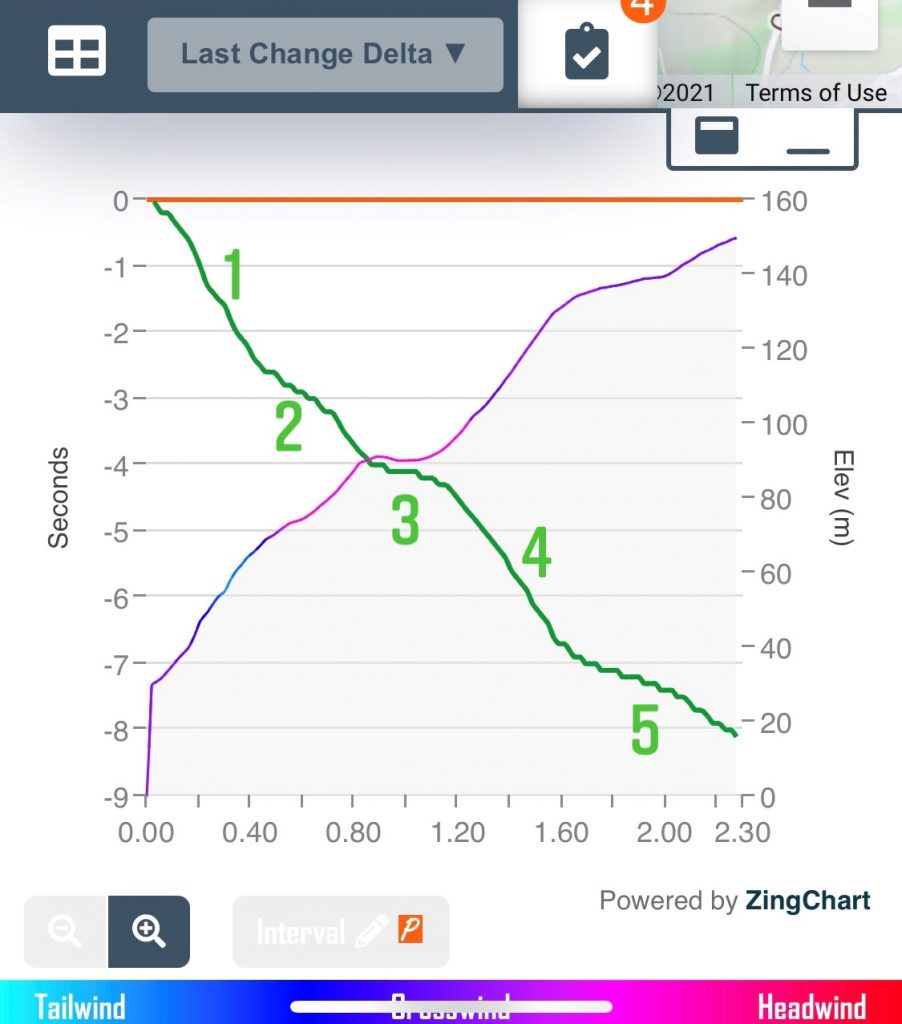
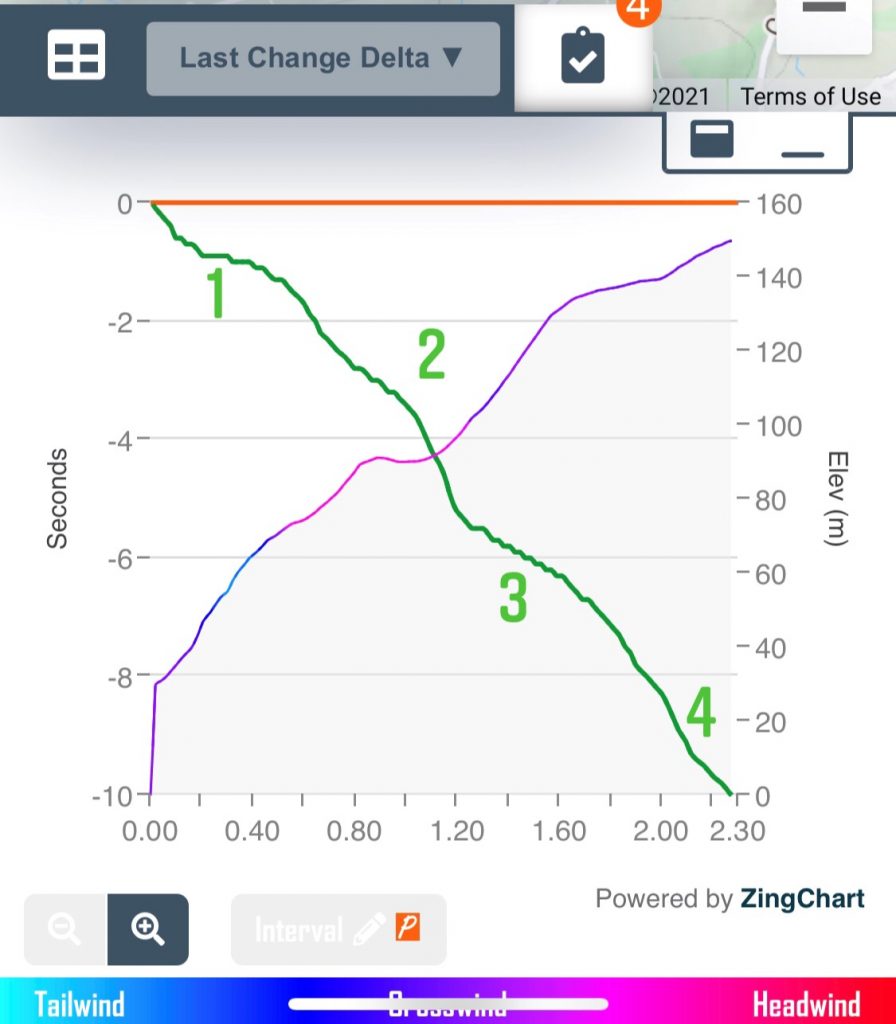
So here we see the time for a person with a bike and rider weight of 80kg, putting out an average of 350W and a CdA OF 0.335
Lets look at what happens if we put out an extra 10W across the course.
Shown in green meaning a quicker net time – we can see we have gained 8 seconds across the course by putting out 10W more.
So at the start (1) the green line becomes steeper meaning putting out more power here is important and will make a bigger difference.
At 2 and 3 we can see the line flattens out, meaning the increase in power hasn’t actually made much of a difference to your time here so you don’t need to waste extra energy pushing here.
Number 4 the line is at it’s steepest over the whole graph so here is where we really want to push out the power.
The finish (5), again flattens off, so obviously push out whatever you have left, but the best place to really focus on is number 4, just before the end!
The other big question is seated or standing? Obviously you can push out more power standing but sometimes to maintain standing for the whole climb isn’t always possible. So is there a best place to take a rest?
Seated or standing?
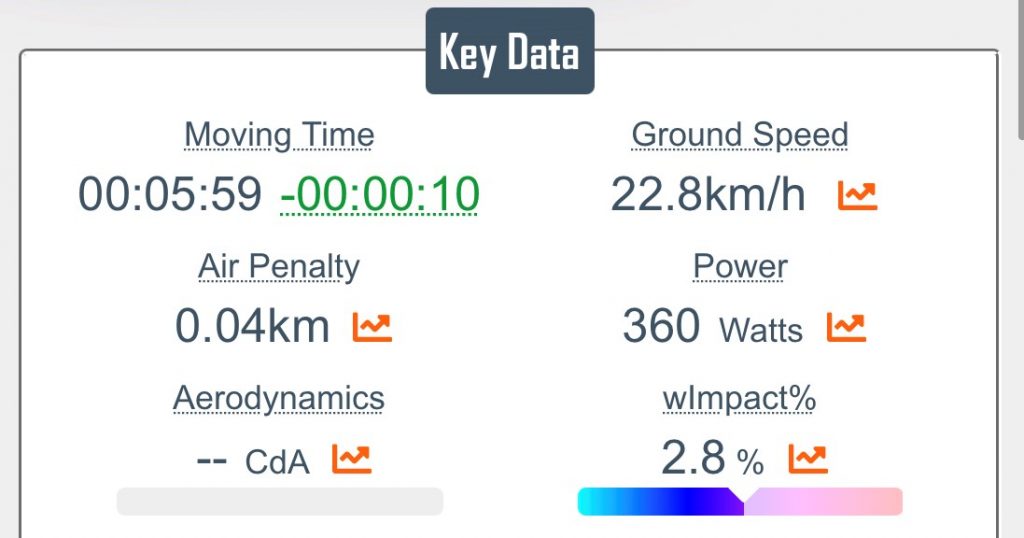
So here we see what happens if we are seated for the whole climb. I’ve lowered our CdA by 0.07. We have a net gain of 10 seconds across the course, but this is assuming we can keep the same 360W sat down and standing.At number 1 we can see the line is flatter which means having a lower CdA doesn’t make a huge difference so the best thing is to get out of the seat and get the power out.
At 2 we can see the graph is steeper and we saw from the power graph that the increase in power isn’t actually as important here, so here is the ideal time if you need a break from standing, lowering your CdA is favourable.
3 has a slight slope but is flatter than most of the graph and we know that this section, the power really makes a difference, so standing here really is your best bet!
4 gets steeper again so the lowered CdA will make a difference to your time in the region of about 2 seconds quicker.
General overview
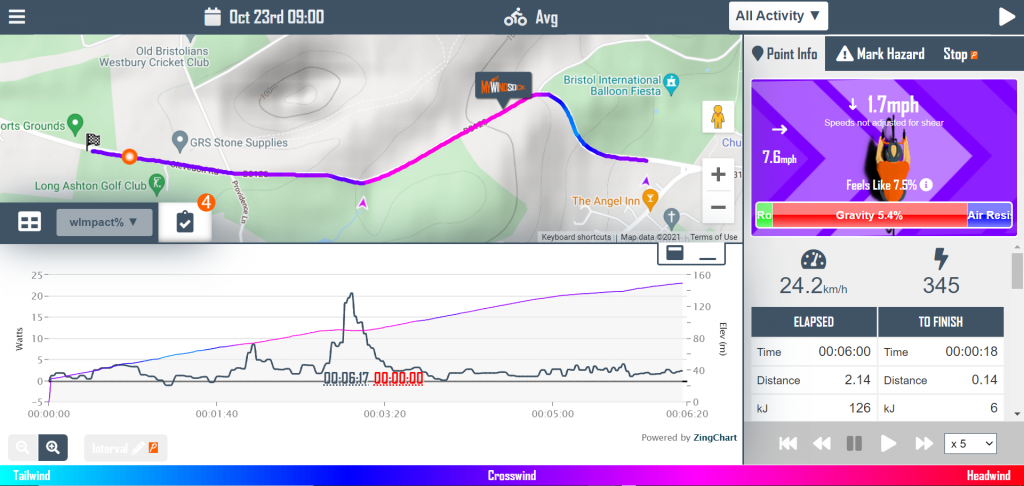
The weather impact graph shows the percentage more watts you will have to put out compared to baseline weather less conditions. As we can see from here, the middle of the climb has a very high weather impact of over 20%.
.
For live updates and to play around with your own numbers, find the forecast here.
.
These numbers are for a rider and bike of 80kg, CdA of 0.335 and 350W, with weather conditions of 20/10/21 – 11.30am
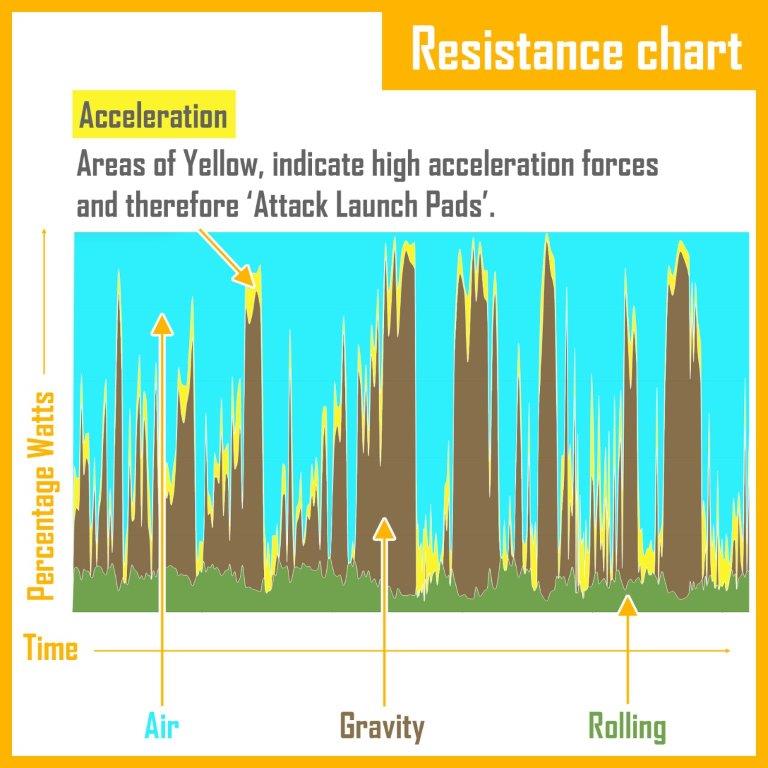
When attacking in a race, you need every Watt possible optimized to create maximum distance between you and your competitors.
The myWindsock resistance chart shows you each force acting against you and it’s proportions when moving forward.
On a ride, the limiting factor on your speed is the fact that your power is equal to resistances against you. Choosing areas in yellow means high acceleration opportunity, so this is a good place to attack as other resistances are lower here and not a limiting factor.
Areas with high proportions of blue show that wind and air resistance is a strong limiting factor so CdA is particularly important here. The reverse goes for areas with low amounts of blue – CdA isn’t as important here as air resistance is lower, so it might be better for you to get out of the saddle here and just focus on getting the power out.