We’ve analysed 2 million rides to find out. Do we ride slower in winter? and if so why. Purely to make ourselves feel better about our current off season performance.
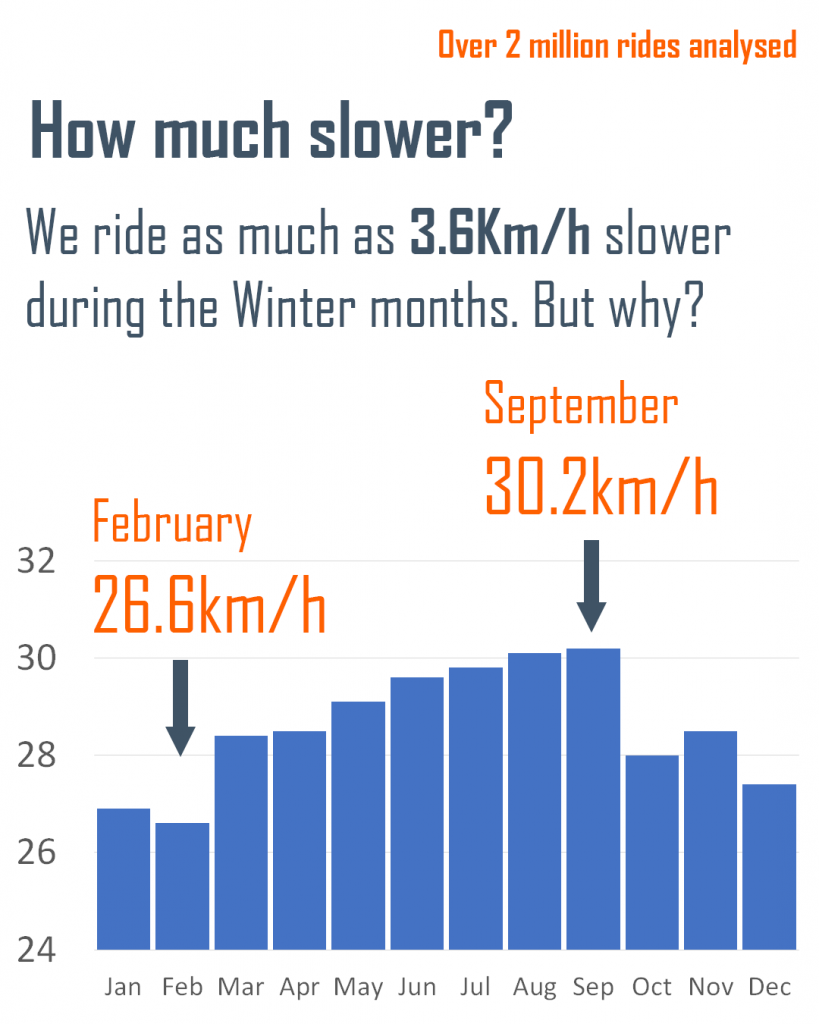
February is the Slowest month, with an average ride speed of 26.6kmh. Speeds begin to pick up in March, rising through Spring and Summer, to peak in September at 30.2kmh.
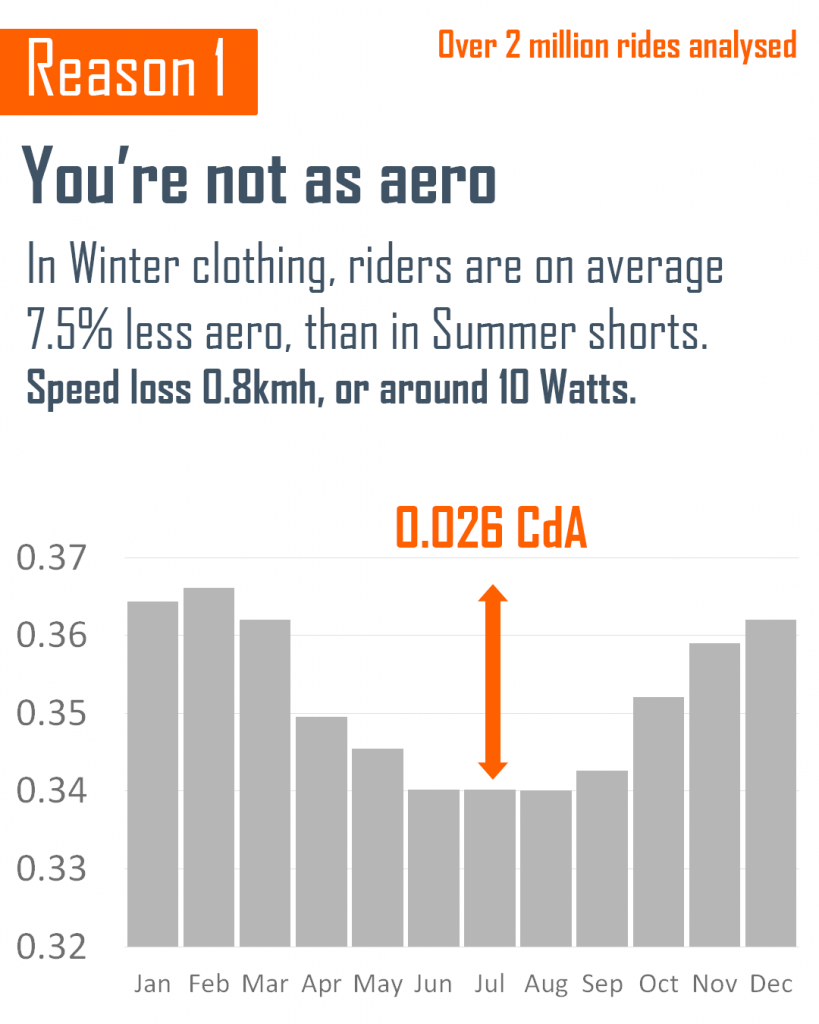
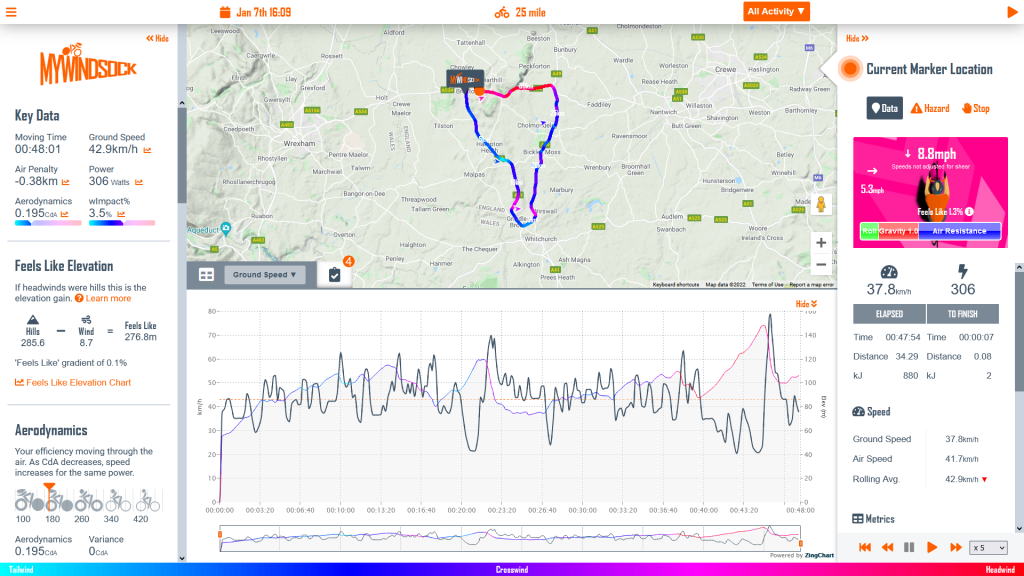
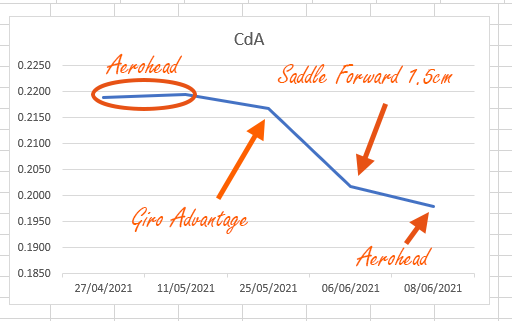
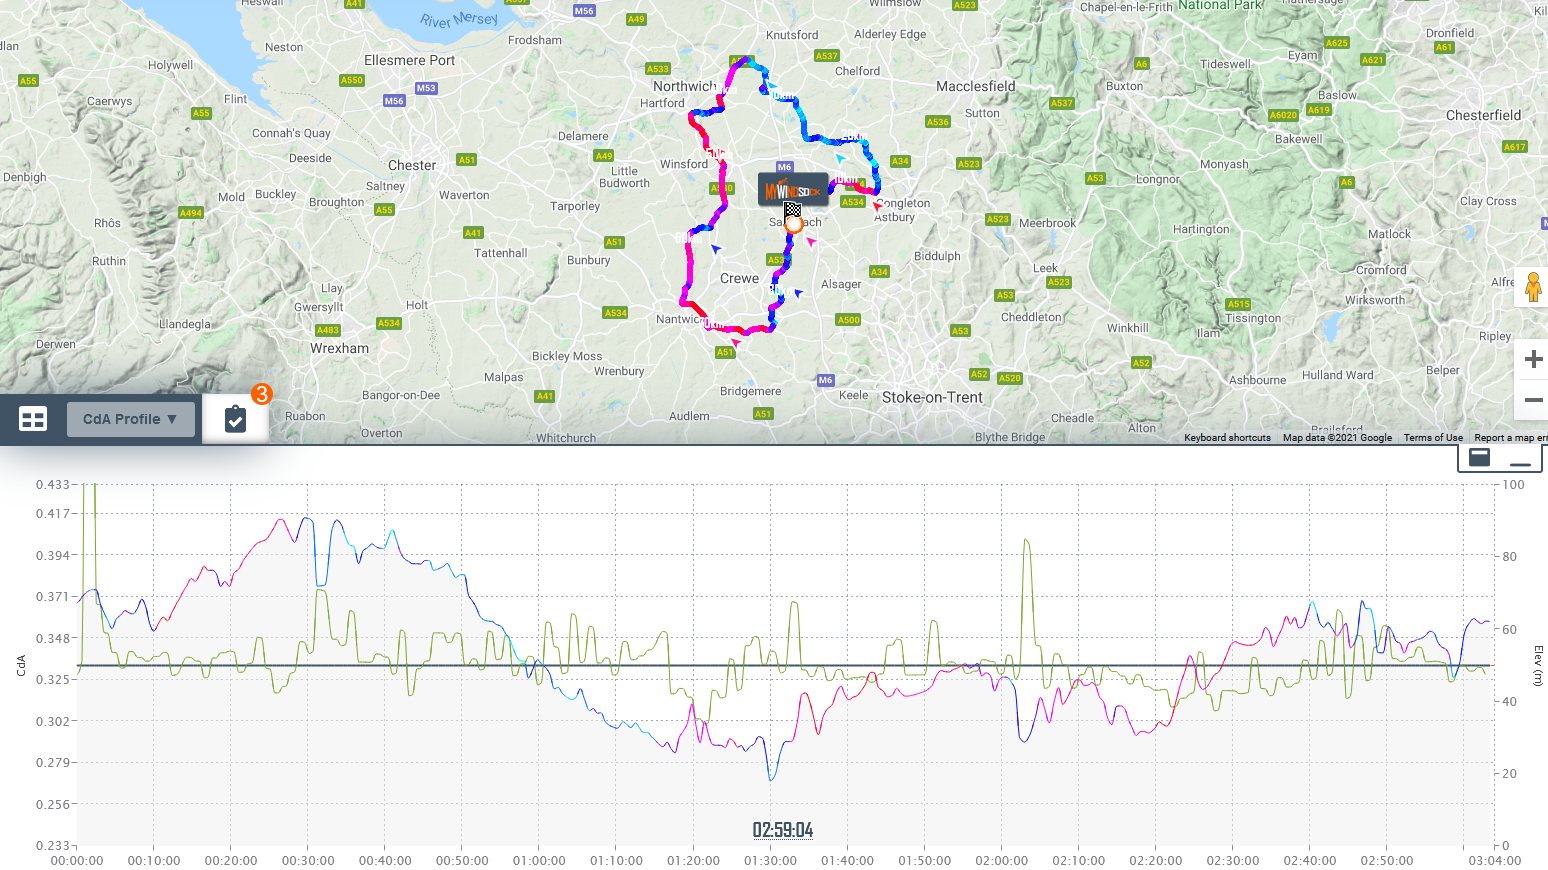
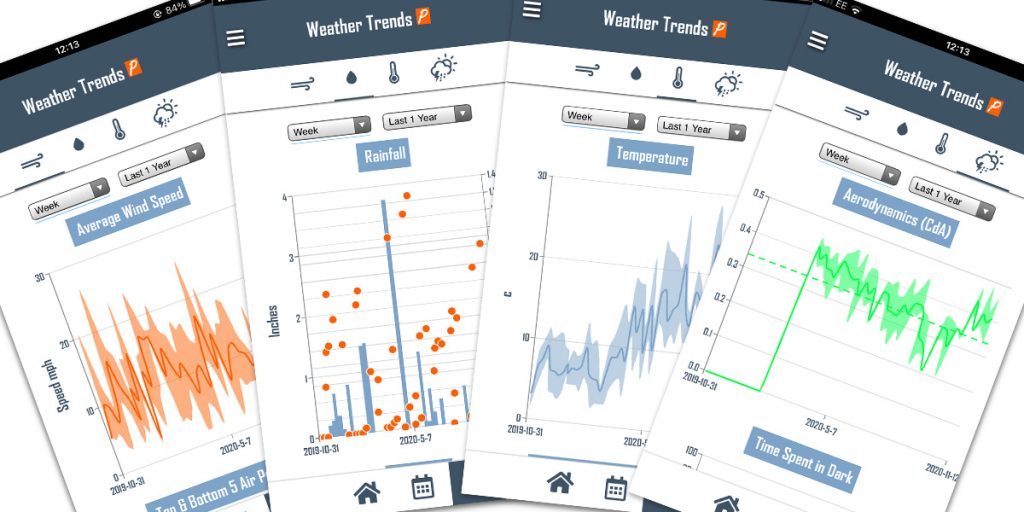
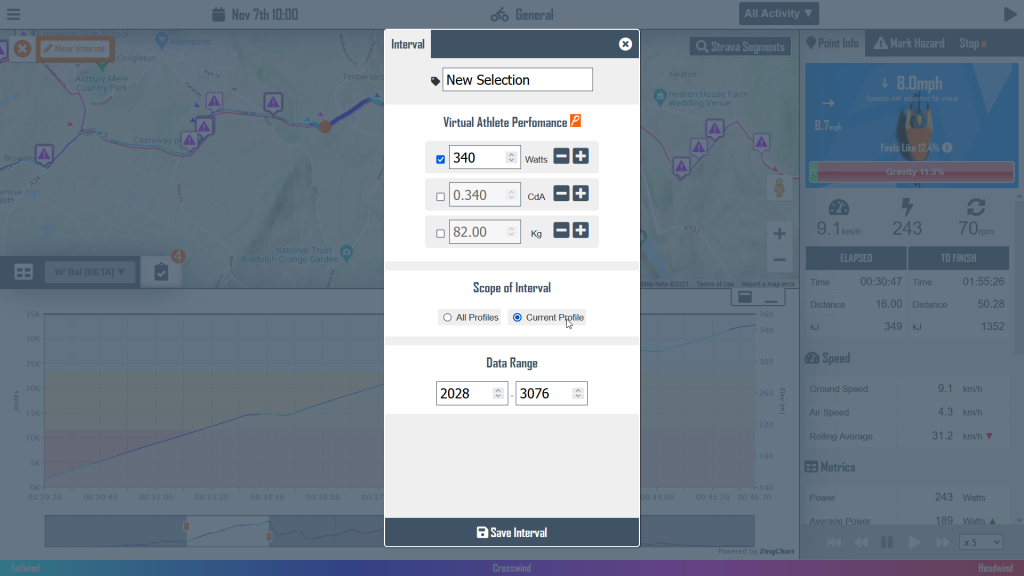
The first reason, in our unique analysis of 2 million rides, is the reduction in aerodynamic efficiency. CdA is the overall measurement of an object’s efficiency moving through the air. As CdA increases so does the power to maintain the same speed. Or, a reduction in speed for the same power.
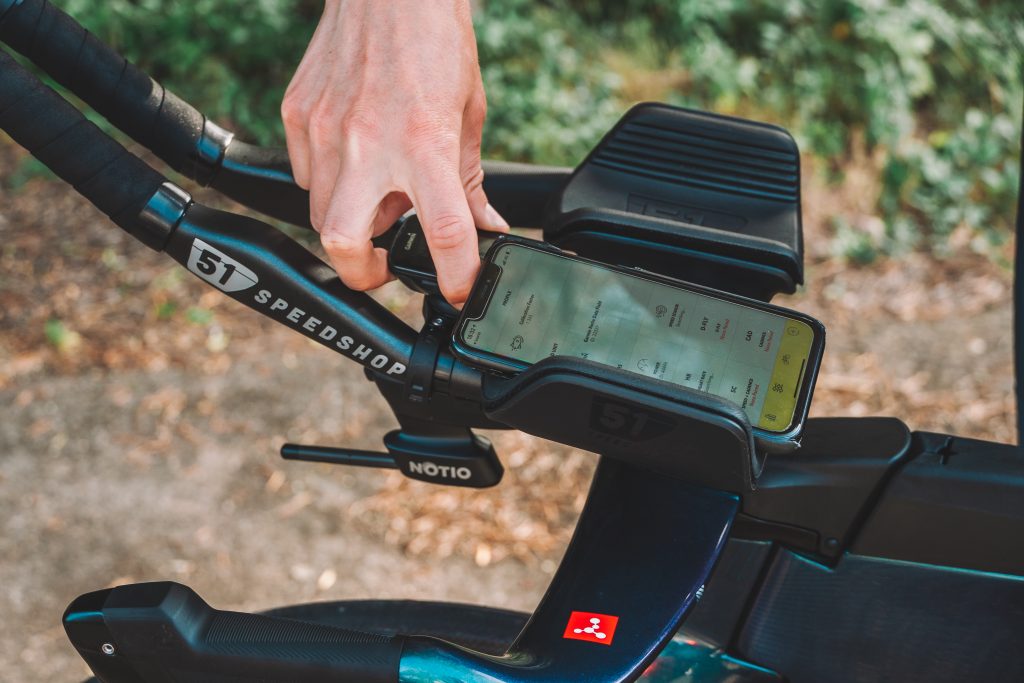
myWindsock calculates CdA for every ride that has power data. Subscribers can monitor their aerodynamics ride by ride, learn more.
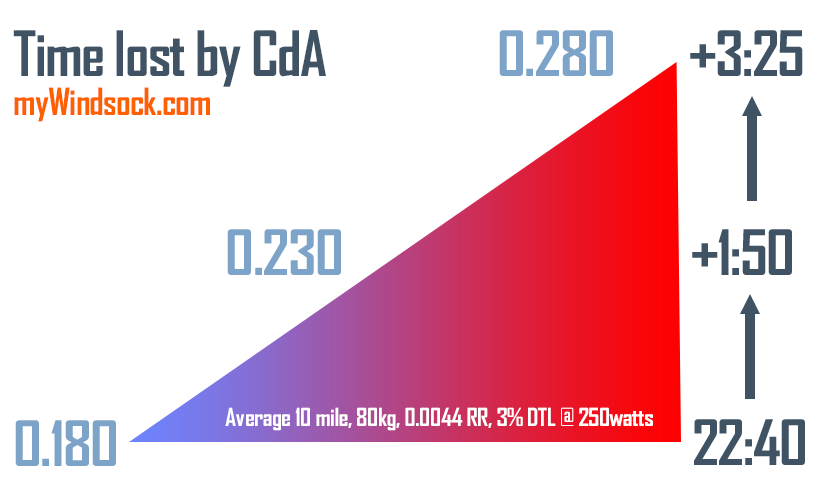
In February, CdA is 7.5% higher than in July where the average CdA was 0.340, compared to 0.366 in Winter. The difference at an average speed of 30.2kmh is around 10 Watts.
Why? We don’t dress quite as minimally as we do in the Summer. Short sleave jerseys are replaced with rain and wind repellent jackets. Lights, mudguards and less aerodynamic bike frames also contribute to the reduction in aerodynamic efficiency.
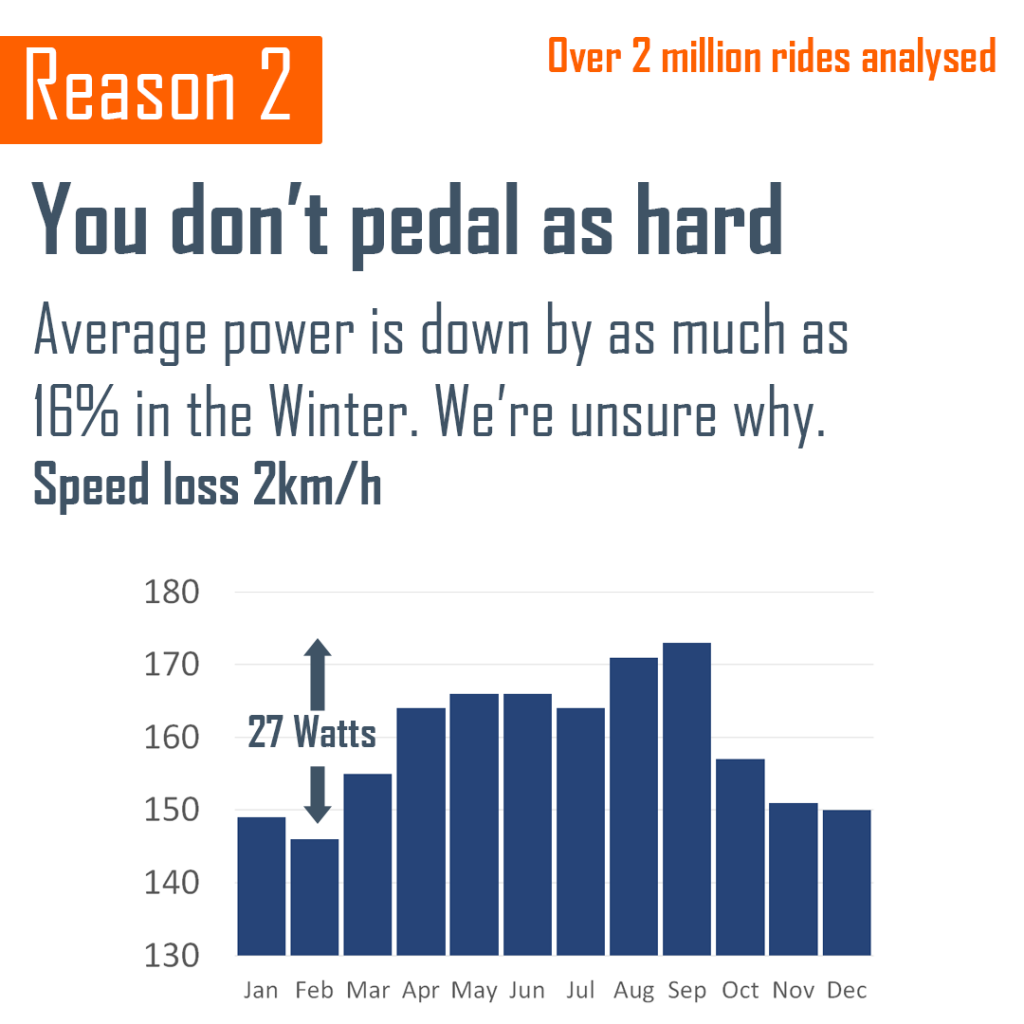
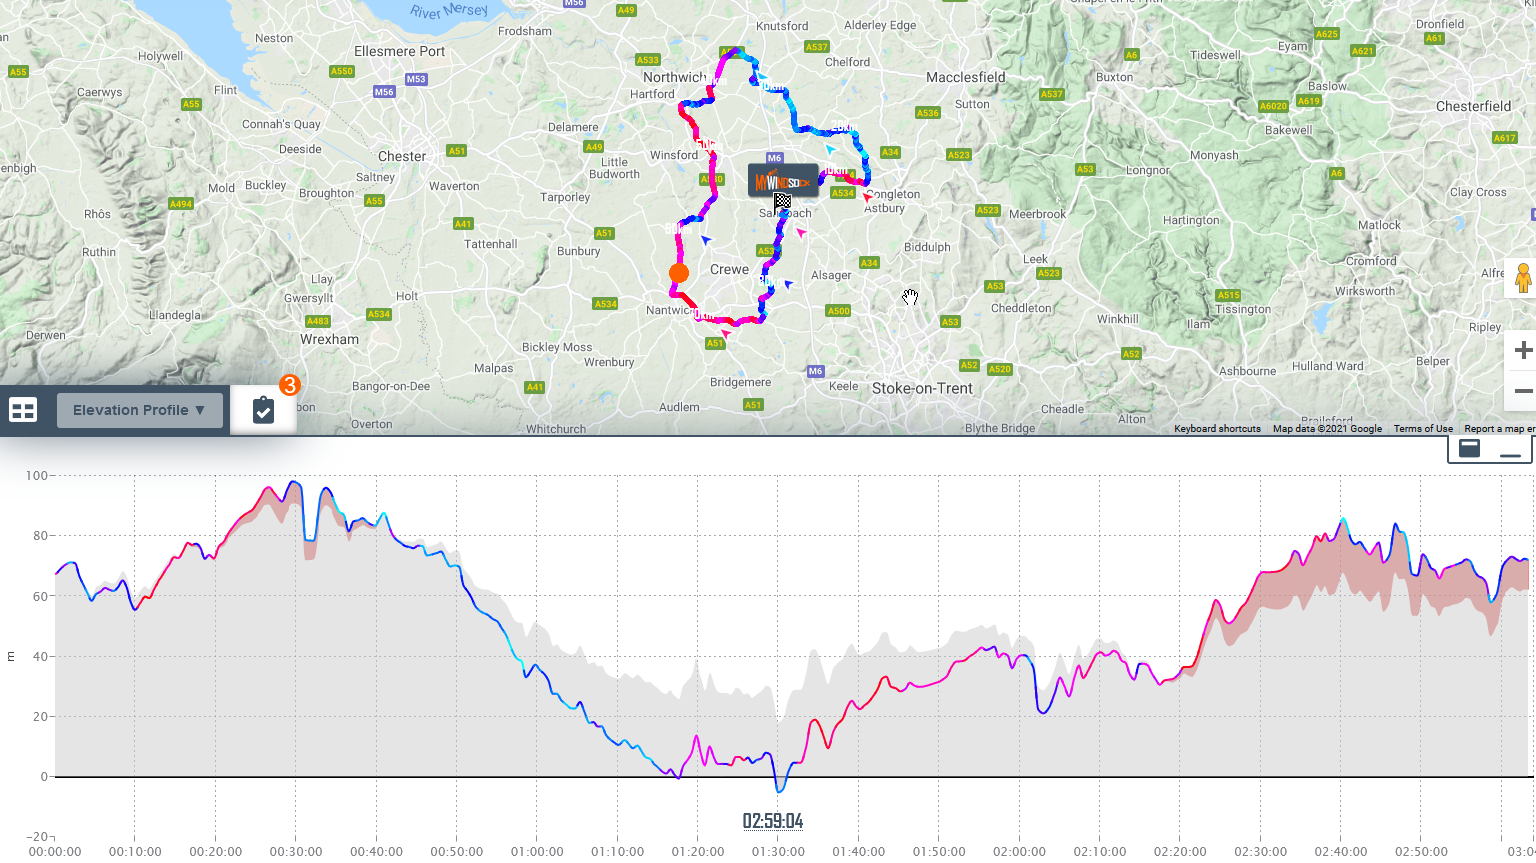
Reason 2, cyclists in Winter don’t pedal as hard. We expected this, however we are suprised at by how much. Riders are averaging 173 Watts in September. By February we are down to 146 Watts. On our Instagram page @mywindsock we’ve had so speculation as to why this is.
@itsjakevita
“Most cyclists that train only do Z1/2 rides all Winter and the higher FTP stuff in Spring/Summer.”
@ade_fox71
“Wet slippy roads, cold temperatures never good for fast riding. “
@fazzasphotos
“Keep some spare energy to get home as you don’t want to be on your last legs and breakdown at 2 degrees. Plus it’s mainly endurance, efforts are done on Zwift.”
The myWindsock population of athletes tend to be actively racing, this may also account for the difference in power. During Peak racing season1 to 2 rides a week are likely at full race pace during the Summer months.
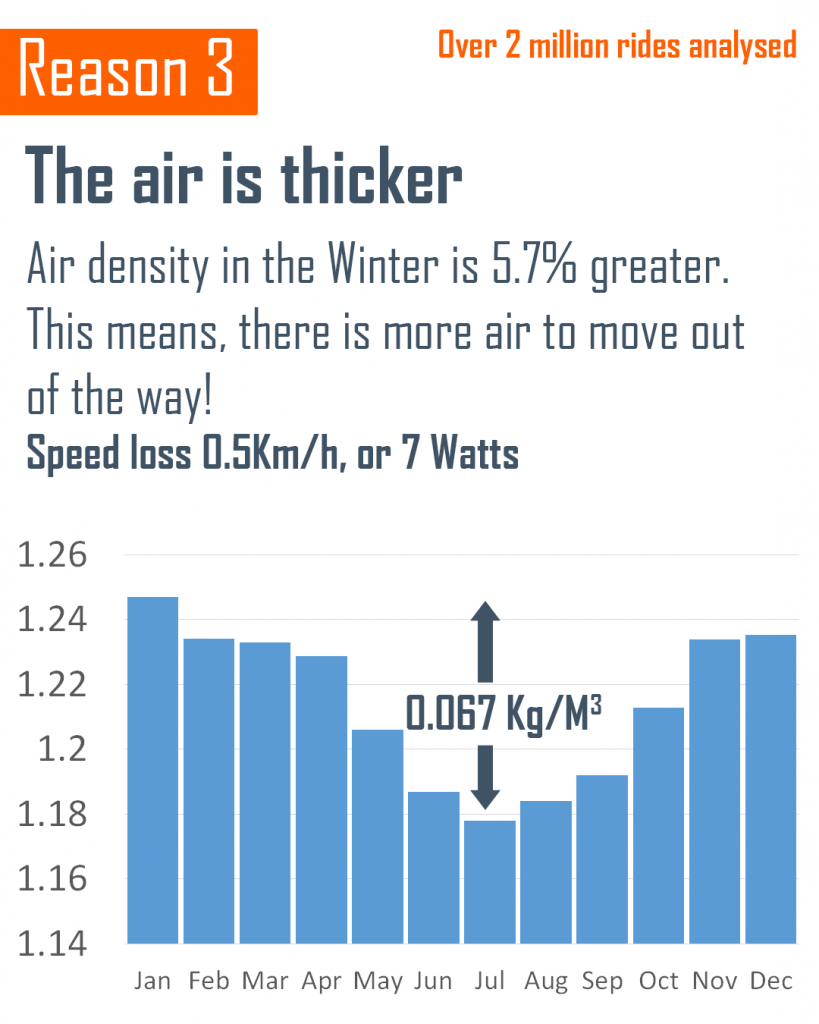
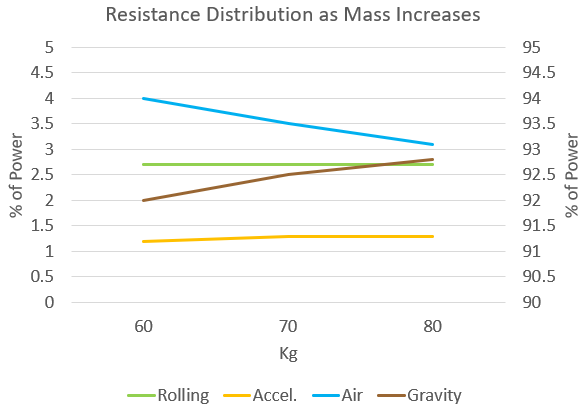
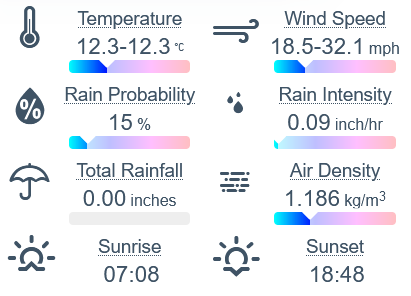
A very typical myWindsock weather stat here. Air Density becomes greater as the temperature decrease. Meaning, in the Winter, there is literally more air to move out of the way when riding along. The air density between Summer and Winter can cost as much as 7 Watts, or 0.5kmh off the average speed.
Conclusion
If your speed is lower in the Winter, you’re in good company. You now know it’s a combination of your clothing, a natural change of pace and the colder air holding you back. For safety, it’s probably not a bad thing our speeds are a little bit lower. Carrying a little less speed into potentially slippy corners is not a bad thing. It also makes Summer special. Remember ‘Winter miles mean Summer smiles’.
Would you like to discover more about your own rides? It’s easy to discover your CdA and more about the weather conditions you ride in. Start by signing up to myWindsock and connecting your Strava account for free.