Before our Tuesday evening club 10 I always look up our time trial’s forecast. WIth some experimentation there may be some extra speed available. At the very least knowing what to expect when out on the road is always useful. It’s super easy to do, you can find yours on the UK Time Trials Club Events page. This is where we have listed all the UK’s evening club time trials ready with forecasts.
This week’s forecast
The feature for this week’s club 10, on our JC/27 course is a moderate crosswind. To get the best data for the course I need to update my Virtual Rider with my latest performance data. To do this, I will use the Suggest Power Settings button and Select Best Effort [Learn more about Suggest Power Settings].
From my last time trial (Post race analysis: M&DLCA J2/3) I discovered my CdA has improved to 0.202 so I’ve entered that in the Aerodynamics of my Virtual Rider [Learn more about Virtual Rider Settings].
This gives my Virtual Athlete a time of 21:14. Whilst the time is interesting to have as a goal for the race, it is more about simulating the race for better data insight.
How will the ride feel?
The first graph too look at is the ‘Feels Like’ Elevation Profile chart. This is how the Wind + Gradient combined will feel. [Learn more about Feels Like Elevation].

A crosswind will often cause Feels Like Elevation to increase across the route, as in it’ll feel harder than a windless day. This is because air moving across you, even if it is not directly head on, still increases the air flow over you and resistance. So this is the case tomorrow, the day will Feel a little headwindy each way. The good thing is that the angle and speed of the wind for the time trial creates just a small increase in Feels Like Elevation across the ride.
Splitting Out from Back
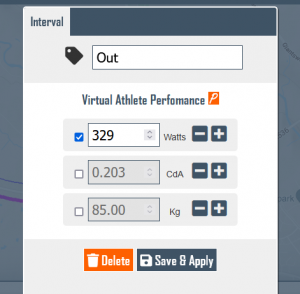
I want to see how a 10 Watt difference between the Out and Back will change the Virtual Athlete’s time. To do this I create an Interval for both the Out and Back portions of the ride [see how to Create Intervals].
Next I customise the Out interval with a 5 Watt increase and reduce the Back interval by 5 Watts. Now let’s see how the reversing the power output to higher Back than Out, changes the time prediction. There is just 3 seconds difference between the two stratgies, not a significant change. However I will ensure I am well warmed up so that I have my top end power ready from the start.
One last experiment…
I’m always tempted to sprint out the saddle in the final minute of this course. It’s up hill and begs me each time to leap out of the saddle. But the speeds are high, still averaging over 25mph. There is however a 50 watt difference between my out of saddle finish and my seated sprint for the line.
So let’s do a little bit of modelling. I’ve entered my aero finish params as below.
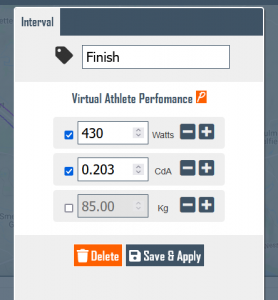
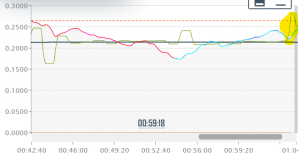
But now I need to modify this Interval for an out of the saddle effort. But was is my out of saddle CdA. Luckily I did succomb to the urge to leave my aero position in a previous TT. So I have a Live CdA line to give me some guidance. This puts me at around 0.280. Not too bad but I am still leaned forward and attempting to maintain some aeroness.
So let’s put those numbers in 480 Watts with a CdA of 0.280. The result…
 Interestingly the 50 extra Watts merely compensates for the loss of aero. So tomorrow I’ll just go with what feels natural, knowing there’s nothing to be gained or lost there on this occasion.
Out of curriosity let’s move the forecast forward to later in the week to see what a 10mph headwind rather than the crosswind would do to the same experiment. This time a slightly different result with a 1.2 second benefit to staying in the less powerful but more aerodynamic position.
How will my average speed develop during the ride?
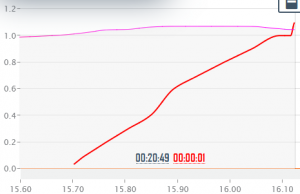
The predicted time indicates an average speed of 46kmh. Now if I went straight from the start expecting to see that number on my bike computer I’d be burying myself pretty deep. This is why studying the Rolling Average Speed Graph is so useful. We want to know how we are doing against the plan. I usually check at the very least my expected average by the turn. [Learn more about the Rolling Average Speed graph]
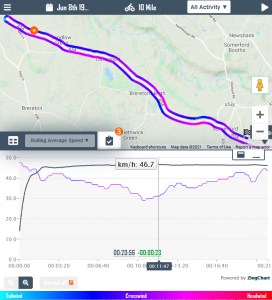
There isn’t a significant drop from the turn to the finish if all goes to plan, just 0.5kmh. So fingers crossed it’s a case of get to the turn an hold on.
To start analysing your club’s evening time trial, find it on the UK Time Trials Club Events page.


 UK Time Trial Events