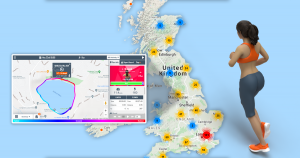
Crosswindy JC/27 : Club Time Trial Prep

Before our Tuesday evening club 10 I always look up our time trial’s forecast. WIth some experimentation there may be some extra speed available. At the very least knowing what to expect when out on the road is always useful. It’s super easy to do, you can find yours on the UK Time Trials Club Events page. This is where we have listed all the UK’s evening club time trials ready with forecasts.

This week’s forecast

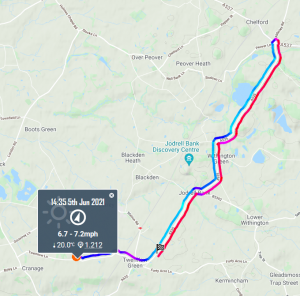
The feature for this week’s club 10, on our JC/27 course is a moderate crosswind. To get the best data for the course I need to update my Virtual Rider with my latest performance data. To do this, I will use the Suggest Power Settings button and Select Best Effort [Learn more about Suggest Power Settings].

From my last time trial (Post race analysis: M&DLCA J2/3) I discovered my CdA has improved to 0.202 so I’ve entered that in the Aerodynamics of my Virtual Rider [Learn more about Virtual Rider Settings].

This gives my Virtual Athlete a time of 21:14. Whilst the time is interesting to have as a goal for the race, it is more about simulating the race for better data insight.

How will the ride feel?

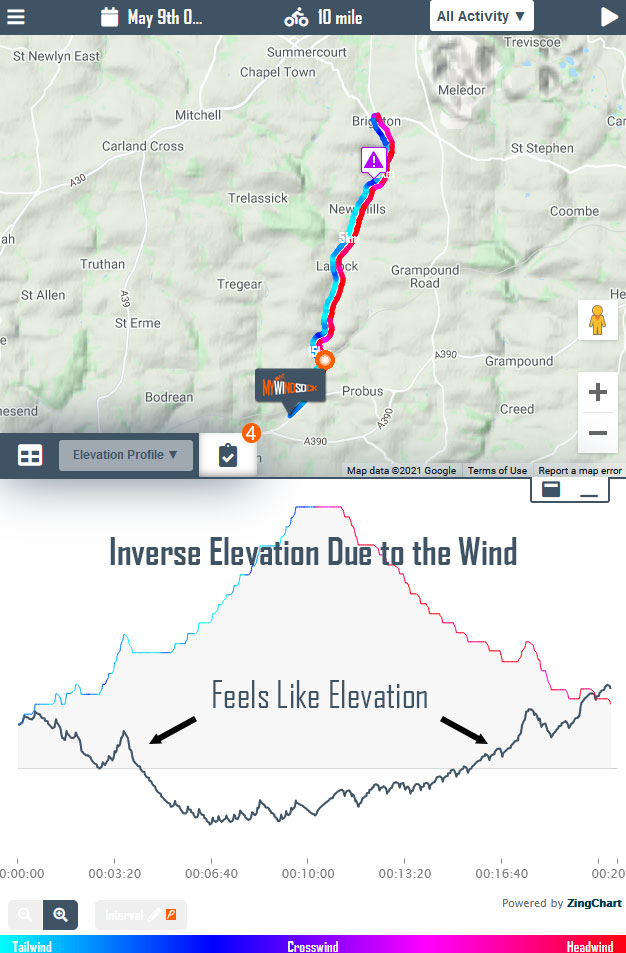
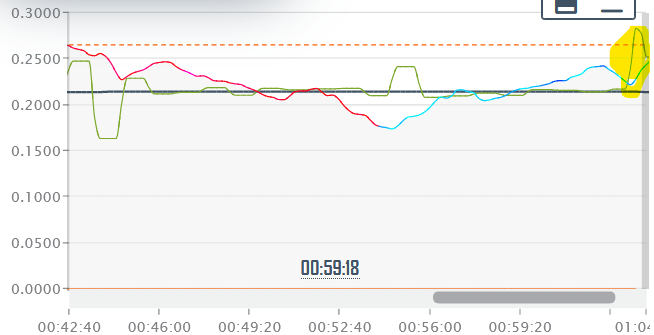
The first graph too look at is the ‘Feels Like’ Elevation Profile chart. This is how the Wind + Gradient combined will feel. [Learn more about Feels Like Elevation].

Screenshot 2021-06-07 173336
A crosswind will often cause Feels Like Elevation to increase across the route, as in it’ll feel harder than a windless day. This is because air moving across you, even if it is not directly head on, still increases the air flow over you and resistance. So this is the case tomorrow, the day will Feel a little headwindy each way. The good thing is that the angle and speed of the wind for the time trial creates just a small increase in Feels Like Elevation across the ride.

Splitting Out from Back

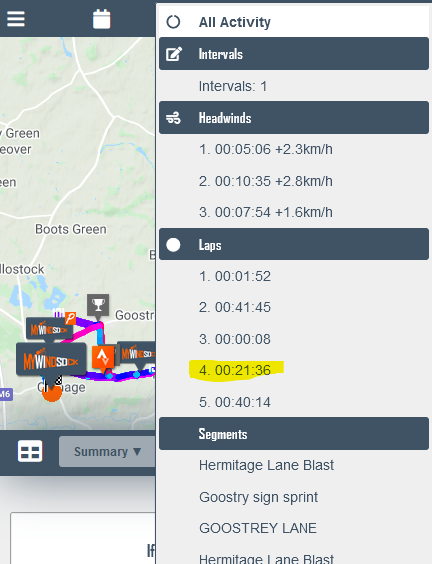
I want to see how a 10 Watt difference between the Out and Back will change the Virtual Athlete’s time. To do this I create an Interval for both the Out and Back portions of the ride [see how to Create Intervals].

Screenshot 2021-06-07 195153

Next I customise the Out interval with a 5 Watt increase and reduce the Back interval by 5 Watts. Now let’s see how the reversing the power output to higher Back than Out, changes the time prediction. There is just 3 seconds difference between the two stratgies, not a significant change. However I will ensure I am well warmed up so that I have my top end power ready from the start.

One last experiment…

I’m always tempted to sprint out the saddle in the final minute of this course. It’s up hill and begs me each time to leap out of the saddle. But the speeds are high, still averaging over 25mph. There is however a 50 watt difference between my out of saddle finish and my seated sprint for the line.

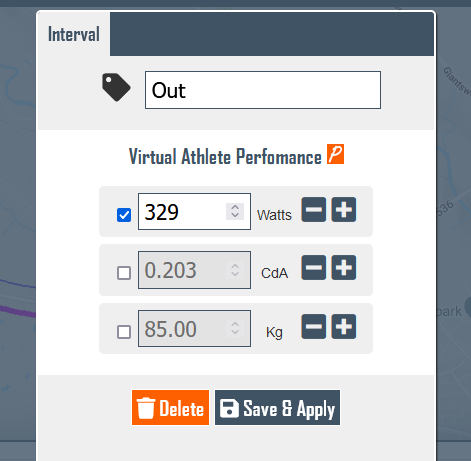
So let’s do a little bit of modelling. I’ve entered my aero finish params as  below.

Screenshot 2021-06-07 222557
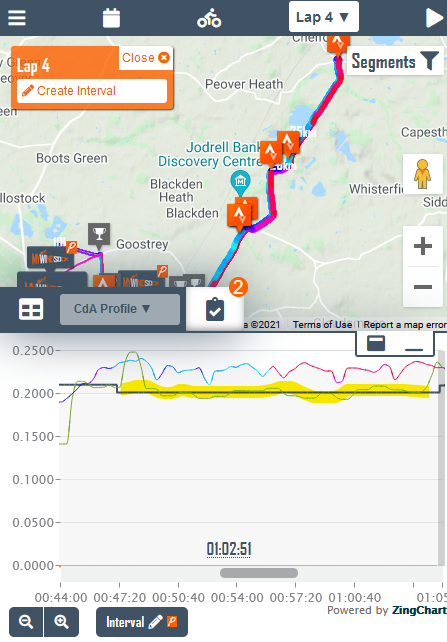
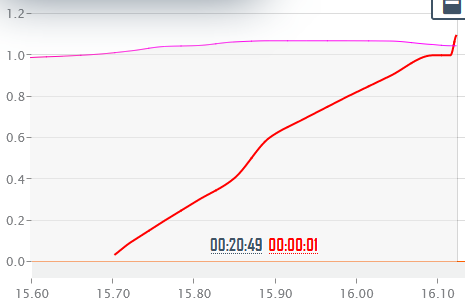
But now I need to modify this Interval for an out of the saddle effort. But was is my out of saddle CdA. Luckily I did succomb to the urge to leave my aero position in a previous TT. So I have a Live CdA line to give me some guidance. This puts me at around 0.280. Not too bad but I am still leaned forward and attempting to maintain some aeroness.

Screenshot 2021-06-07 223121
Highlighted finish Live CdA

So let’s put those numbers in 480 Watts with a CdA of 0.280. The result…

Screenshot 2021-06-07 223818Interestingly the 50 extra Watts merely compensates for the loss of aero. So tomorrow I’ll just go with what feels natural, knowing there’s nothing to be gained or lost there on this occasion.

Out of curriosity let’s move the forecast forward to later in the week to see what a 10mph headwind rather than the crosswind would do to the same experiment. This time a slightly different result with a 1.2 second benefit to staying in the less powerful but more aerodynamic position.

Last change delta chart shows the time lost.

How will my average speed develop during the ride?

The predicted time indicates an average speed of 46kmh. Now if I went straight from the start expecting to see that number on my bike computer I’d be burying myself pretty deep. This is why studying the Rolling Average Speed Graph is so useful. We want to know how we are doing against the plan. I usually check at the very least my expected average by the turn.  [Learn more about the Rolling Average Speed graph]

Screenshot 2021-06-07 180159
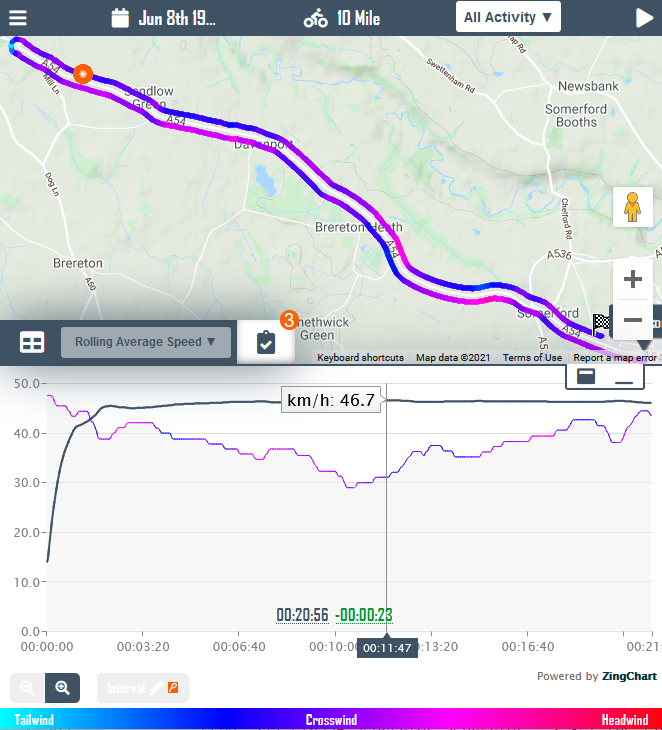
There isn’t a significant drop from the turn to the finish if all goes to plan, just 0.5kmh. So fingers crossed it’s a case of get to the turn an hold on.

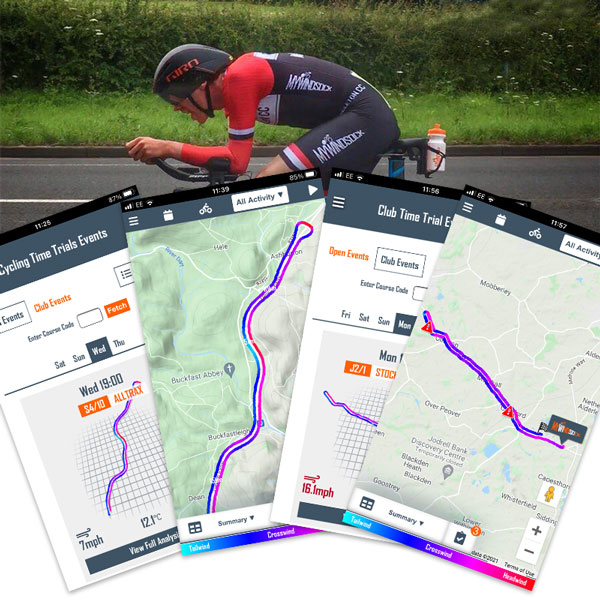
To start analysing your club’s evening time trial, find it on the UK Time Trials Club Events page.

Post race analysis: M&DLCA J2/3

Today’s race was the M&DLCA Invitational. The weather can be summed up simply as HOT! This did mean however the air density would be at least a bit lower than the cooler evening club time trials I’ve been racing. The J2/3 is not known to be a quick course, with the finish 14 metres higher than the start. However, with a South Westerly wind and an Easterly finish, just as we had today, it can offset some of the positive elevation gain.

Screenshot 2021-06-05 184259

mick-h05-06-21-02

Aero Check, what was my CdA?

As usual post race, the first thing I look at is my CdA. I left my Garmin running from the start of my warm up, which was actually mostly trying to keep cool, so I need to select the race from the Activity Navigator [Learn how to use the Activity Navigator].

Screenshot 2021-06-05 180207

Once I’ve selected my race lap or segment, my summary stats including CdA are recalculated. But the average CdA number can sometimes not give the full picture so it’s always worth viewing the CdA graph. [Learn more about finding a race CdA]

Screenshot 2021-06-05 181544

As you can see, highlited line has a small step down. This is usual with an out and back course as the loop that controls the CdA line starts reading opposite on the road to where the ride finishes to complete the loop. So we ignore that first bit of the line. The line reveals I had an average CdA of 0.202.

Since starting back racing my CdA has been much higher hovering around 0.215-0.220. So I am happy to see it going in the right direction with a small saddle tweak and a helmet change.

Parkrun weather and analysis

We’re excited to announce that we have loaded all of the UK’s Parkruns into myWindsock ready for the return of Parkrun in June.

Find the closest Parkruns to you, discover the weather forecast and view course analysis in preparation for that PB run!

Go to to the Parkrun Map

map-fb

‘Feels Like’ Elevation for Time Trialists

‘Feels like’ Elevation allows you to mentally prepare for the event you have coming up. A huge part of racing is being prepared and knowing the course you are going to be riding.

With this graph and metric you will get a perspective on the effect the wind will have. This will give you a better and clearer image on how to pace yourself during a race so you don’t burn yourself out. Our graph allows you to visualise the wind, like you would the summit of a hill. Have a look at this event The S6/10 Tri-Logic Event time trial.

inverse-tt-feels-like

This course is up hill on the way out to the turn and downhill on the return. However with the added tailwind on the up hill and headwind on the downhill, on this particular day, the course would feel flipped. The uphill with the assisted tailwind would require less effort and power and would actually feel like you were going downhill.

The headwind is very harsh and strong on this particular day and would make the downhill would ‘Feel Like’ an uphill effort. Find out more about ‘Feels Like’ Elevation graph and metrics.

We have all the UK Time Trials ready for forecasting each week. Discover the ‘Feels Like’ elevation for your next race in our Time Trial Events section.

UK Open and Club Time Trial Events

We have loaded all of the UK’s Open time trials ready for forecasting each week. After some hard work by club organisers this also now includes evening club time trials. Just click the “Club Events” tab and you’ll get your local club 10 forecast too.

View Open Events | View Club Events

events-square-600

Ben: My 4th hottest ride

My 4th hottest ride on myWindsock Weather Trends was in preparation for the then upcoming national 12 hour championship. I was out in the heat for 4hr 15min, covering a bit over 161km (100 miles). The route was particularly interesting as I had decided to take in as many of the local time trial courses as possible.

My 4th Hottest Ride in Weather Trends

I remember the heat well. To begin with, I was hot, but whilst moving I was staying pretty cool. Unfortunately this didn’t last and the temperature reached boiling point half way through. A slow moving tractor deprived me of the fast flowing air, leaving behind the smouldering black tarmac. Almost 10 minutes baking behind the tractor I was released. Now cooked through no amount of air would revive me. I suffered on and finished exhausted, but a smile on my face.

Post ride face.
Post ride face.

Relive your rides with Weather Trends

Each ride has it’s own story. Weather Trends helps you to discover your standout rides. Find the windiest, wettest and toughest rides you’ve ridden. Start recording all of your rides with myWindsock Premium.

weather-trends

More Segment Windsocks

I love a good KOM hunt and I’ve been maxing out the 5 Segment Windsock limit recently, this is very frustrating. At our new location in Cumbria, there are so many amazing hills around to attack! The five Windsocks that we offer on Premium just isn’t enough.

So the 5 Windsock limit had to go!

Upgrade to myWindsock Premium to unlock your first 5 Windsocks. Learn more

How to get more Segment Windsocks

Your initial 5 Windsock limit can be increased from the Segment Windsock Page.

Add more Segment Windsock.

Simply choose from the three options:

  1. Add 5 £1.99/year
  2. Add 30 £4.99/year
  3. Add 100 £9.99/year

Add your extra Windsocks here Segment Windsock Page.

What Segment Windsocks are

Having the best conditions on a Segment is crucial for getting the KOM time. When you add a Windsock to a Strava Segment our physics engine gets to work scanning the forecasts. When a favourable forecast is found, we will let you know the best time to go.

20191027_112725979_iOS

How to Add a Segment Windsock

It’s easy to add Windsocks to Segments. You can do this two ways.

  • From any forecast or post ride analysis click on the segment icon  .  Then click the Windsock Bell checkbox.add-segment-windsock
  • Load up a Segment forecast click on the Menu Icon  Then Click “Segment Windsock”.20201119_172042000_iOS

Your initial 5 Windsock limit can be increased from the Segment Windsock Page.

100 miles in under 3 hours

We are delighted to hear Jonathan Schubert used our modelling and analysis in preparation for his record breaking sub 3 hour 100 miles ride.

The aero efficiency (CdA) Jonathan achieved is amazing. He talks about using effective CdA, the on the road CdA, in modelling the record attempt. This modelling would show that the sub 3hr was in his grasp.

Give the podcast a listen, it’s fascinating to hear about the planning and execution of such an incredible ride.
Cycling Time Trials Podcast: #148 Jonathan Schubert

Ben: My longest headwind this year.

I feel a bit guilty at nabbing this one from my Weather Trends, as I am sure this is also Caroline’s longest headwind too.

20201117_143347000_iOS

I asked Caroline if she had a bike and would she like to come for a bike ride. We’d done a lot of walking at this point so it seemed like a good alternative. She said ‘yes I have a bike’ so I thought perfect “let’s ride!” I rode over to meet her. When I arrived she was putting her helmet on. We went over to the garage to get her bike, out comes a mountain bike with knobbly tyres. Stood there in my full roadie kit I thought ‘ok this will be a difficult ride for one of us’.

Naturally I didn’t take my 23mm tyres off road.


20200608_122122880_iOS

Caroline smiled all the way. I have since learned this smile is purely from her dance training and hides her actual discomfort of riding a mountain bike, with a saddle far too low, for an hour and a quarter, into a headwind. Seeing her smile, I was blissfully unaware of her discomfort and I kept the pace high with no rest all the way.

It was only once we stopped at my house that the exhaustion became apparent. I realised how tough it had been. We took the bike back by car.

Fortunately the experience didn’t put Caroline off me or cycling.

Relive your rides with Weather Trends

Each ride has it’s own story. Weather Trends helps you to discover your standout rides. Find the windiest, wettest and toughest rides you’ve ridden. Start recording all of your rides with myWindsock Premium.

weather-trends