As I write this, 2023 is coming to an end. I’ve received my Spotify Wrapped, Strava year in sport and other such annual data reports from various apps and thought it was time to check out some annual myWindsock stats. These are some of our favourite charts to look at in the context of the year…
Air Pressure
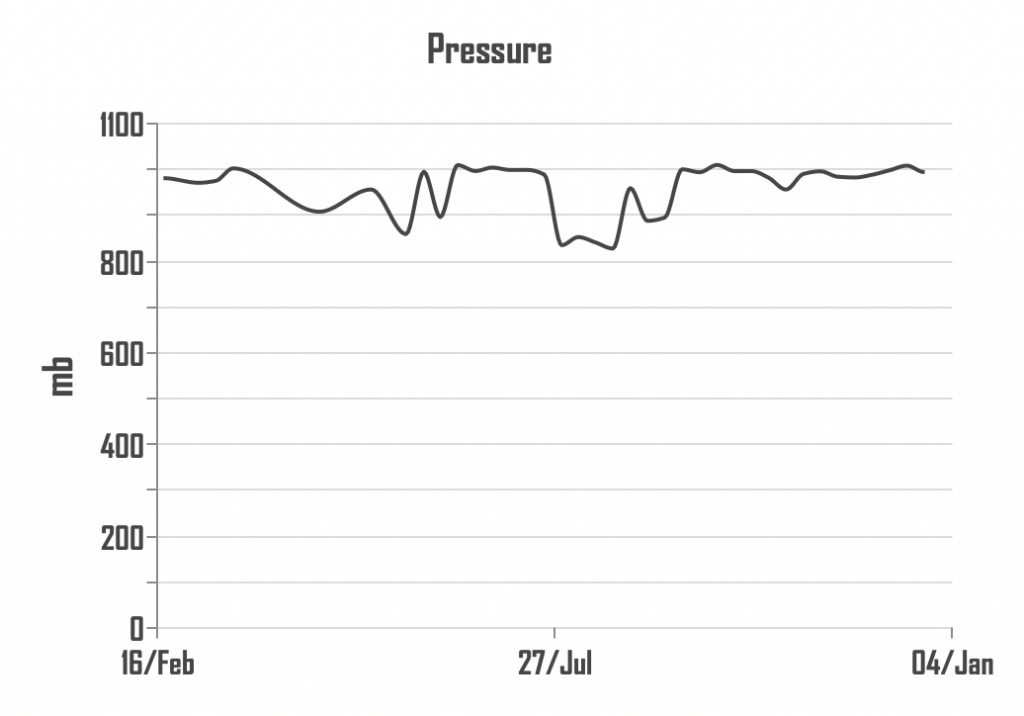
The average annual pressure plot is really interesting, you can see where I’ve spent time up mountains (as the pressure drops at higher altitudes). Air pressure plays a crucial role in influencing cycling speed. Cyclists experience resistance from the air as they move forward, a phenomenon known as aerodynamic drag. Higher air pressure generally results in denser air, increasing the resistance cyclists face. This is why we see hour record attempts taking place at venues that are way above sea level.
How windy was 2023?
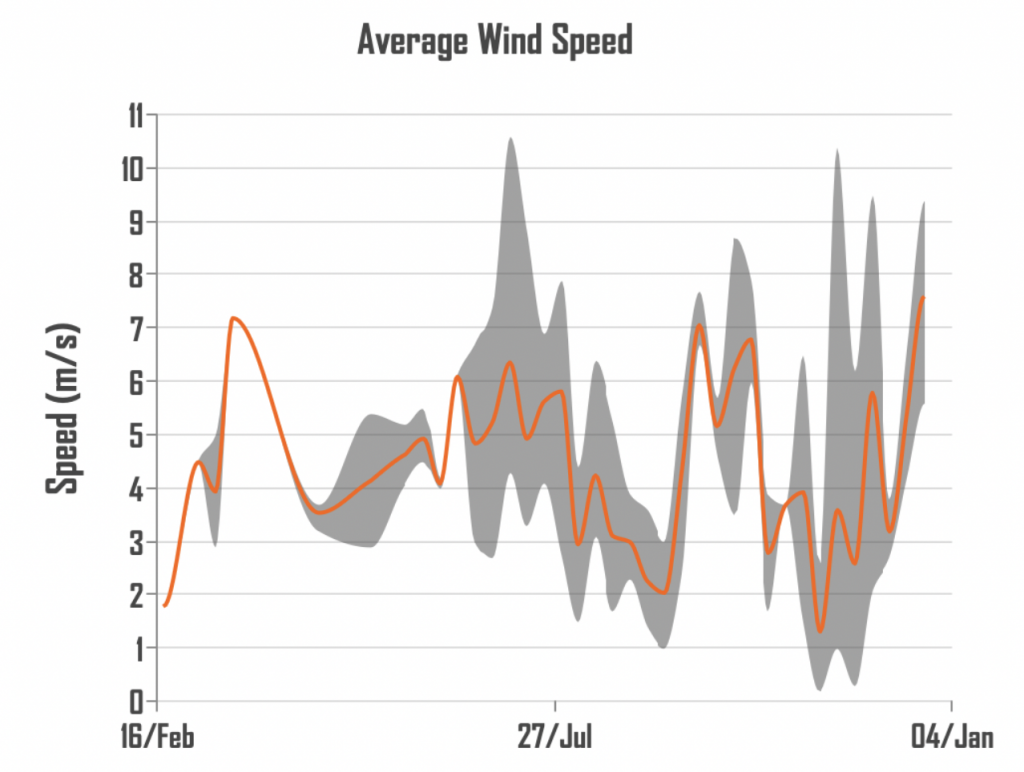
The wind speed plot shows the average wind speed on rides over the course of the year. In a shocking development, the winter tends to be windier than the summer but not by as much as you might think. There is a notable drop in the middle of summer though. We commonly see the best TTs being done in late July, August and September and this seems to also be the times when wind speed and pressure drops a bit.
Turning up the heat…
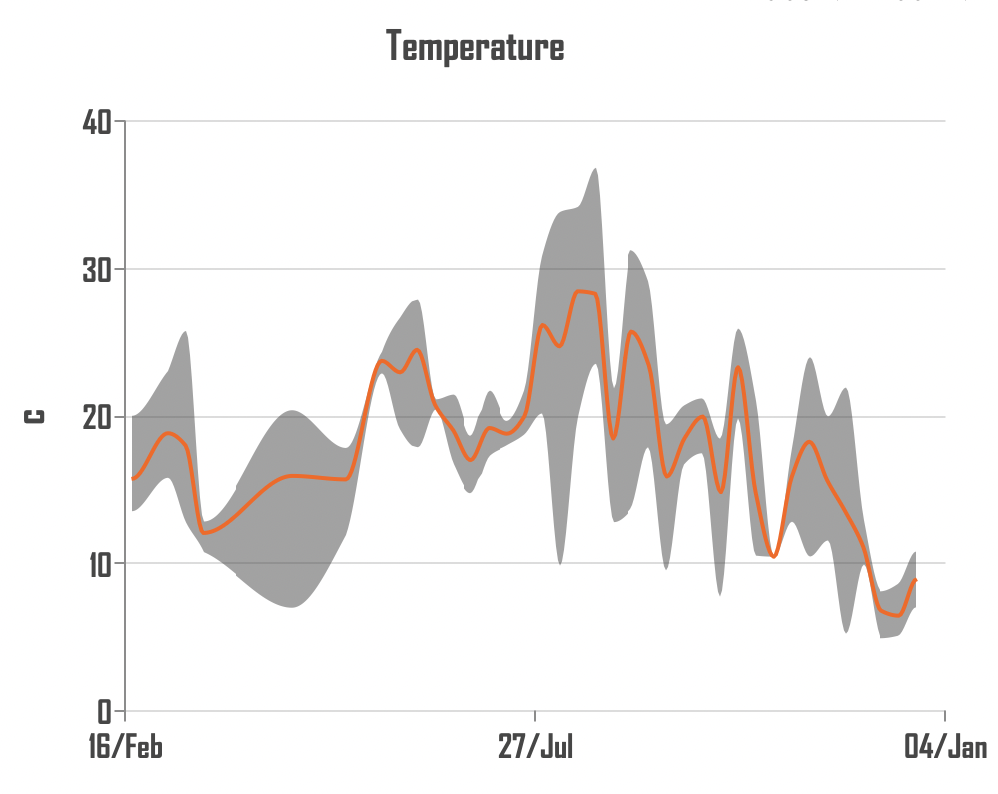
Personally, the heat gods were pretty kind to me in 2023. A combination of some cleverly timed travels (That’s me in Calpe in February hence the average temperature being very high). It wasn’t until December when my average ride temperature dropped below 10 degrees.
Rainfall
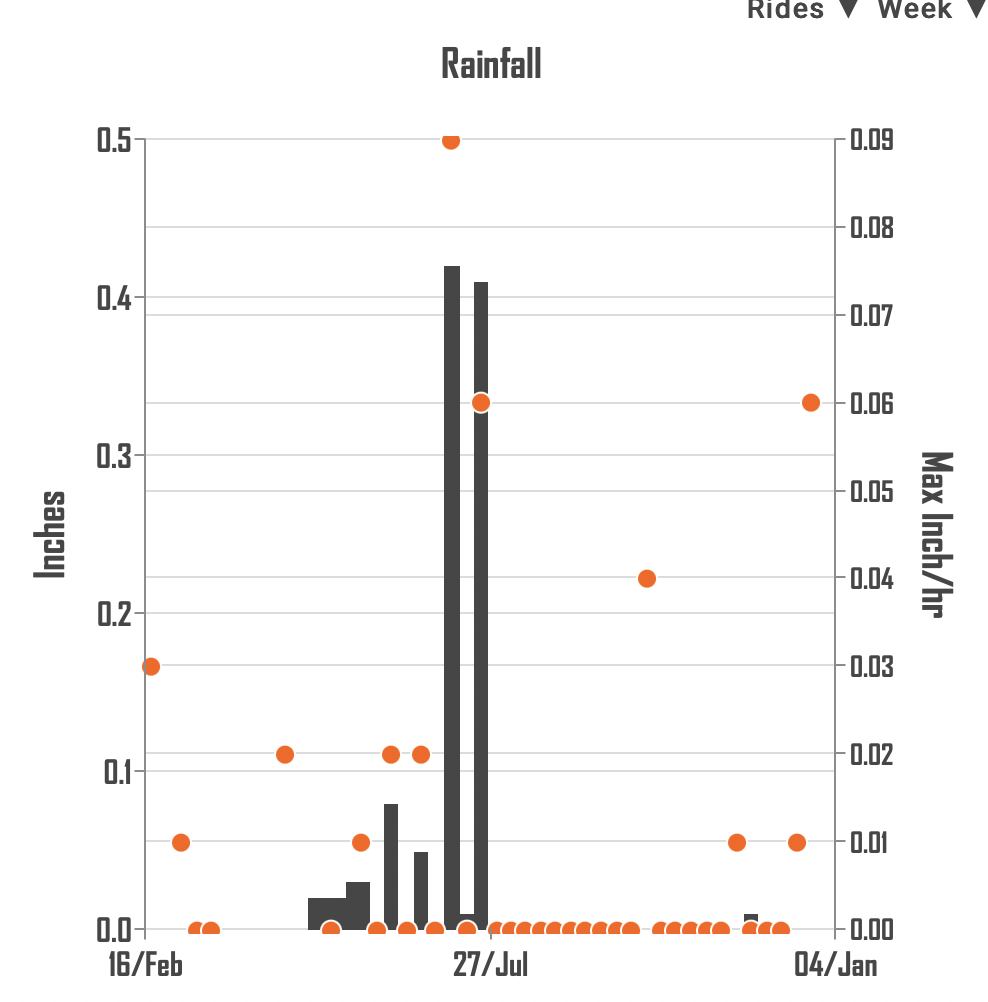
It’s fair to say I’m a fair weather cyclist as the rainfall plot will tell you. I’ve got wet on the bike on ten occasions (one of these orange dots was a brief moment of snow) out of around 550 hours on the bike. That said, it’s way easier to avoid the rain when you plan your rides with myWindsock…
In 2024, cyclists can maximise the benefits of myWindsock in two ways.
Firstly, by leveraging its advanced weather forecasting features, cyclists can plan rides with precision, taking into account real-time wind conditions to optimise routes and enhance performance.
Secondly, myWindsock’s community-driven data sharing fosters a collaborative environment where cyclists can exchange insights on local wind patterns, creating a dynamic network of information.
Ultimately, myWindsock becomes an indispensable tool for cyclists, offering strategic planning and community engagement to elevate your riding adventures in 2024.