How much faster is a Time Trial Bike?

We know time trials bikes are fast but how much difference do they make? We ran the numbers and found out for you.

The Experiment

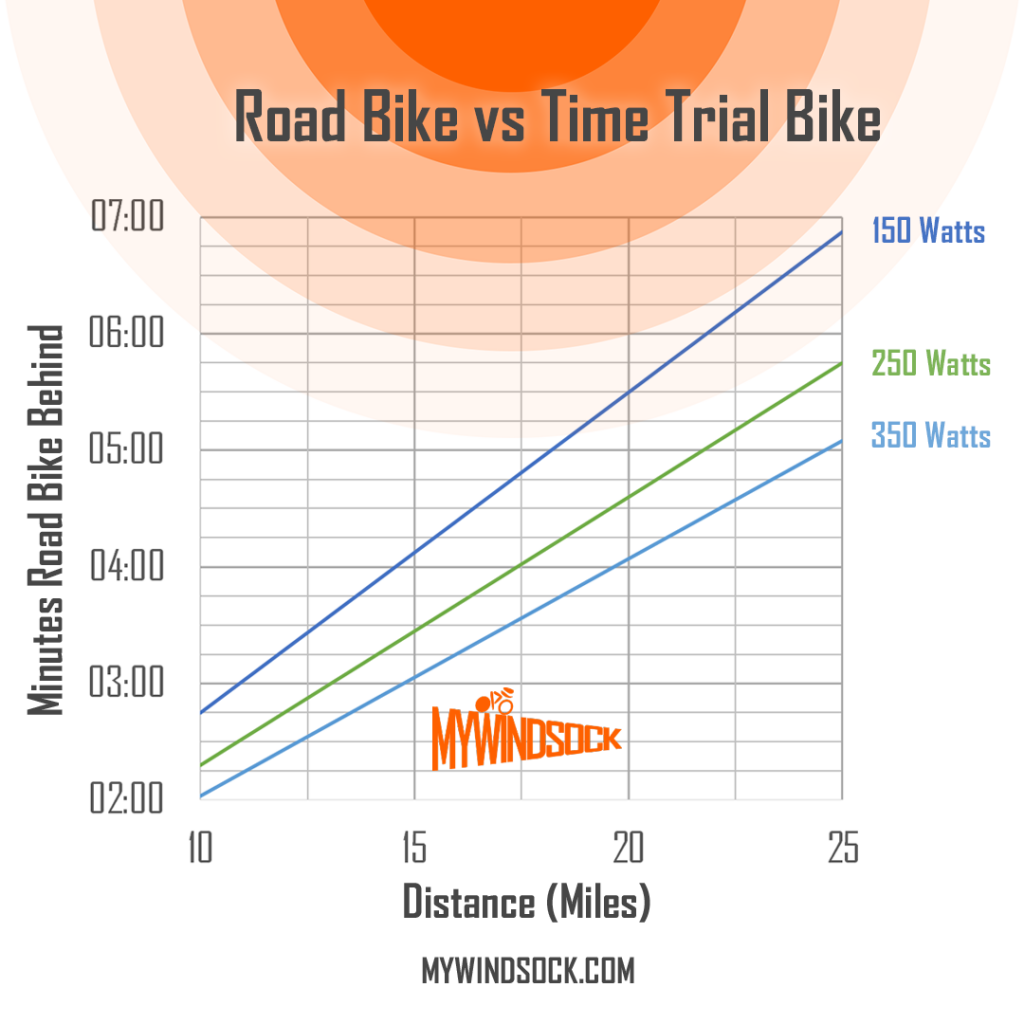
Using myWindsock’s cycling physics engine we raced two bikes. One a road bike and the other a time trial bike. We raced the three times at different power outputs, 150, 250 and 350 Watts. These are the sort of power numbers that might represent what a beginner, intermediate and advanced rider might do for a 25 mile time trial.

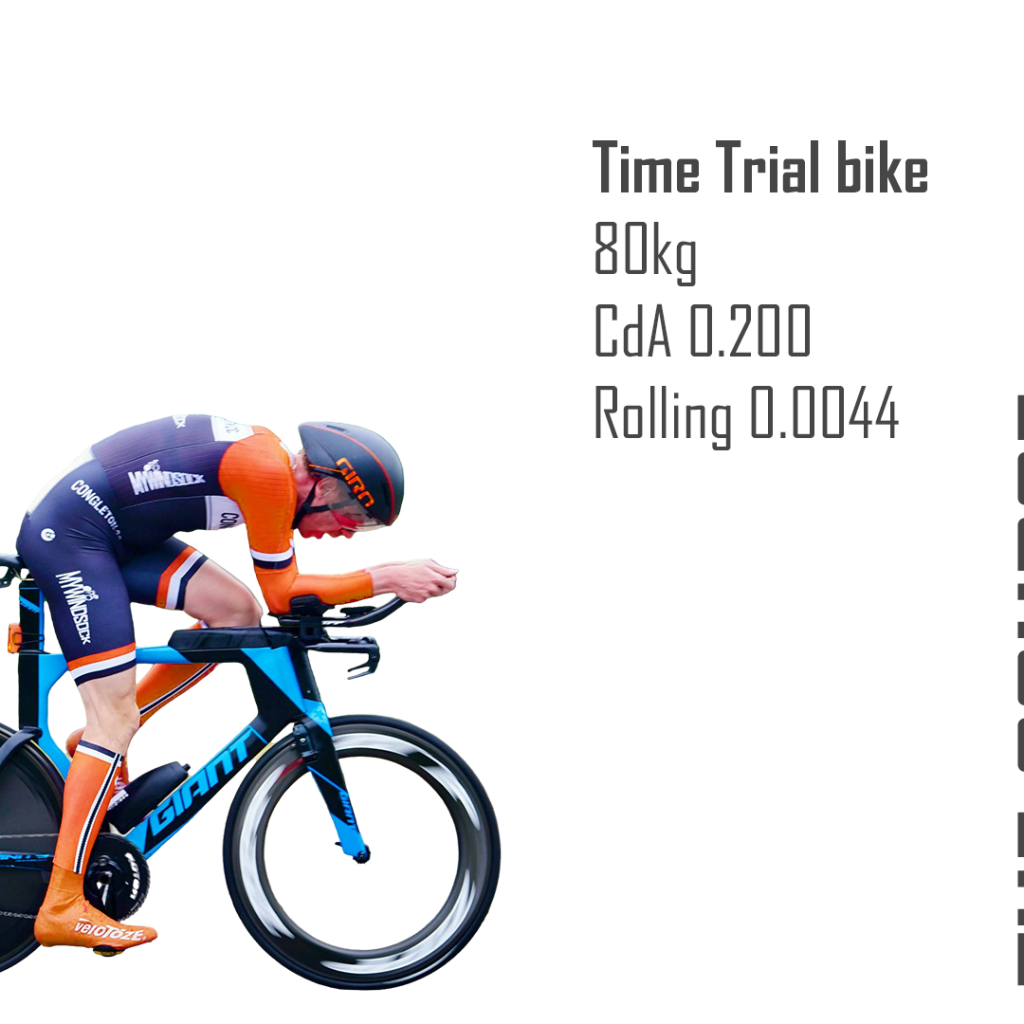
We have used a myWindsock forecast in order to see the impact of the time trial bike on the road. You’ll notice from the graphic below that we have kept the system mass and rolling resistance the same such that the difference is solely due to the time trial bike.
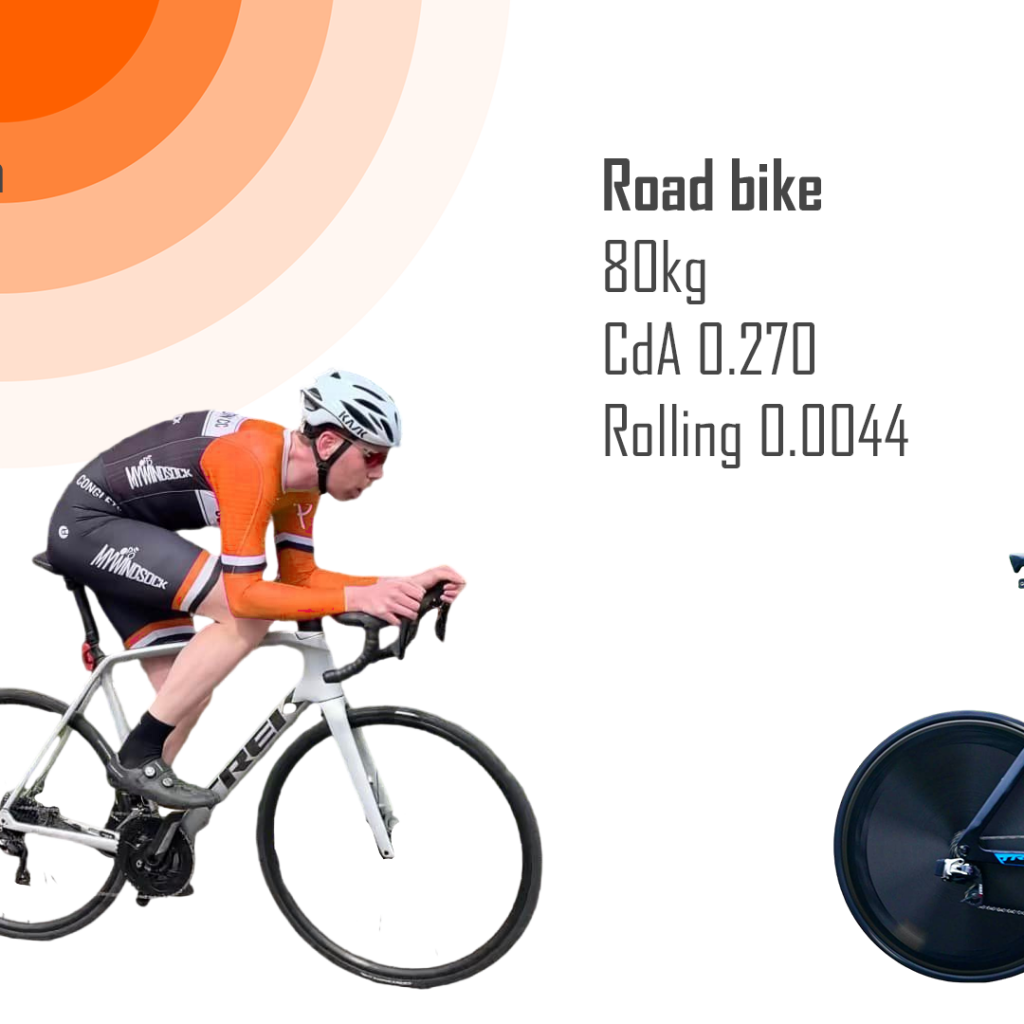
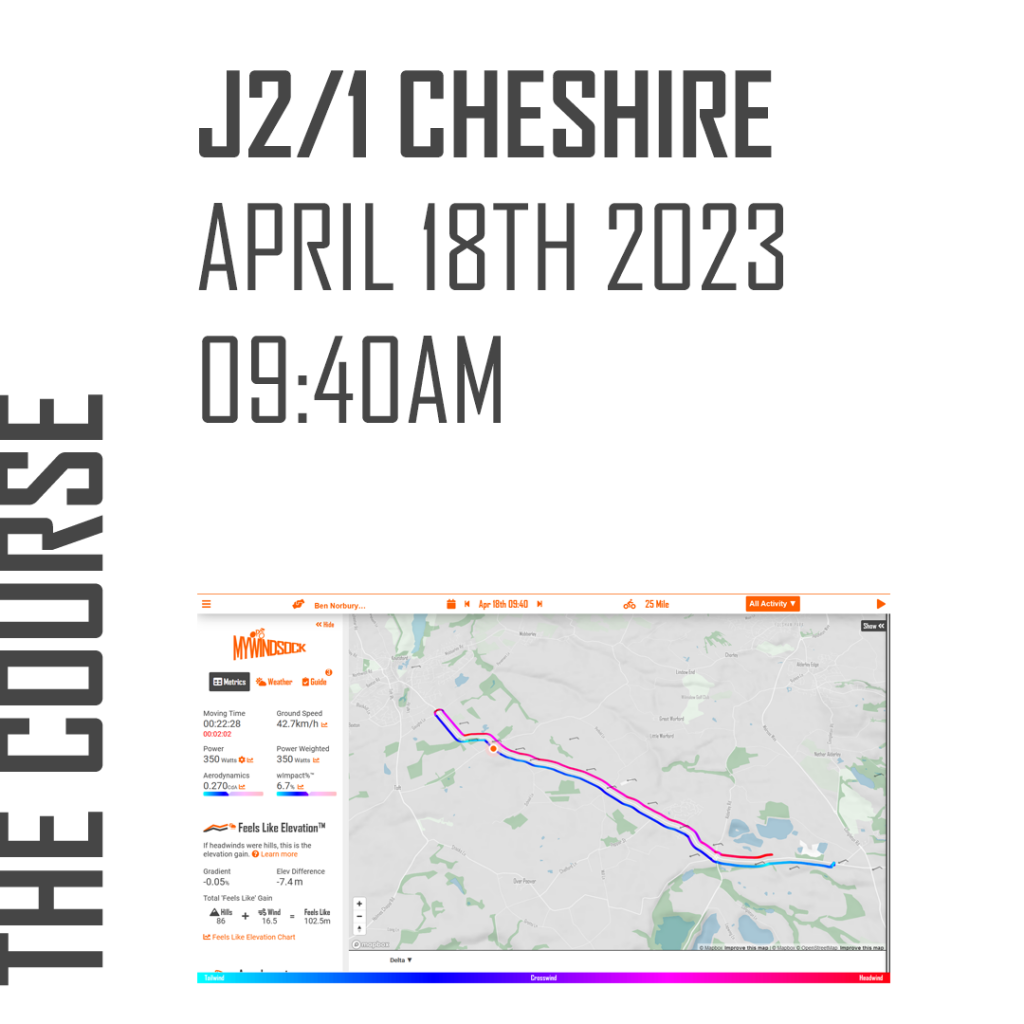
The course we chose was a typical UK 10 mile time trial course. You can view this course here. All Cycling Time Trials courses are available to view in myWindsock.
The Result

Below are the results of the test. On the left we have the time lost by the road bike and the distance travelled along the bottom.
Conclusion

As expected the time trial bike is significantly faster than the road bike. For a rider producing 150 Watts they will lose close to 7 minutes on a road bike. We often hear people saying “I’m not fast enough for a time trial bike”, however what is clear from the above graph is, the less power you have the more time you will lose choosing the less aerodynamic option. In terms of absolute time savings, a TT bike is better value for a slower rider!

Why is a time trial bike faster?

A time trial bike is designed to be faster than a traditional road bike, hence the price hike, in time trials for a few key reasons:

  1. Aerodynamics: Time trial bikes are designed with aerodynamics in mind. The frame, wheels, and components are shaped to reduce air resistance, allowing the rider to move through the air more efficiently. Much of this comes from the position the rider is able to hold due to the arm rests and aero-extensions. This position is not allowed in traditional bunch racing due to the chance of a crash as the brakes can’t be immediately reached.
  2. Geometry: Time trial bikes have a more aggressive geometry than traditional road bikes, with a steeper seat tube angle and longer top tube. This puts the rider in a more aerodynamic position than they’d be able to achieve on a road bike with clip on bars, reducing wind resistance even further.
  3. Integrated components: Time trial bikes often feature integrated components, such as handlebars and brake levers, which further reduce drag and streamline the bike’s profile. This can make them difficult to work on – often turning what would be a simple fix on a road bike into a complicated job for a mechanic in a bike shop.
  4. Wheel choice: Time trial bikes often use deeper section wheels, which are more aerodynamic than traditional road bike wheels. Wheels deeper than 90mm aren’t allowed under CTT’s (the UK’s governing body for time trials) road bike TT rules.

All of these factors combine to make time trial bikes faster than traditional road bikes in time trials. However, it’s important to note that time trial bikes are not necessarily faster in all situations. They are designed specifically for time trials, and may not be as comfortable or efficient for longer, more varied rides.

If you’re looking to get into time trials but are worried about not having the right equipment – Cycling Time Trials have introduced a road bike category at all their events! Make sure you’re prepared with myWindsock – perfect for planning and analysing your time trials.

How many Watts do you need to break 20 minutes for ten miles?

30 miles per hour is the holy grail of time trials. It’s the average speed required to break 20 minutes for a ten mile time trial and 50 minutes for a 25. These are marks held in high esteem by riders up and down the country, but how many watts do you need (or how aero do you need to be) in order to hit this mark?

A myWindsock experiment

If you head to the myWindsock app and play with the input variables on a forecast for a given course, you’re able to see the kind of power and cda values required to achieve a given time.

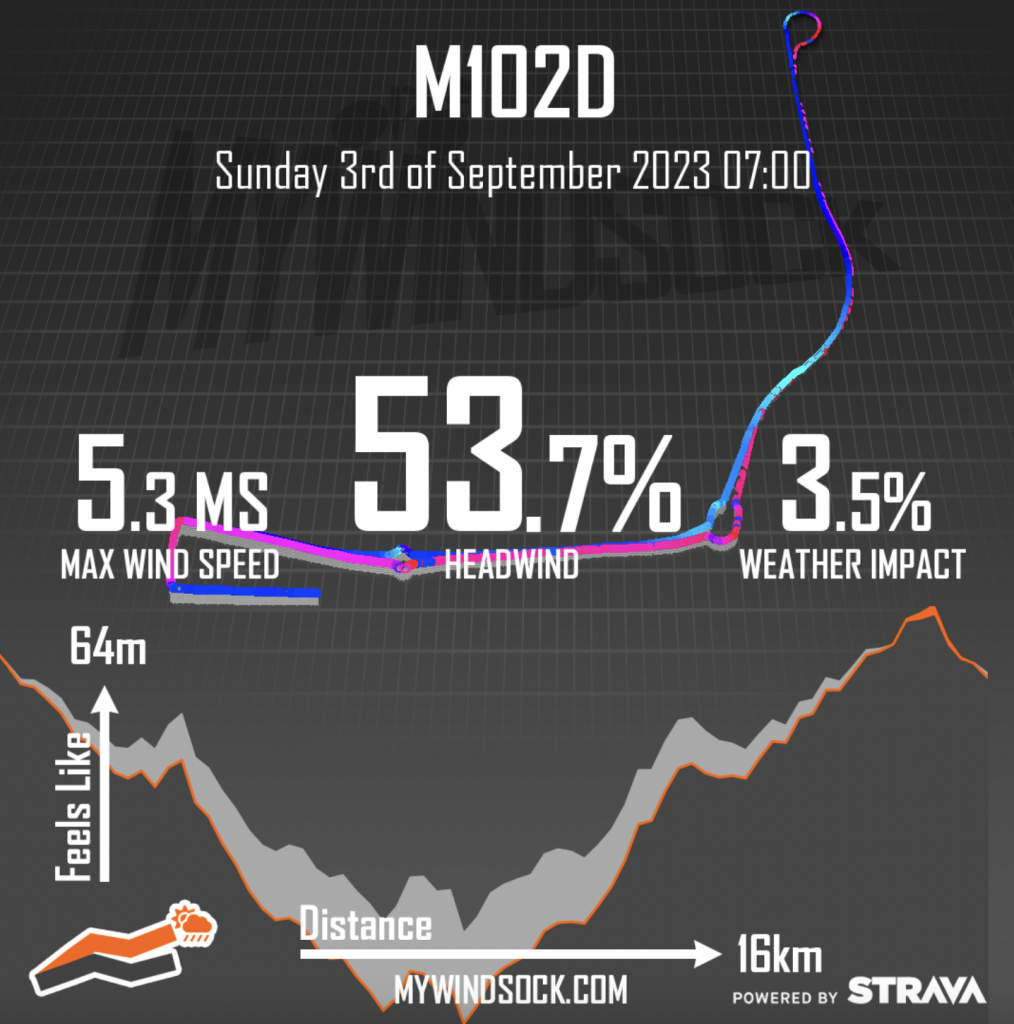
The course used in our forecast is the national 10 on 3rd September 2023 at 7:00am and you can see the forecast by clicking on the link. Of course, the forecast is likely to change between now and race day but these numbers should give you a rough idea of what’s required on that course if you’re planning to head there and crack 20 minutes.

Take a look at the course forecast by clicking here!

CdA vs Power – what do I need to go sub 20?


Time trial performance can be boiled down to two key numbers – your cda (how aero you are) and your power (how hard you’re going). Obviously each of these can further be broken down into constituent components but one simple fact remains true – you’ll go fast if you have a combination of good power and you are aerodynamic, this is news to nobody. There is a little bit of a trade off between aerodynamics and power – which you can read about here.

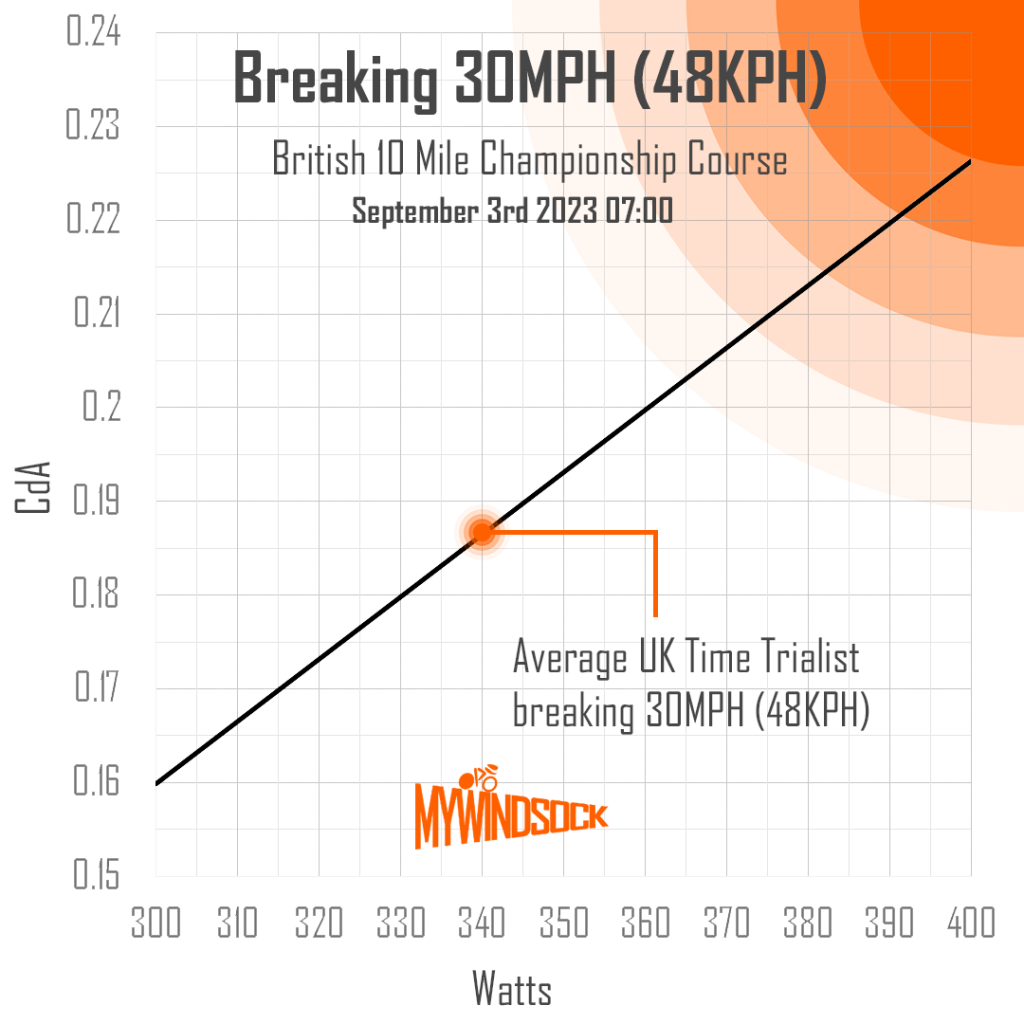
This image shows the combination of aerodynamics and power needed in order to break 20 minutes on the National 10 course this year. The average time trialist in the UK will break 30mph with a cda of just a little more than 0.185, a very low number!

There are a few key takeaways from this graph…

  • The average rider going under 20 minutes is doing 340W, this isn’t a huge amount of power and tells us that British riders are super aerodynamic.
  • If your cda is 0.2 (the general marker for ‘good’) then you’ll need 360W to break 20 minutes, again very strong but an achievable number for many riders in Britain.
  • At Remco Evenepoel’s reported cda, it would require 320W for him to ride at 30mph on this course, given that he’s capable of around 80W more than this over 20 minutes in the TT bars it works as a stark illustration of just how good world class time trialists are. 

How to work out your CdA and use myWindsock to plan your race

If you want to know your cda, you can carry out a field test using myWindsock. This can be done by the methods explained in this article.

Once you know your cda, you can head to the forecast here and work out how many watts it will take to achieve your target time. This course, I suspect, will crown a national champion that gets close to 18 minutes and there will be plenty of riders that ride under 19 here. For reference, a 19 minute clocking requires a rider to average around 400W with a cda of 0.18 – these numbers sound pretty crazy but there’s probably 15-20 guys that can hit these numbers in the UK.

You can take control of your race and remove uncertainty by signing up to myWindsock here.

How does your CdA compare?

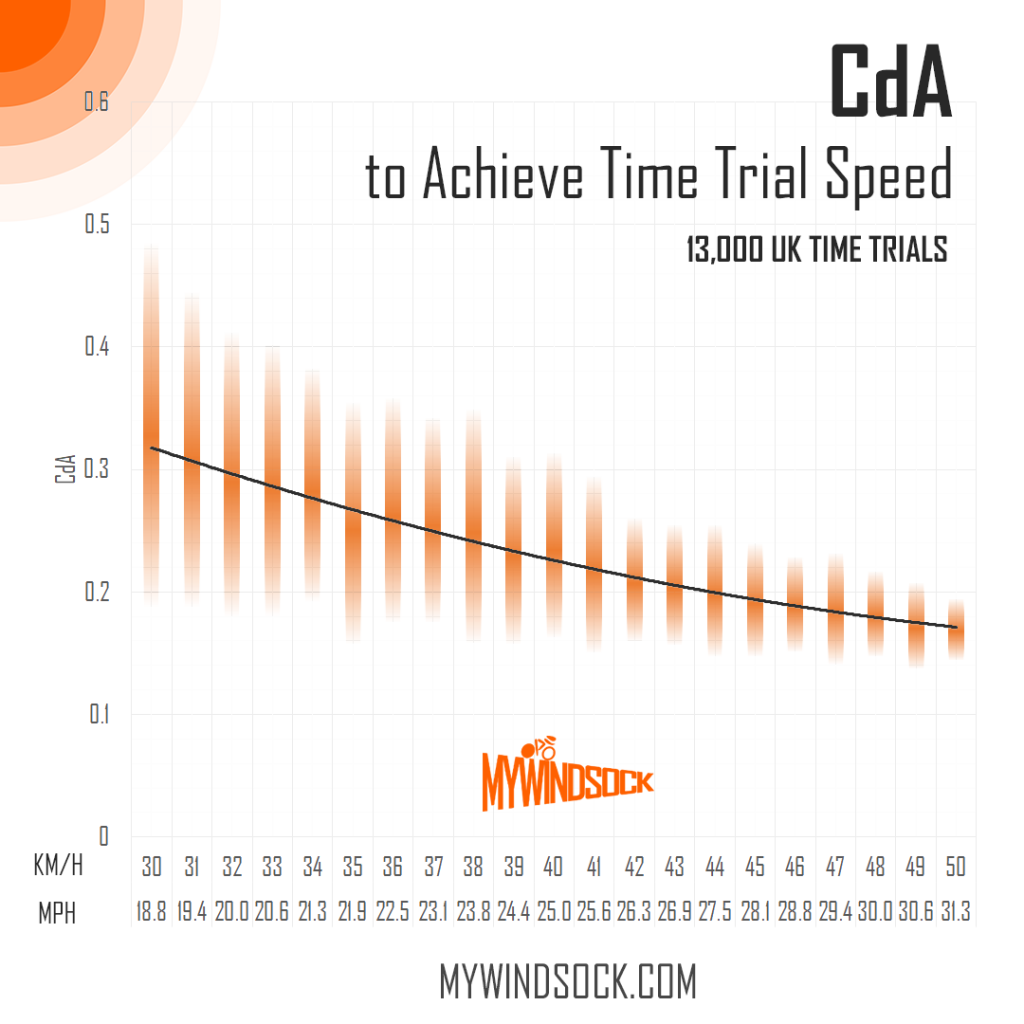
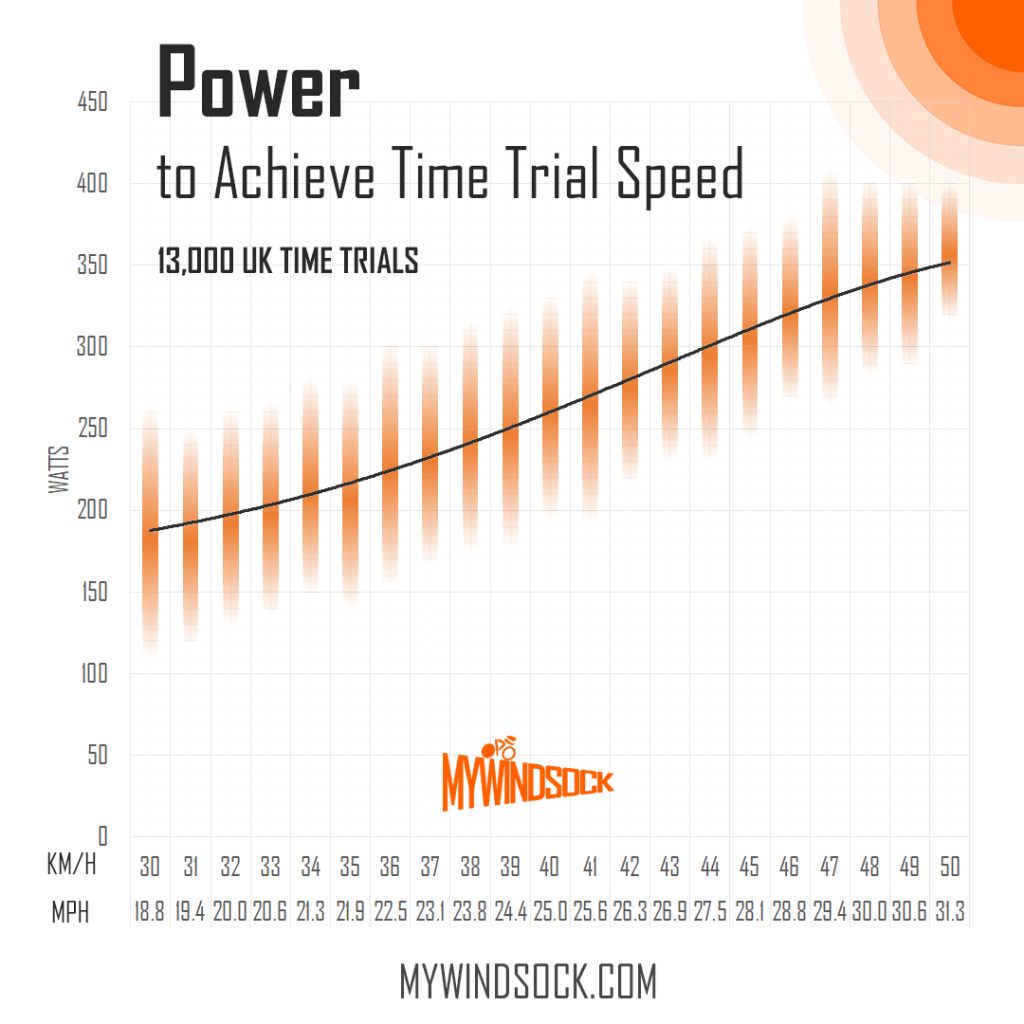
Everyone knows that aerodynamics are extremely important for cyclists – even more so for cyclists concerned with their speed. myWindsock have analysed thousands of files from time trials in the UK and looked into the distribution of CdA values and what speeds result from this.

This graph is an analysis of how the average CdA required for various speeds during a time trial. The black line represents the average and the faded orange bars represent the variance of values. You’ll notice a much wider range of cda values for speeds under 40kph as it’s much more possible to muscle your way into these speeds with a lower CdA. At 50kph, we seldom see a rider with a cda of more than 0.2 which shows just how aero British riders are!

Why is cda important for cyclists?

The term ‘cda’ actually stands for two things, how slippery you are (cd) and your frontal area (a) – CdA is the product of these values. It is used by engineers as one term because practically, it’s often difficult to separate the effect of the two with measurements. Generally speaking, CdA is a measure of how aero you are.

Why are aerodynamics important for cyclists?

Aerodynamics play a crucial role in the sport of cycling, as they can significantly impact a cyclist’s performance and speed. When a cyclist rides, they face resistance from the air around them, on a flat road this takes up roughly 80% of total resistance. The faster a rider travels, the greater the air resistance they experience. By optimising their aerodynamics, a cyclist can reduce the drag they face and improve their speed and efficiency. This can be achieved through various means, such as selecting the right gear, maintaining a good position and using aerodynamic wheels, helmets and skinsuits. Even small gains in aerodynamic efficiency can make a significant difference in their overall performance and race results.

myWindsock allows you to analyse your aerodynamics, with a number of CdA measuring features available calculated with a combination of your power data and the weather where you’re riding.

myWindsock premium features

myWindsock premium will measure your CdA on every ride! For around two pounds a month you will get…

  • Unlimited Athlete Profiles 
  • Unlimited Uploads
  • Design Optimum Power Plans
  • Aerodynamic Analysis & Testing**
  • Advanced Charts & Analysis
  • Weather Trends
  • Unlimited Virtual Athlete Profiles
  • 15 Strava Segment Windsocks
  • Unlimited Daily Activity Uploads (fair use)
  • Strava Segment Filtering
  • Strava Leaderboard Effort Weather*
  • Advance Cycling Weather Metrics
  • Download Virtual Partner
  • Annotate the race or training plan with Course Notes

This huge array of features will cost you $2.50 (£2) a month – sign up here.

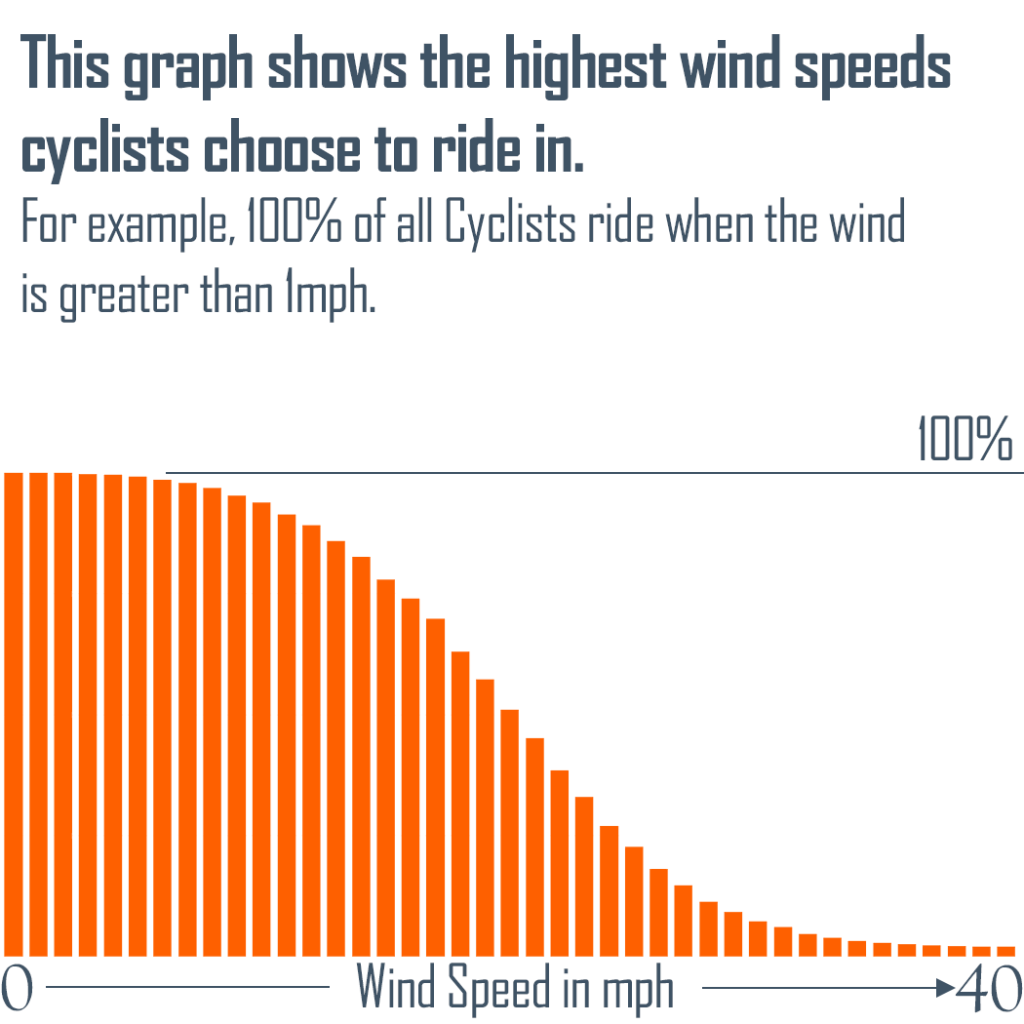
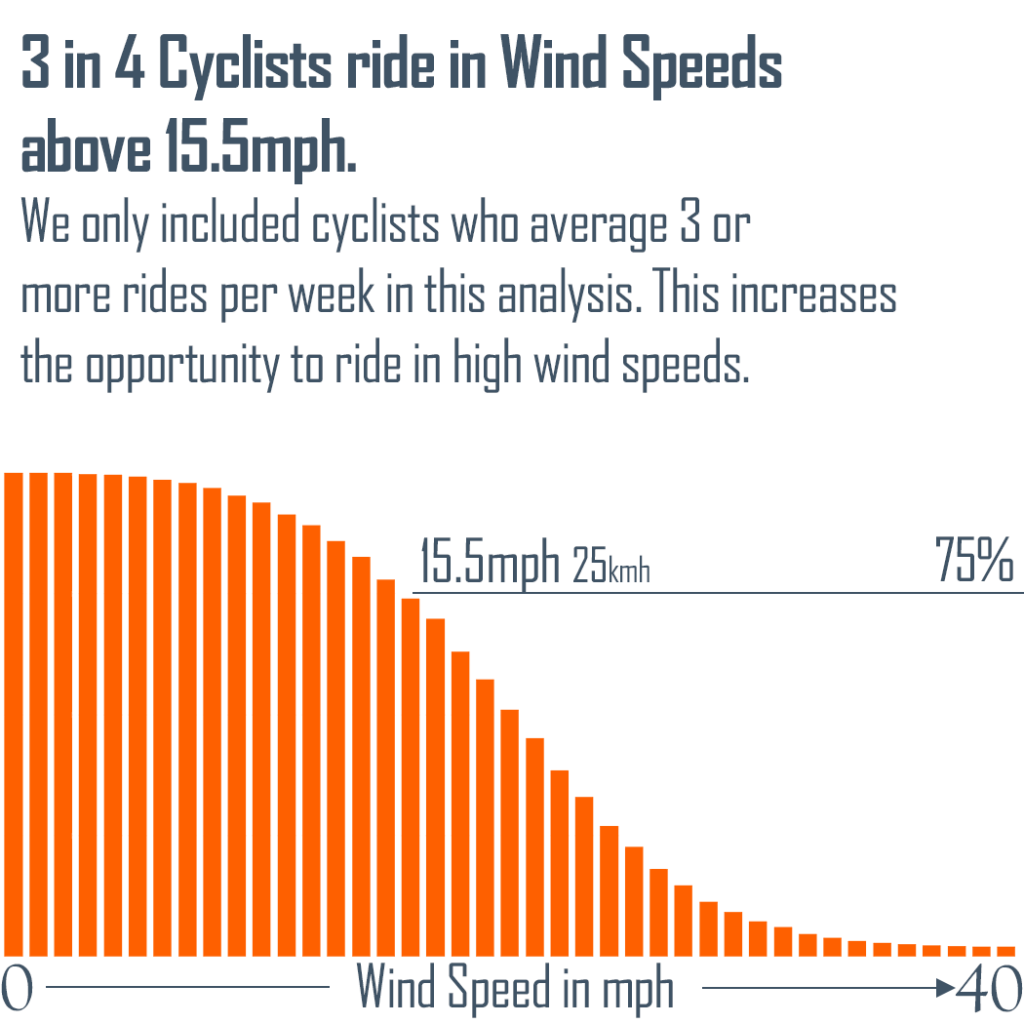
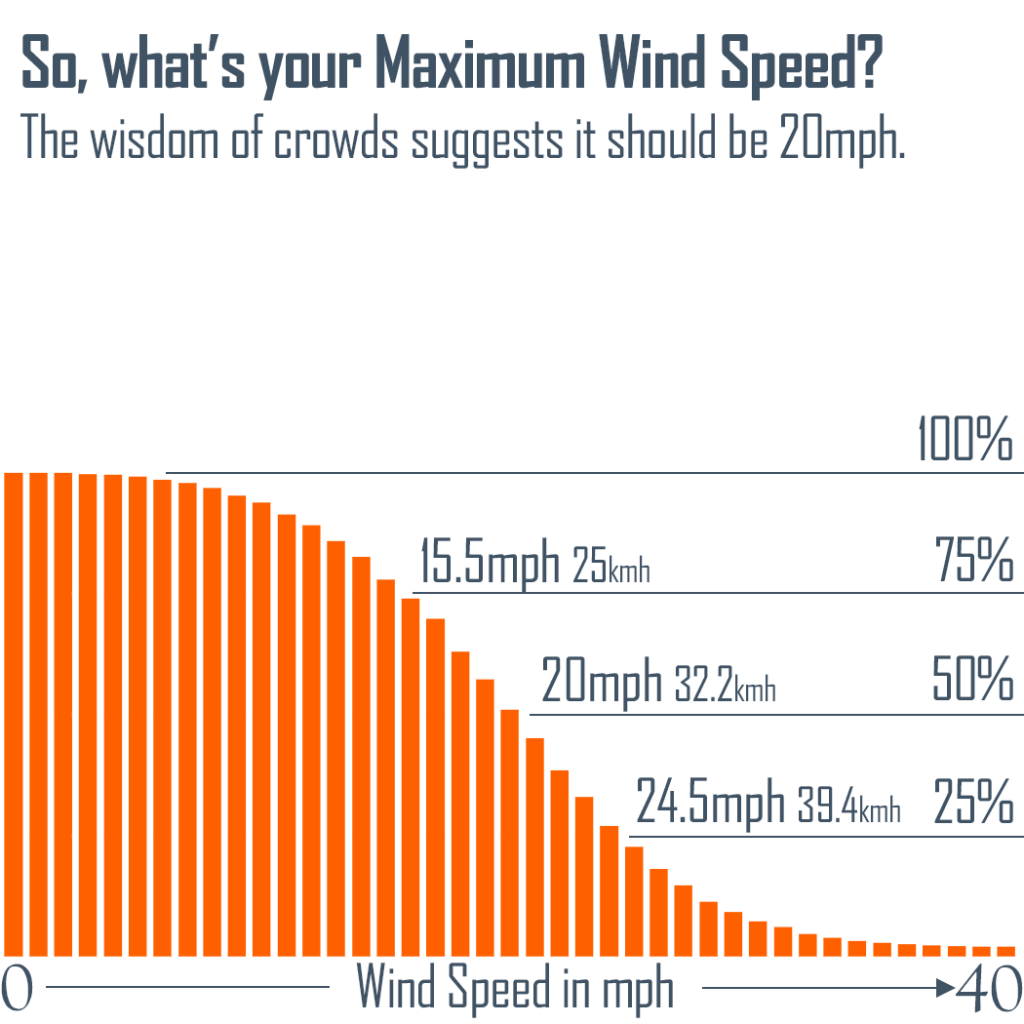
75% of cyclists don’t ride above this windspeed.

How windy is too windy? We’ve analysed the weather of millions of bike rides. Here’s what we found in answer to this question.

You may be wondering, “what is the maximum safe wind speed for cycling?”. Whilst this will largely depend on your experience as a cyclist, we decided to look at our weather analysis of millions of bikes rides for the answer.

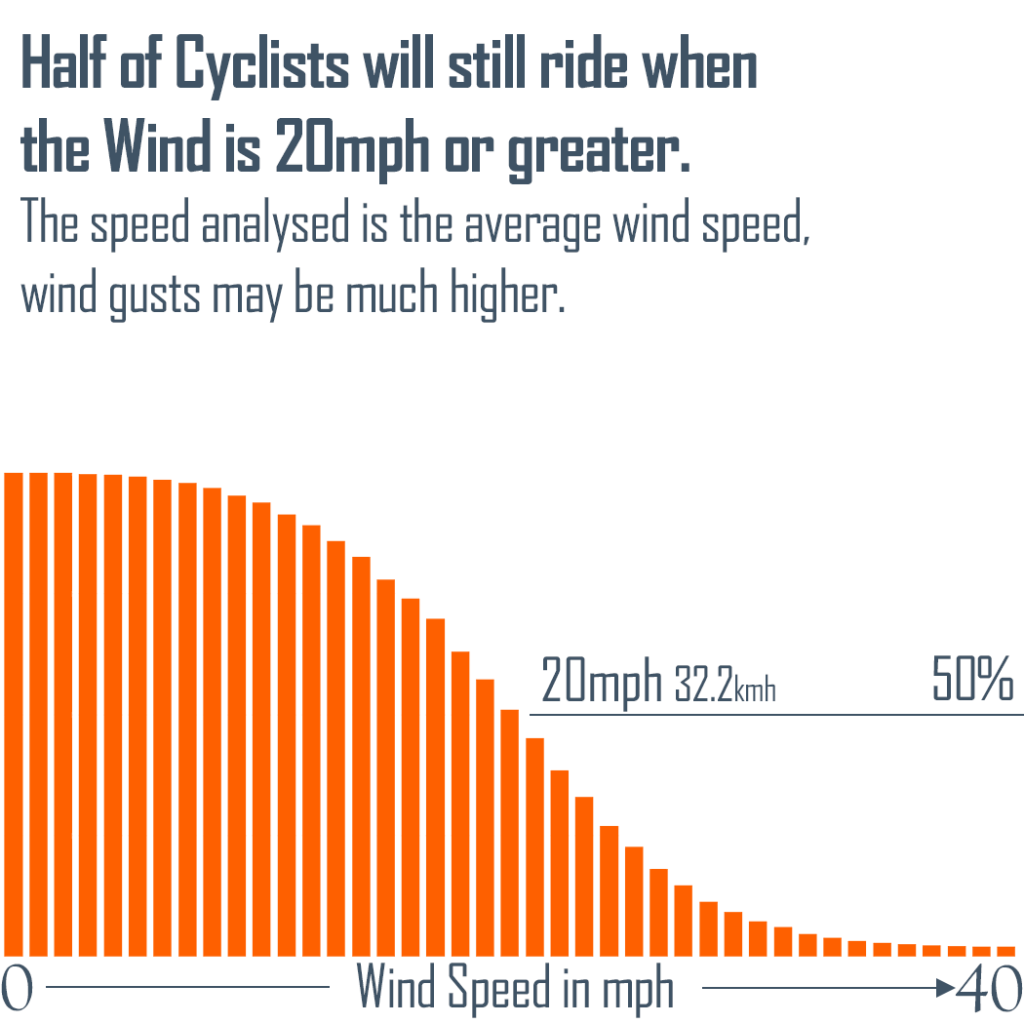
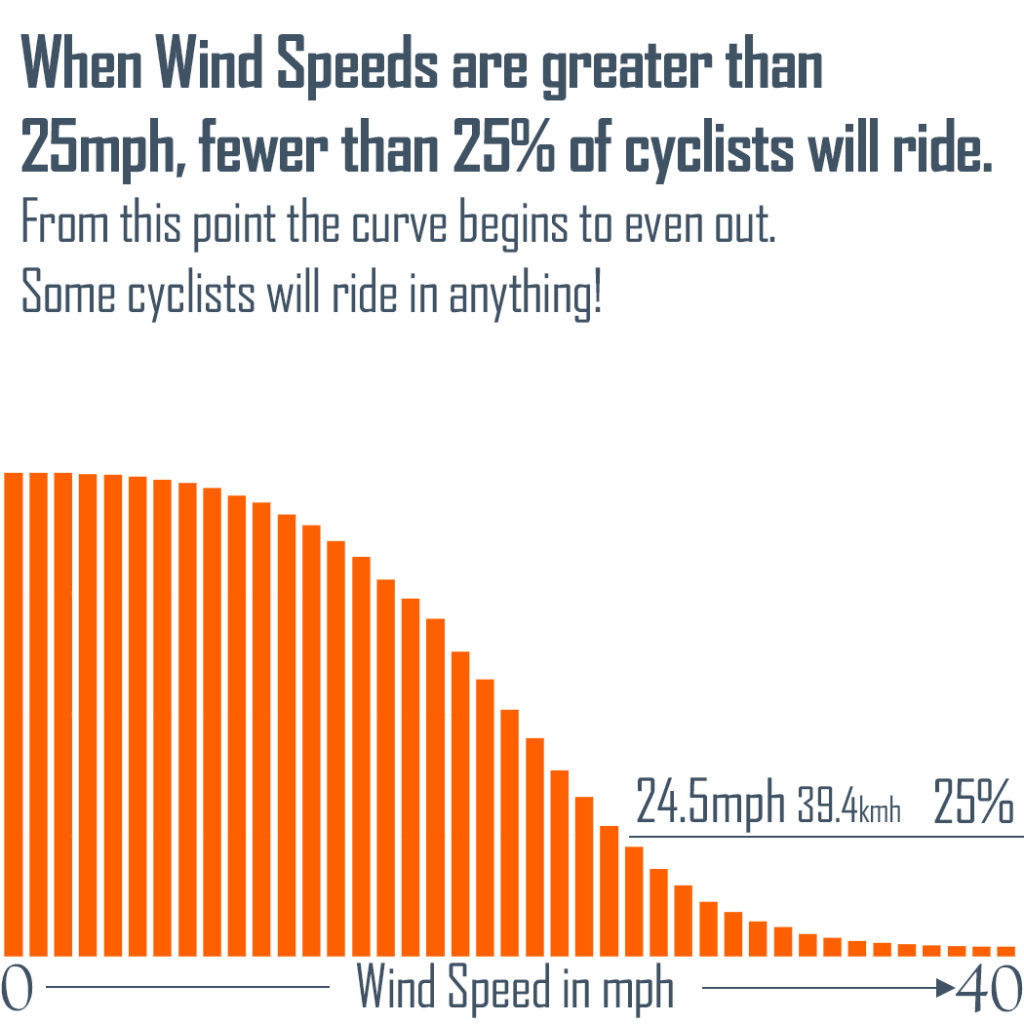
It seems that most cyclists do not cycle when the wind is above 20 mph average wind speed. Remember gusts will often be much higher than the average wind speed. We advise you to ride in weather that you feel comfortable and not to take risks.

How much power do I actually need?

Time trials are a weird sport as aerodynamics shapes a lot of it. The strongest rider doesn’t always win! It’s important to have a solid training plan in place. This should include a mix of endurance rides, interval training, and strength work to improve both your aerobic and anaerobic capacity. Ideally, you should be training at least 4-5 days per week, with a combination of longer rides (2-4 hours) and shorter, higher intensity efforts.

In addition to your training, it’s important to focus on your nutrition and recovery. This means fueling your body with high-quality, nutrient-dense foods to support your training, and making sure to get adequate rest and recovery between workouts. Proper hydration is also key, especially in the days leading up to your time trial.

When it comes to the day of the time trial, there are several factors to consider. One of the most important is pacing – it’s critical to start strong but not overdo it in the first few miles, as you’ll need to maintain a high intensity for the full duration. A good rule of thumb is to aim for an even effort throughout the ride, with a slight increase in intensity towards the end if you still have some energy left in the tank.

With all of that said though, once training and pacing is dialled there’s the question of how many watts we actually need?

Are you a UK Time Trialist?
All UK Time Trial Events forecasted here.

How many Watts?

We decided to sift through the data to see what it would tell us. This graph is taken from around 13,000 time trials in the UK and shows us how much power we need to achieve various speeds. The vertical orange bars show us the range in power that we saw in our data.

How aero?

Exactly how aero riders were also varied. Past 43kph ‘average’ was a cda of 0.2 – this is seriously slippery! It also shows us that the pointy end of the field in UK time trials are also extremely aero, look how small the range in cda is! No wonder that the sharp end of championship races is so closely contested.

If you want data like this to accompany your training, check out myWindsock here!

Are you a UK Time Trialist?
All UK Time Trial Event analysis here.

How much slower is +5Kg (11 lbs)

Due to a very serious spinal injury, myWindsock founder Ben, had 12 months without cycling. He returns to cycling 5Kg (11 lbs) heavier. How much slower can he expect to be? See the Instagram post below.

A bit more detail

We are all about real world riding, so we picked a very typical 25 mile course, on an average UK spring day. This course has some small ups and downs but would be categorised as flat. You can try the course yourself here, J4/8.

Our experiment was acrross 3 power ranges, 100, 200 and 300 Watts. Look at the chart below to see the differences between the powers. The differences are considerable. Remember, the time affect of a resistance compounds the slower you are moving. Less power, greater cost. No more, “I’m too slow for that upgrade” 😉

Often cyclists are surprised by how little time weight costs on a flat course. We are told lighter is always better and to upgrade to the lightest components. As you can see losing weight will have an affect on your speed, but we hope this will keep everything in perspective when making lifestyle and financial choices.

How to try your own experiments

The beauty of myWindsock is that all the variables are accounted for, Physics, Weather & Performance. This allows you to get real world test results in a virtual environment.

  1. Simply pick any route from your “Activities & Routes” menu.
  2. Set the date and time of your experiment for the most accurate cycling weather.
  3. Make changes to your Virtual Athlete profile.

Have a try yourself here.

How will a ride feel?

Take a look at the below graphic for this week’s Manchester District 10 mile. If you subscribe to myWindsock Strava Activity emails you may have already seen a similar graphic for your own rides. If not, activate your emails here.

https://mywindsock.com/modules/shareables/map.php?source=strava_segment&id=22428508&time=1677938400

56.4% headwind isn’t good news! However it is only through viewing the Feels Like Elevation graph beneath that we begin to see what affect the wind will have on the course.

Relating the wind to it’s equivalent elevation gain is one of the ways we are helping to describe the weather for cyclists. Learn more about Feels Like Elevation.

So what does this tell us? Initially we see an easing of the course profile due to the tailwind start. Then, once the headwind begins, the road begins to feel harder than the traditional elevation profile would suggest.

Graphs like Feels Like Elevation can be found for any past activity and any future ride forecast. Simply select the route from you Activities & Routes menu to begin.

If you haven’t already signed up for myWindsock Weather & Analysis, start here.

How much time does a skinsuit save?

If you’re reading the myWindsock blog, or came across this from our friends over at NoPinz it’s likely you already know what a skinsuit is and you might even be sold on the virtues of their number pocket that saves you watts. If you attend a local time trial, it’s likely the pointy end of the field will be in a skinsuit and these days, most people wear one for all forms of racing. The uninitiated, or even those of you that only take part in the skinsuit wearing because everyone else does, might be left wondering why people wear these? Surely a jersey and shorts is more comfortable? It certainly makes using the bathroom a little easier. We know a skinsuit is faster, but how much difference will it really make on race day? 

With great partners like NoPinz, we are able to get a hold of some data that tells us how many watts a skinsuit saves a rider and this can be converted into a change in cda. That’s all fine and good – but still doesn’t mean much on race day. What we really want to know is how much time will this save us today, or on the day of our race? During his hour record attempt, GCN’s Ollie Bridgewood used a NoPinz skinsuit to save himself a whopping 20W. These numbers are seen across the board and a ten percent reduction in drag due to a well fitted skinsuit is commonly seen.

Here at myWindsock, we specialize in turning data into information giving you confidence on race morning. Cycling is an uncertain sport and anything that can reduce the noise in the information that drives your decision making is valuable. By making use of our physics engine, we can calculate how much time a skinsuit will save you on a particular course.

A worked example – the Perfs TT

For our simulation, we will use two runs of myWindsock on Sunday’s open time trial which is being held on the Portsdown Hill circuit. We have fixed the cda at 0.220 for the first run and, while keeping all other variables fixed, we will reduce the cda to 0.198 for the second run. This is roughly the proportion of savings a skinsuit will achieve – worth around the 20W that Ollie was able to save with his Flow skinsuit from NoPinz. For this, our test rider is pretty handy – being able to maintain 325W for the duration of the TT with a system weight (bike, rider and equipment) of 80kg.

Test run 1: cda = 0.220

Our rider is coming in at a shade under 39 minutes with an average speed of 41.1kph – not bad! Let’s improve his wardrobe choice slightly and pop him in a NoPinz skinsuit and drop that cda.

Test run 2: cda = 0.198

The savings are huge, more than a minute! This is just the skinsuit too, imagine the cumulative savings from pacing, optimised position and other equipment choices. Slower riders will also achieve greater time savings for the same proportional saving in aerodynamics. As we can see, a skinsuit is worth it.

If you want to see how the watt savings touted by brands turn into time savings on your local TT course, they’re all available in myWindsock pre-loaded. Just hit Activities & Routes, UK Time Trials, and then scroll until you find your open TT! Or simply go here UK Open & Club Time Trials. On top of this, you’ll be able to see what kind of power is required for whatever performance level you are targeting.

How much slower are Winter Time Trials?

To mark the first British Open time trial of the 2023 season, we were happy to help Cycling Time Trials, the British governing body for time trials, with a bit of data.

> Read the Cycling Time Trials article

> BS19 Ely & District myWindsock Forecast

What is the difference between Winter and Summer?

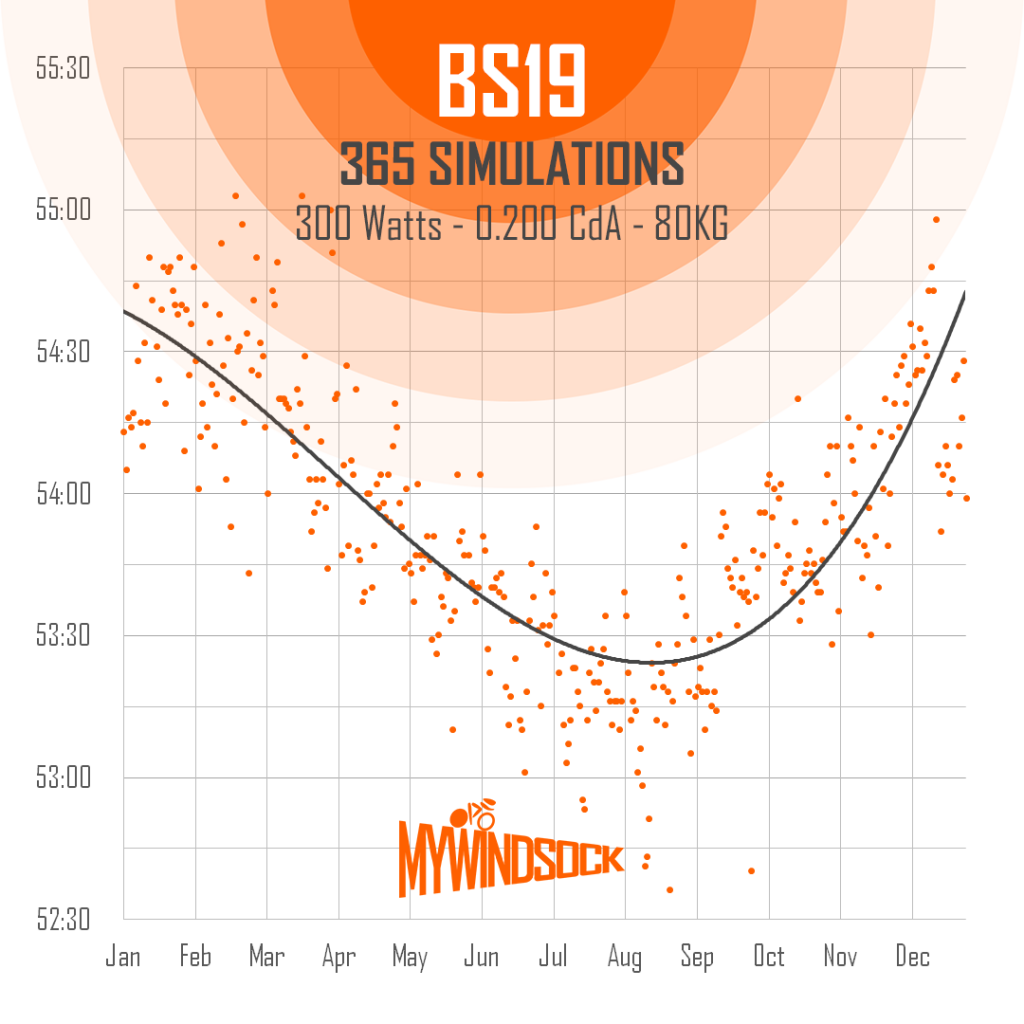
To find out the difference between Winter and Summer, we ran a simulation for every day of 2022. That’s 365 times around the Ely & District course! We ran the myWindsock simulations at 300 Watts, 80kg, 0.200 CdA. Here’s what we found.

Each orange dot is a simulated time based on weather conditions. Each day of 2022 represented.

You can see from the above graph the day to day the variability of times for the BS19 course due to the weather. Time range from 55 minutes in Winter Months to 53 minutes in the Summer.

Another thing to note is the seasonal day to day variability, that is the difference between two days of the same week or month. In the Winter we can see this is around 60 seconds, however times are a little more consistent in the Summer at around 30 seconds. Good job myWindsock give’s you the tools to measure the impact of the Weather.

> Find your Open and Club Time Weather and Analysis

We have more information about how weather impacts cycling speeds, here are some more articles.

Why do you ride slower in Winter: GCN Tech Show

Slow vs Fast Riders who suffers more in Winter Kit

Why do you ride faster when it’s warmer?

Why you are slow this Winter