Pidcock’s Sa Calobra KOM Analysis

Last month we did a bit of Sa Calobra analysis for the GCN Tech Show. So when we saw the KOM time tumble, we had to do some analysis!

Surprisingly, it wasn’t a gift day. In fact it was around 1 second slower than Ed Laverack’s KOM day! We’ll call that one even. Air Speed is the speed of the airflow around the rider. We’ve shown the speed difference from ground speed here.

Overall power was 8 Watts higher, giving Tom a 24 second advatange. That’s a huge 6.6Watts/kg!

Next an assumption on System Weight. That is the weight of rider, bike and kit. Rider stats show Tom as 1 kg lighter. This finds Tom another 15 seconds.

Now the big one, Aero! Tom finds a massive 72 seconds. Reducing air resistance from 14.3% down to 10%. The aero Tom has here, is the equivalent to a very well tuned Time Trial Bike position. So we’d assume some assistance here.

How fast would your Sa Calobra time be?

You can find your own time on Sa Calobra, simply by loading the myWindsock forecast. Check out the Sa Calobra Strava Segment

Taking a World Tour KOM with the weather forecast

Back in September, I had a crack at taking a KOM off a world tour pro on quite a long climb. The pro in question was a Frenchman by the name of Thibaut Pinot. I wrote the whole story of the attempt in Cycling Weekly and you can read about it here but I didn’t cover the difference in conditions that me and Pinot faced. I’ve always been slightly suspicious that he had a slower day, as that would go some way to explaining the huge power gap that was overcome.

The segment 

It’s a very long drag. The kind of climb that might even be faster on a time trial bike – especially if there’s no weight penalty as in my case. However, I rode it on the road bike as Thibaut did. It starts in the town of Saint-Gervais les Bains and finishes up at an alpine airport (an altiport) past Megeve. 

To decide who had the fastest day, we will take a look at the various conditions and see who has the lowest wImapact%. This will tell us how much faster or slower the weather made us, a higher wImpact% means a slower day (a 5% wImpact% means we’d have been 5% faster on a windless day, for example). 

The pacing plan was to make use of the gradient changes. This segment doesn’t really turn into a ‘proper climb’ until 10 km in. This meant that the aim was to get to  this point having used as little energy as possible and we will go on to talk about how that was achieved later.

Thibaut’s day

Taking a look at the map we can see that Pinot had a headwind on the early part of the climb, crosswind in the middle through Demi-Quartier to Megeve and finally a cross-tail up to the altiport. Broadly, the conditions he faced were relatively neutral in the sense that there was no dominant headwind or tailwind. 

Thibaut Pinot had a wImpact% of 2.2% on the day that he took the KOM. He rode up the climb in a time of 40:31. 

My day

I had a wImpact% of 1.8% on the day that I took the KOM. I rode up the climb in a time of just over 39 minutes. My day was 0.4% faster than Pinot’s – so how did I manage to put around 3% into his time? Let’s take a look at the wind map from my day. 

I had a very light headwind basically the whole way up. So, how did I do it? 

Well basically we cheated a little by using my mate Harry to place the flatter sections. Here’s an excerpt from Cycling Weekly which explains our method.

Harry paced the flatter sections for me. We avoided using the car for aero assistance as that felt unfair but, luckily for me, Harry provides a similar draft zone to that of a Peugeot Traveller and has a good amount of watts to offer up alongside, making him a perfect team-mate.” 

This meant I could put all of my energy into matching Pinot on the steeper sections where the wind matters less and had Harry on the front on the flat, headwind sections meaning that he is the reason we took the KOM. 

Even on a climb like this, air resistance was around 15% of the total resistance that I faced during the attempt. This is worth minutes and paints an interesting picture as to how important things like drafting and aerodynamics are on climbs, even at relatively low speeds of 25-26 kph as they were in this attempt. I am not faster than Pinot, despite outperforming the weather! 

If you want to take a KOM off a world tour rider, you might wish to do so with the assistance of myWindsock. We can help you go into attempts like this with confidence and you’ll know what power you need to do for what duration for a given outcome. You can sign up here.

How to get the Sa Calobra KOM…

Sa Calobra is a climb on the Island of Mallorca. It’s a well known testing ground for world tour pros and amateurs alike and recently, the GCN tech show have been talking about it! The steps to getting the record on this climb are as follows…

  • Step 1 – Have World Tour power to weight ratio
  • Step 2 – Profit

Ok, so the KOM is quite hard to get. But as the GCN fans amongst you might have noticed our feature on the Tech Show helping them out with some number crunching. The video is right here, but we will go into a little more detail on some of the plots and graphs below…

Stand up or sit down?

Many of you will probably have observed that when you stand up on the bike, you can produce a few extra watts. The downside to this is that you present a larger frontal area to the wind. As a result, depending on the wind direction and the gradient, either can be faster. It’s not as simple as “always sit” or “always stand”.

If it’s steep, you’re going slower and thus get less aero penalty for standing up. In any scenario where your wind speed is low, if you can put more watts out standing up it’s likely faster to do so. Remember, your wind speed and ground speed are not the same! In headwind sections, even when climbing slowly, sitting is likely your best option as air resistance will be a significant portion of total resistance.

When should I go?

Now we know whether or not we should stand up or sit down (well, we should do both depending on where we are on the climb) it seems wise to figure out when we should go. Mallorca, being a small island, is quite exposed to the elements and weather can make a big impact.

We modelled the current KOM ride, at the same time of day, for everyday of 2022.

In 2022, the slowest day for an attempt was in March and the fastest day mid September. generally speaking it gets slightly faster the later into summer you get but the difference in conditions can vary a lot from one day to the next. Late August and early September seem like good times to go and have a bash at the segment.

What time would you do on Sa Calobra?

Why not give the myWindsock modelling a whirl. Find out what your best time up Sa Calobra would be, view the Sa Calobra Segment.

If you like this analysis, and want to learn more about the features available to you when you sign up to myWindsock, have a look here.

Aero Testing with myWindsock

Aero field testing is available to all Premium members with power meter data by simply viewing their Strava Activity Weather or uploading a TCX file. Learn more about Premium.

When you head out to do an aero test using myWindsock, there’s always a question of how much you can trust your results. We understand this and have a tool for this in our aero test mode – confidence!

In the above image you can see that the rider (Ben) alternated between two positions. The first two runs went reasonably well and the Orange Test Range around the Test Average is very narrow. I had enough good consistent loops and the bad loops were detected well by the filter. This is a test with ‘High Confidence’. The narrower the confidence bar, the lower the variance between calculated cda values. The aim, when doing an aero test, is to make this range as narrow as possible.

Top 5 reasons you have a high test range

  1. Traffic at turns – Leaving your position or using the brakes on a large number of your loops will cause a high Test Range. Choose quieter times of day or ensure a greater quantity of good loops vs bad. Ensure when you do use your brakes you use them sufficiently enough to greatly impact the loop CdA otherwise it may not be filtered and make its way into the test range, take the opportunity to sit up and relax before the next loop.
  2. Traffic passing – Your CdA is affected by traffic in both directions. Oncoming traffic will increase your CdA whilst traffic passing you in the same direction will decrease your CdA. Choose times of day that have the lowest or most consistent level of traffic. If you suspect a bad loop due to traffic brake to a stop to demonstrate to the loop filter that it is a bad loop.
  3. Gear changes – Changing gear will change your drive train efficiency. If you do have to change gear (ideally don’t) make sure you always change at the same location. Do not change loop to loop and test to test. Pick a gear, make a note of it, check that you’re in it and leave it.
  4. Insufficient test loops – If you have a really good test loop, a velodrome for example, you can get away with a handful of loops per test. If however you aren’t that lucky more loops are required. Remember using a short loop will isolate problems and speed up your test. 
  5. Position discipline – Make sure you are paying attention to your position. Doing some loops relaxed and some loops focused will lead to a wide range. Small changes to position are too subtle to be weeded out by the loop filtering process and will therefore produce a large Test Range.

    Aero field testing is available to all Premium members with power meter data by simply viewing their Strava Activity Weather or uploading a TCX file. Learn more about Premium.

This blog post was written by Ben back in 2017 but has been adapted and reposted in November 2022!

Windsock beyond time-trials

Any reader of this blog will likely understand the virtues of myWindsock for athletes looking to improve their performance. We know the detailed forecasts can allow us to pace races optimally, target Strava segments and figure out where to attack. The performance aspect of myWindsock is used by world class athletes to break records and win olympic medals. 

Most of us have no chance of making the Olympics, most of us will not be breaking the North Coast 500 record and most of us aren’t even trying to break personal bests over ten miles most of the time. Primarily we just enjoy riding our bikes. Racing is a huge part of what inspired myWindsock, but we aren’t only a tool for racers. The one thing all cyclists have in common is that they enjoy riding their bike. 

That enjoyment varies by ride, let’s not pretend we enjoy getting soaked in British lanes as much as we enjoy railing alpine descents in the sun. We don’t. However, it’s easy to enjoy cycling without rain and wind. The real challenge is learning to enjoy riding on the roads of the UK throughout the miserable months. I’m writing this on the 14th of November and the next time I plan to get back on my bike is the 16th and I plan to avoid the rain! 

Planning what to wear 

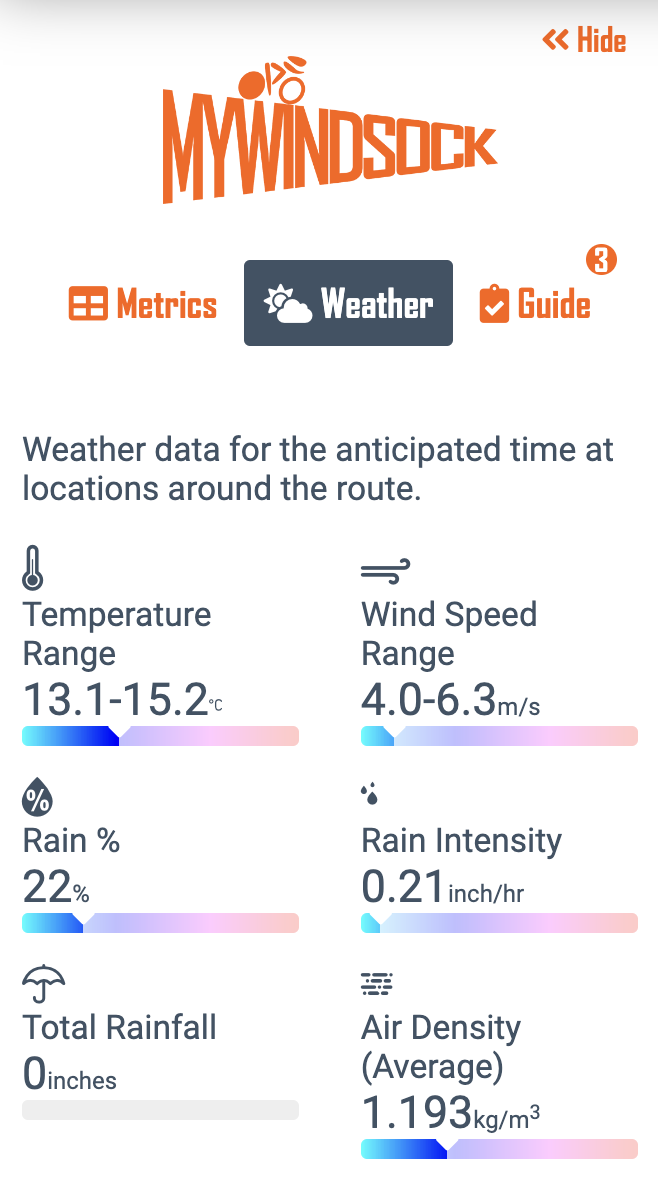
I live in a relatively small flat with a small washing machine – as a result, I have to plan my kit a little in advance. One thing that helps, is deciding what to wash with the assistance of an accurate weather forecast. I live in Southampton and tend to ride in the New Forest, of course the weather can vary quite a lot over the course of a 100km ride, so rather than checking the weather in every town that I’m planning to ride through I shall use a windsock forecast.

As we can see, I shall possibly be getting wet but the temperatures aren’t particularly cold. As a result, I’ll locate a breathable, packable raincoat to avoid the ‘boil in the bag’ effect of my sturdier ones! On top of this, I’ll probably get my legs out and wear my waterproof bib-shorts.

The interesting thing is, despite being extremely interested in performance, I use myWindsock for this purpose more often than I use it as a means of predicting performance. Let’s face it, we all train a lot more than we race – even if we don’t train much at all.

Planning where to go

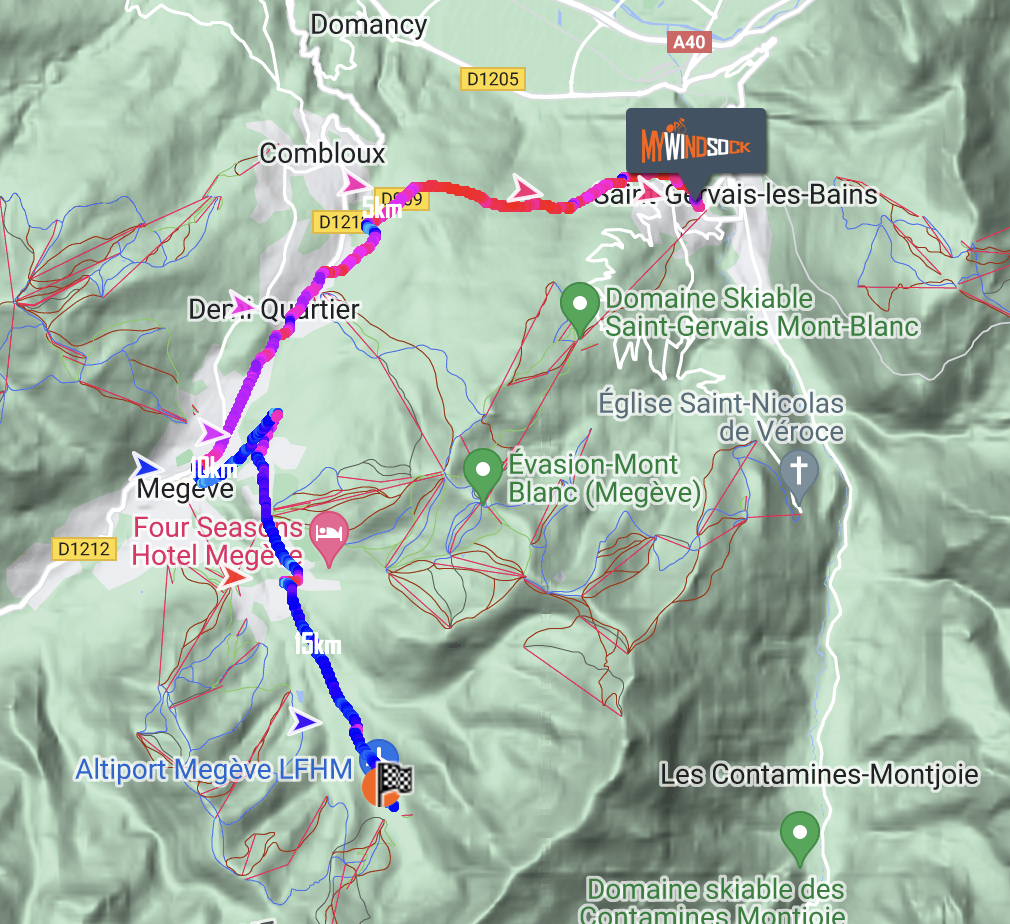
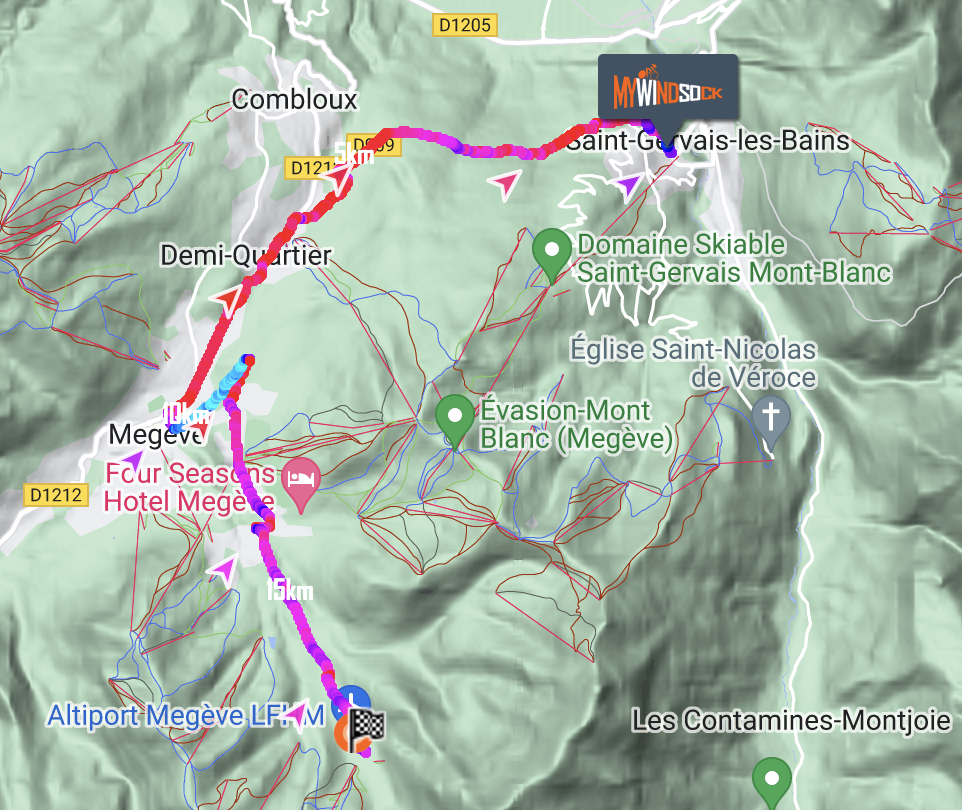
Ok, two weather related factors of rain and temperature have been taken care of and we know what to wear. But there’s still one open question – where should we go? I never used to bother with wind direction on rides but, thanks to my mate Harry, I’ve become addicted to the “tailwind home”. Obviously, you feel much worse at the end of a ride than you do at the start – you’re tired, ready for a shower and a snack and the last thing you need is a headwind for the final 10 miles. Luckily, myWindsock has us covered. Let’s take a look at the route map… 

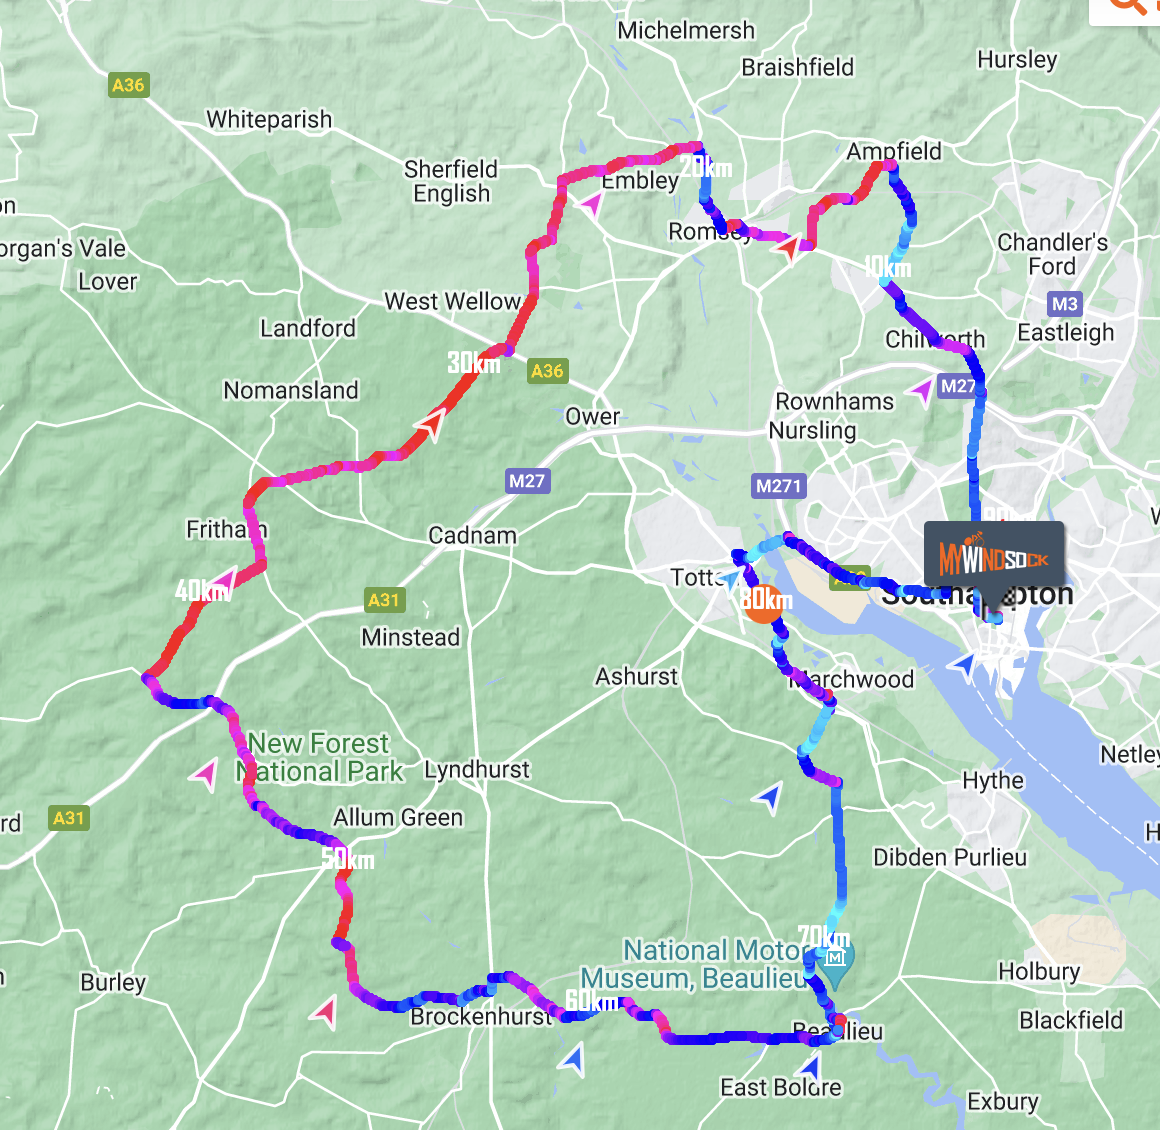
Blue means tailwind, red means headwind. The arrows show us where the wind is pointing in any direction. Generally speaking, the New Forest is pretty flat and the wind is the main thing that provides riders with resistance. We can see from this that, broadly speaking, I’ll have a headwind at the start and tailwind on the way home.

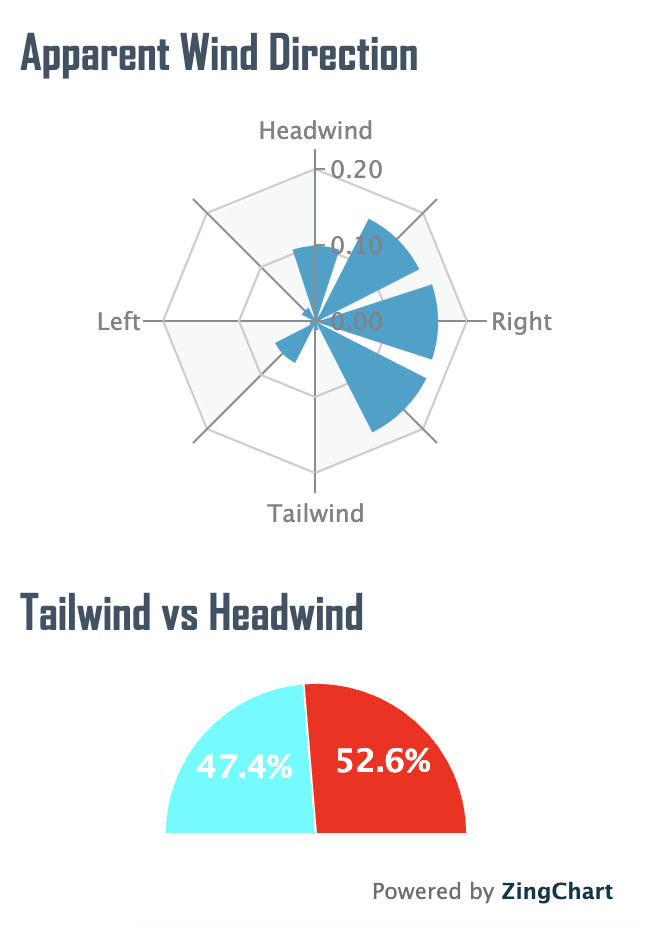
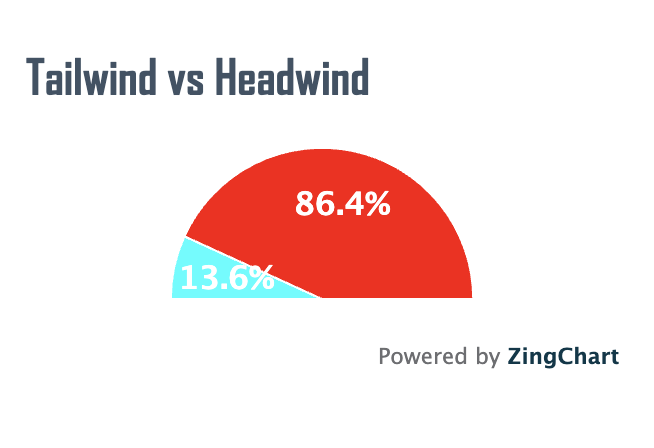
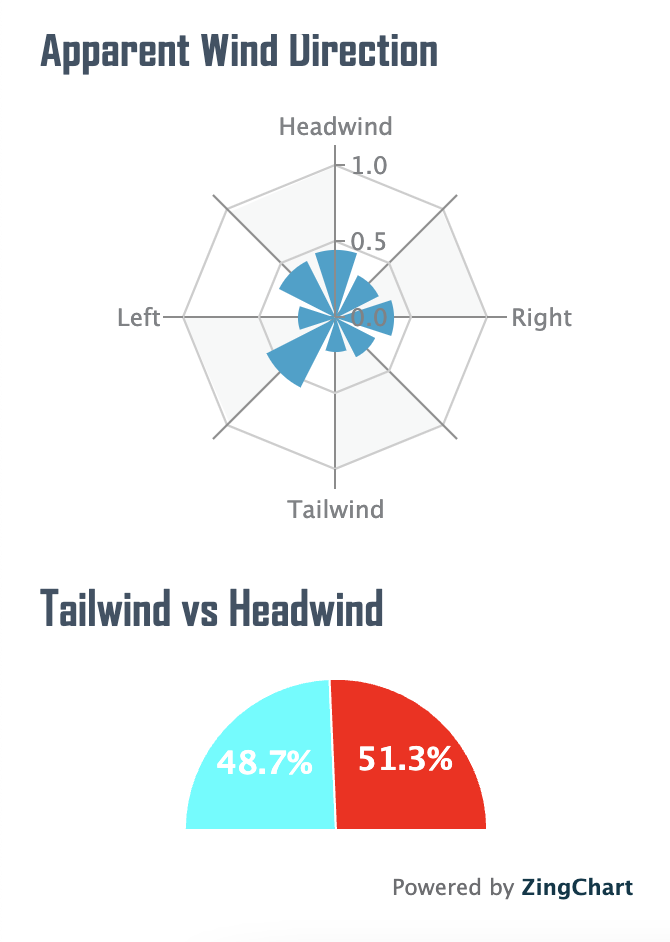
With it being a loop, we have mostly an even split in wind direction. The distribution of wind directions can be seen on the “Apparent Wind Direction” plot and the proportion of Tailwind to Headwind can be seen below this.

Using myWindsock is not the preserve of elite athletes. Sure, it’s a great tool for them – probably the best! It’s a great tool for anyone heading out on their bike too. I know that on the Wednesday ride, I’ll be doing my turn on the front in the last half of the ride with the tailwind. We can help you pick the right kit, pull the easiest turns and time your segment hunting to perfection. If you’re interested in signing up, many of the best features of myWindsock are available on our free version. Take a look here to sign up! 

GCN Tech Show, National Hill Climb Winning Margin

For GCN, we were asked to look at the 2.36s Winning Margin, between Andrew Feather and Tom Bell. Check the GCN tech show out. Below the video, we I’ll show you how you can do similar experiments.

How you can discover stats like these with myWindsock

A myWindsock Virtual Athlete, rides the course just like you. However, they ride at any power, any aero, at any weight and never get tired. Just like you, they have to battle the weather and terrain. Virtual Athletes collect insightful data as they ride, meaning we can give you an exceptional level of detail about your activities.

Once you have customised your Virtual Athlete, you can now make changes to see how that impacts the time. In this example we have increased the Virtual Athlete’s Power by a couple of Watts. Not only can we see how much time has been gained, we can also see where on the course the time was gained. Notice how this isn’t a linear line, time is gained at differing rates.

Time gained by a couple of extra Watts

If you want to get super optimised, we can see where this extra power had the greatest impact on time. The Delta Variance shows this to us by colouring the line green. We’d prioritise these green sections when formulating a power plan.

Why not Predict what your National Hill Climb Time would have been, view forecast.

More about the National Hill Climb

>> National Hill Climb: The Winning Margin
>> National Hill Climb 2022 Weather Forecast

Why do you ride faster when it’s warmer?

This weekend, it will be unseasonably warm for many of Britain’s cyclists meaning the summer kit might just get one more run out – plus a waterproof layer or two. One thing you might notice though, is that you tend to go a little faster in the heat. Why is this? 

The first reason is quite an obvious one, you’re wearing less clothes. A jersey and shorts is much tighter fitting than a winter jacket. That flapping in the wind costs energy – as the jacket presents a larger surface area and increases the amount of turbulent air. But, cold air itself is actually slower too!

Why is cold air slower?

If we have a think about the aerodynamic equation which governs how the force on something changes as it moves through the air under various conditions we notice that the power re quired to move our bicycle is proportional to the density of the air. Air density is not static, some air is more dense than other air. Remembering our GCSE science, we know that density is directly proportional to pressure – and pressure is proportional to temperature! This means, on a hot day, the air is less dense.

Why is less dense air faster?

Density is a quantity which describes how much of something takes up a given space. The density of air describes how many air particles are in any given square metre of space. If the air is less dense, there is less air to ride through. This is the reason many record attempts take place at altitude. With less air to ride through, it’s much easier to go faster!

If you’re out on your bike this weekend, you might see a notable uptick on your average speed. If you’re interested in how the weather can impact your riding or want detailed, up to date forecasts – sign up to Mywindsock for free here.