The Experiment
Using myWindsock’s cycling physics engine we raced two bikes. One a road bike and the other a time trial bike. We raced the three times at different power outputs, 150, 250 and 350 Watts. These are the sort of power numbers that might represent what a beginner, intermediate and advanced rider might do for a 25 mile time trial.
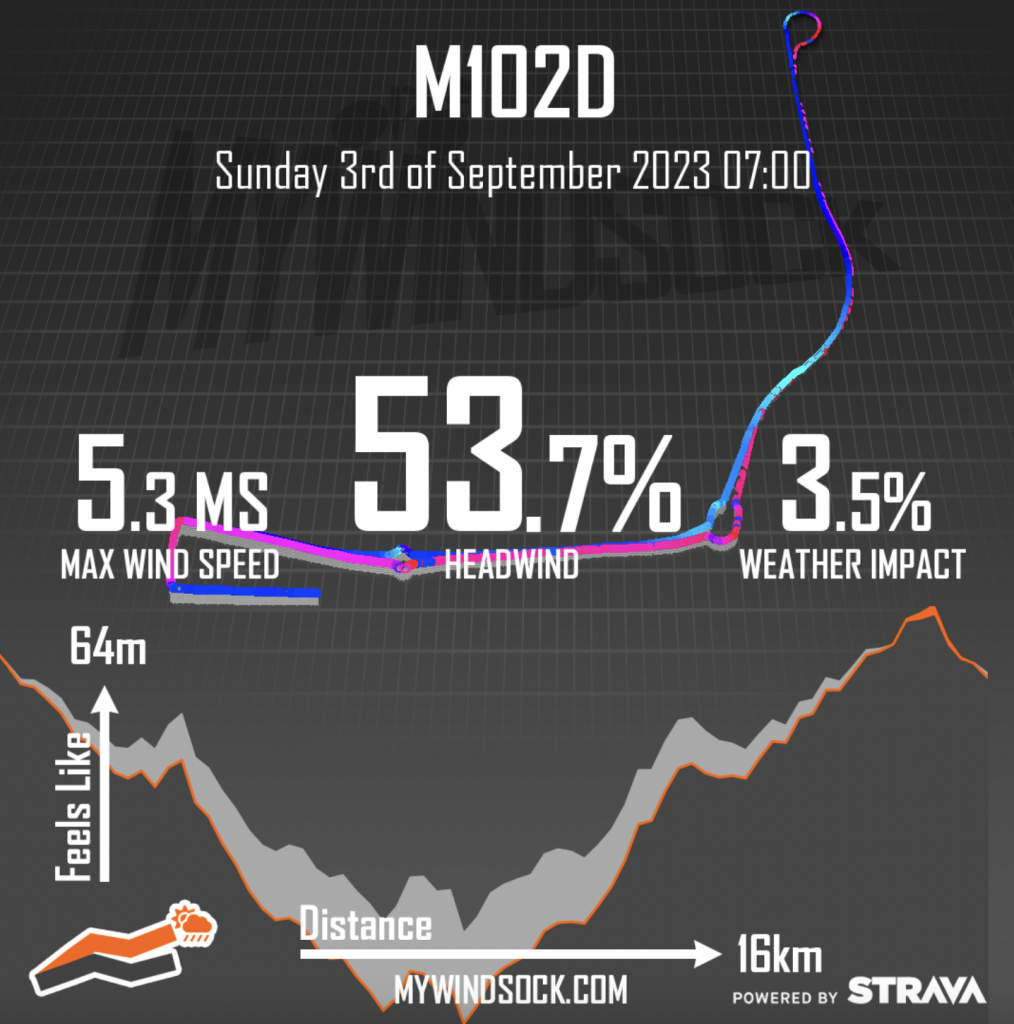
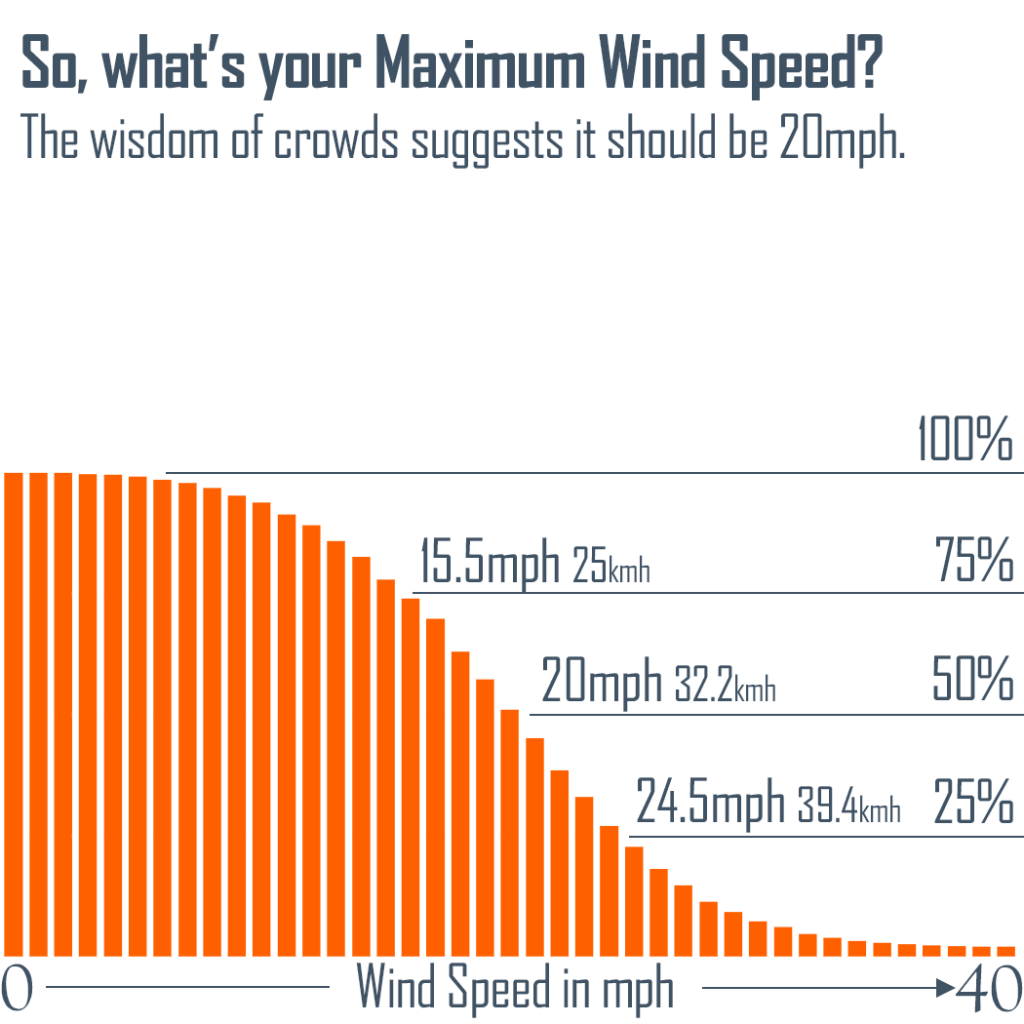
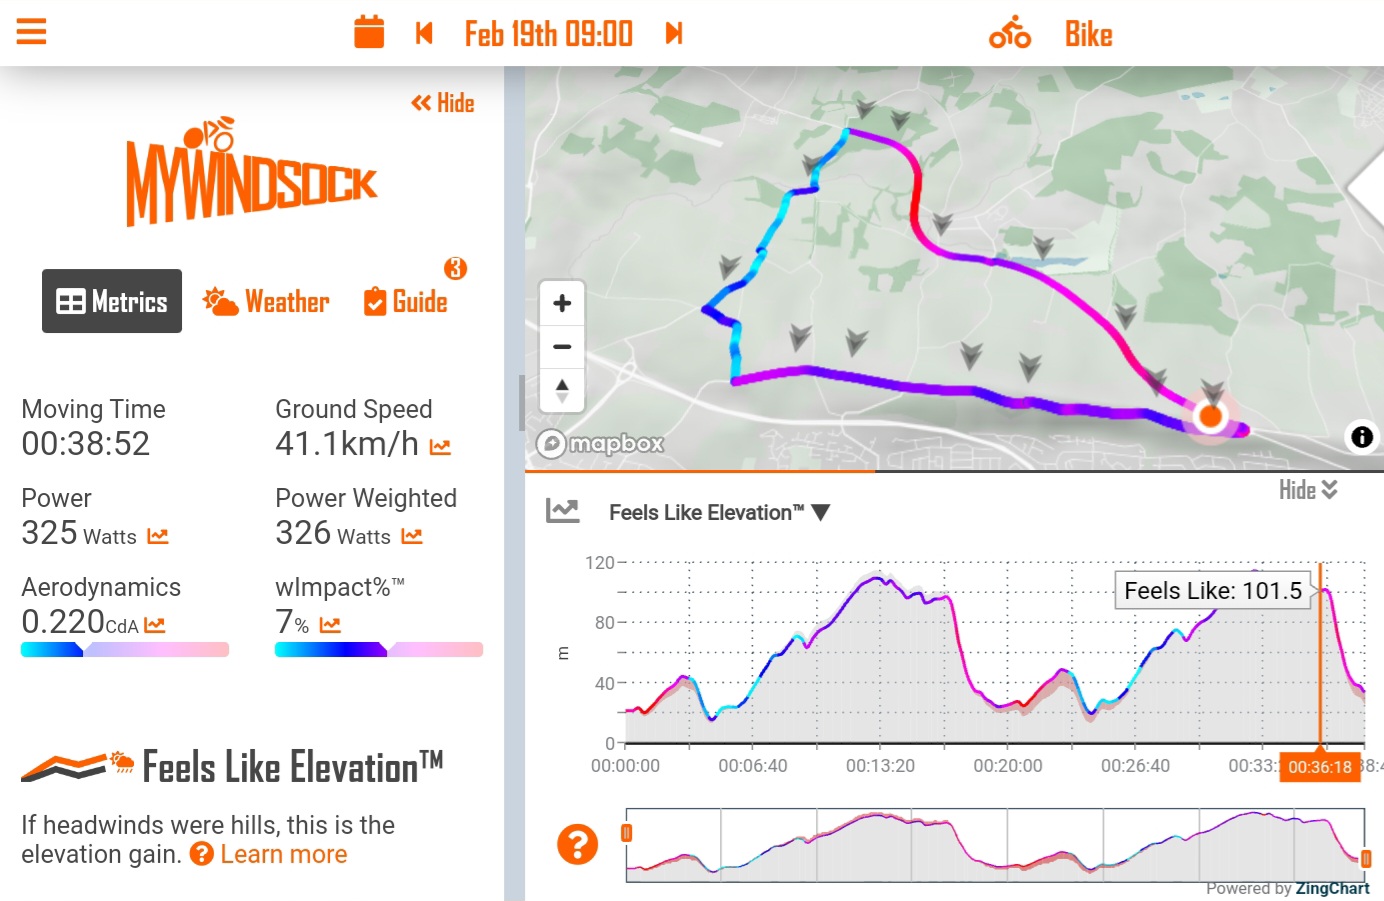
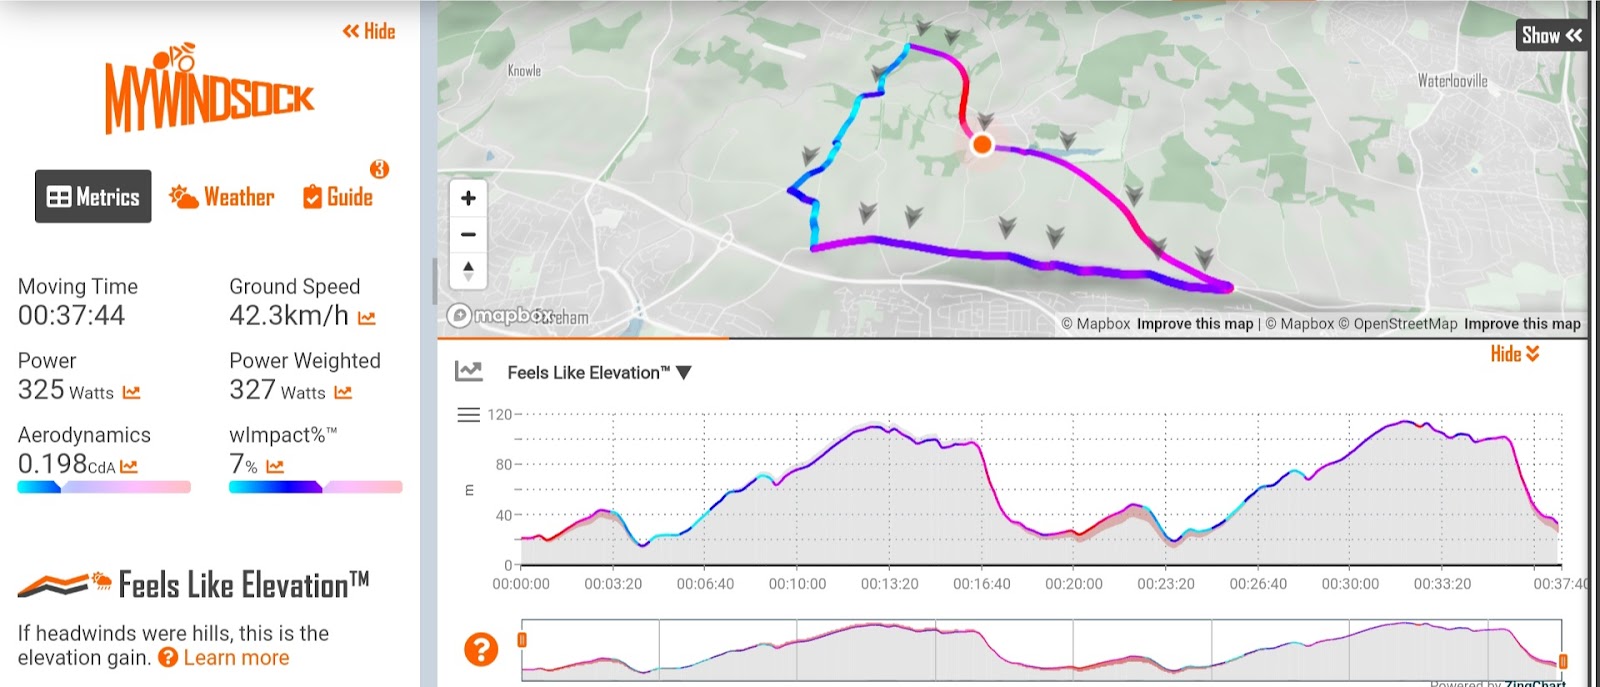
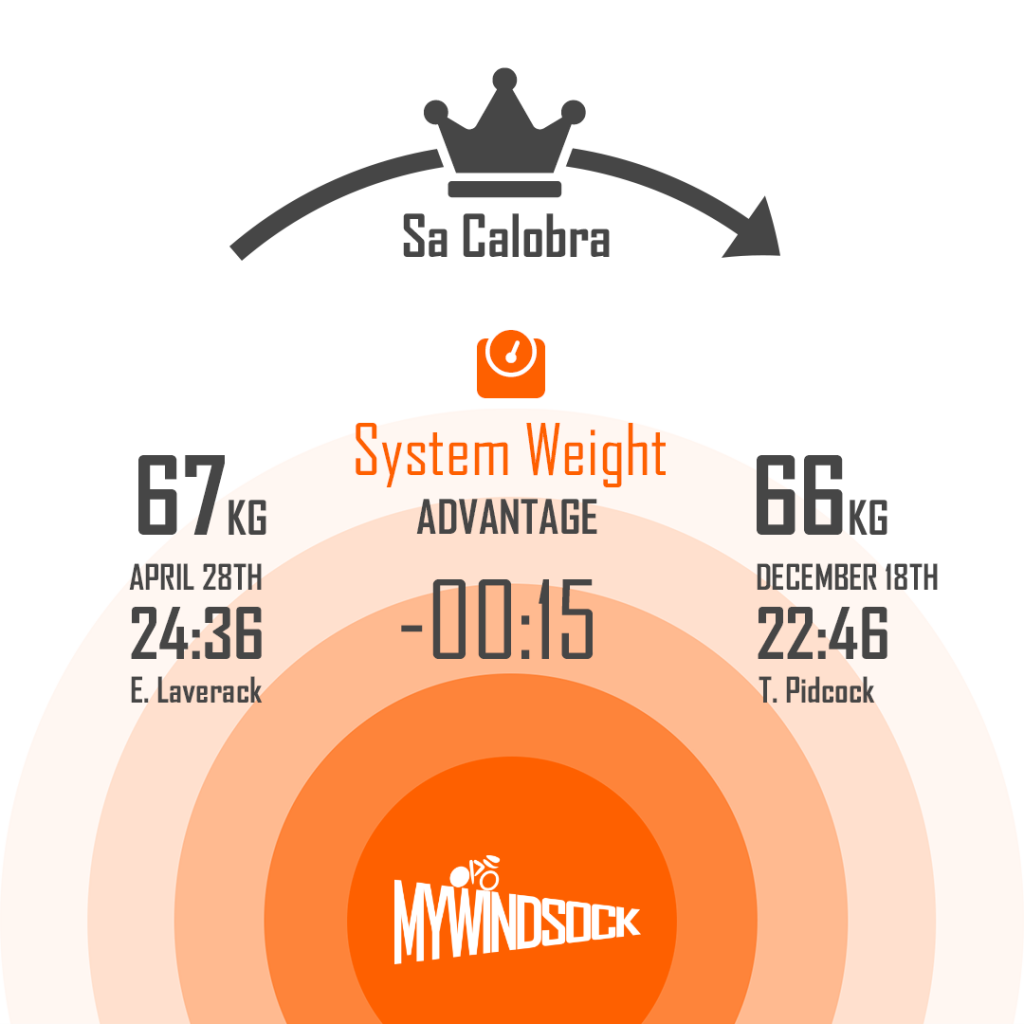
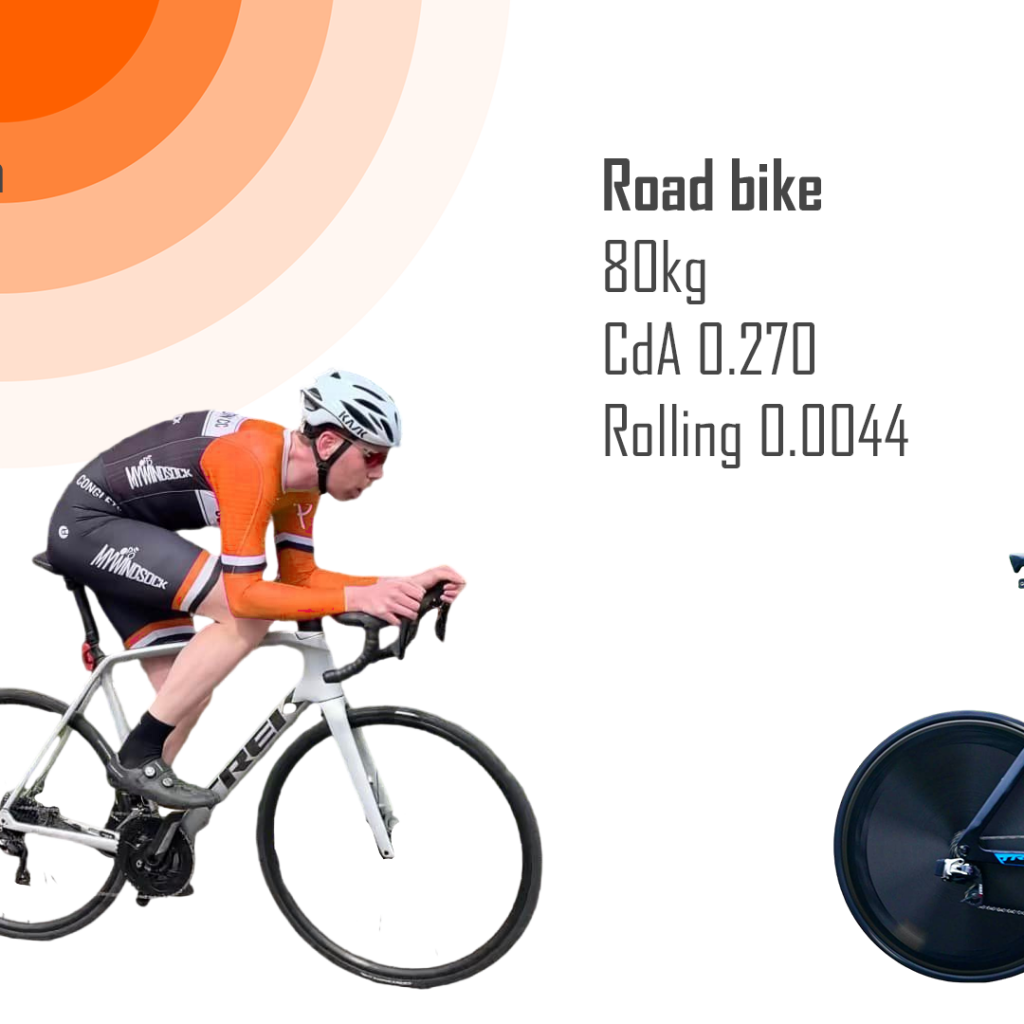
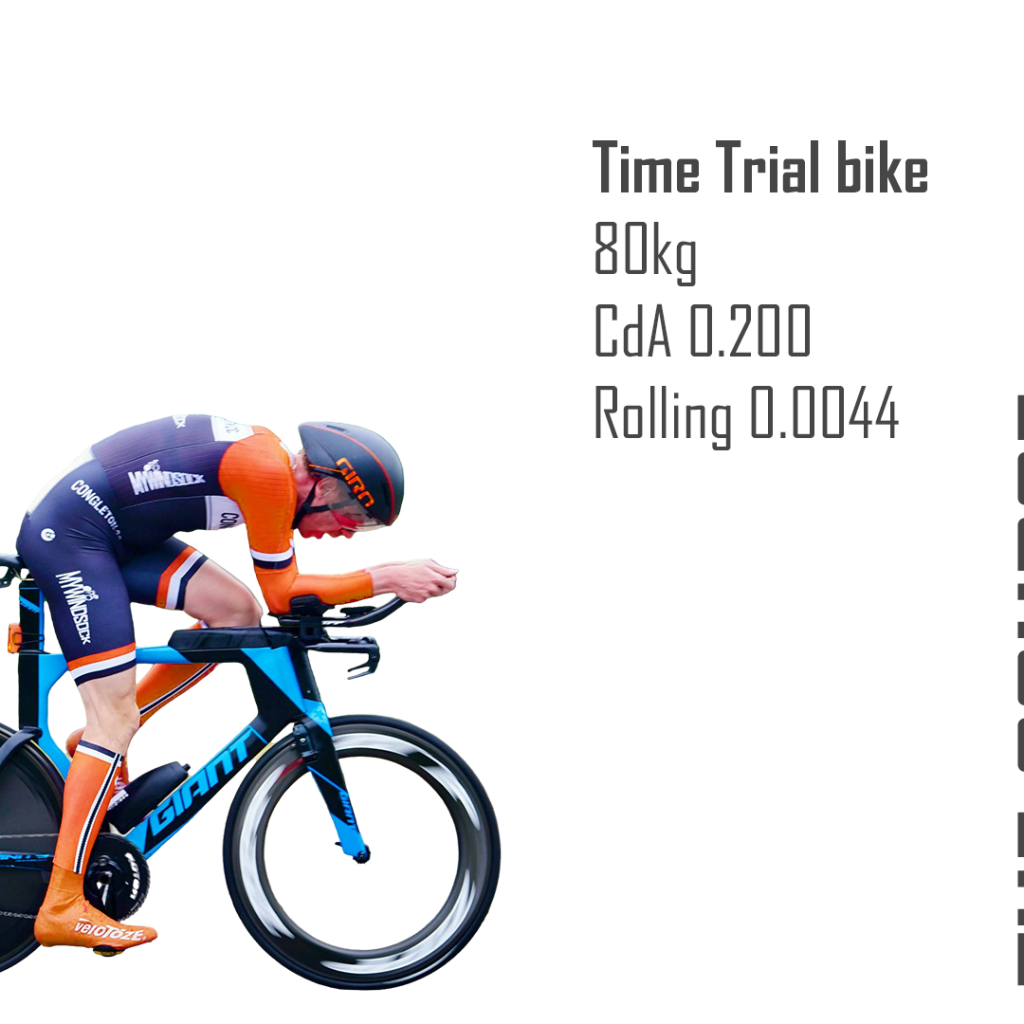
We have used a myWindsock forecast in order to see the impact of the time trial bike on the road. You’ll notice from the graphic below that we have kept the system mass and rolling resistance the same such that the difference is solely due to the time trial bike.
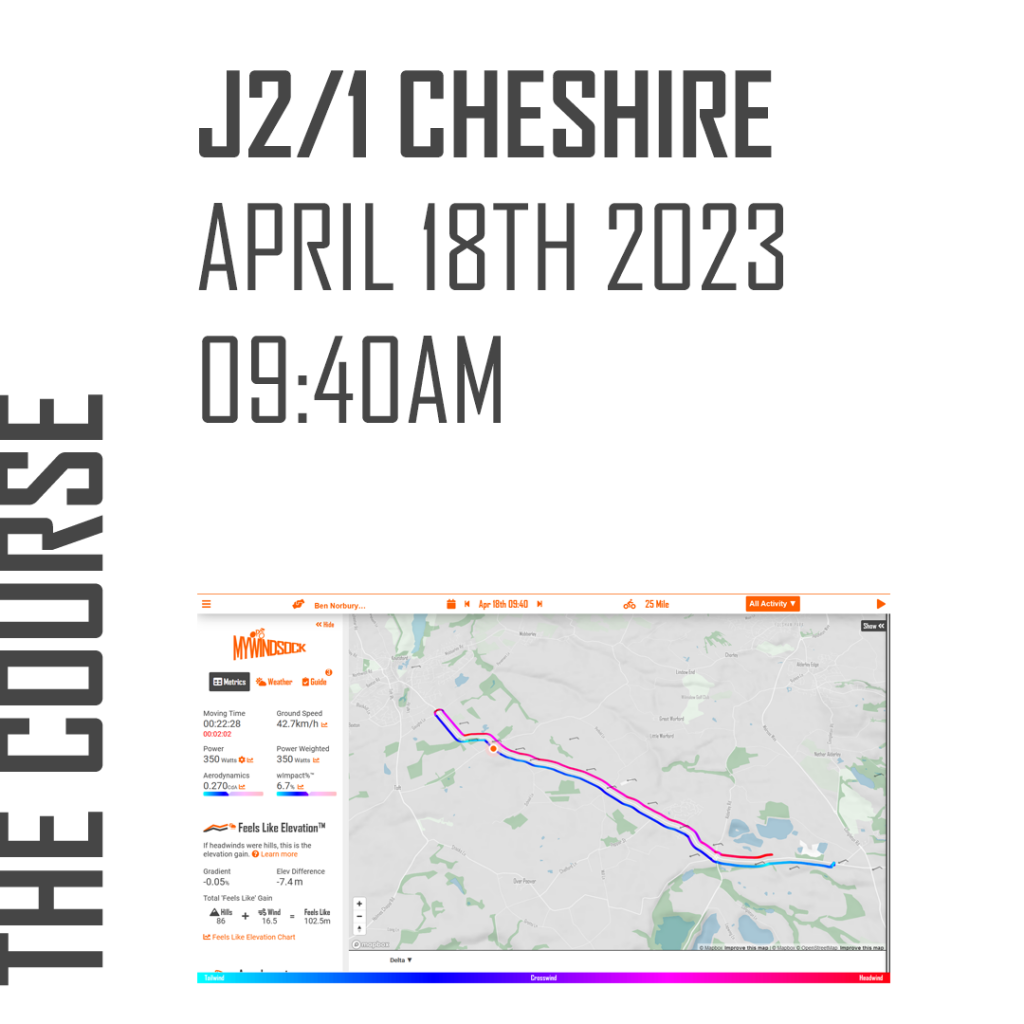
The course we chose was a typical UK 10 mile time trial course. You can view this course here. All Cycling Time Trials courses are available to view in myWindsock.
The Result
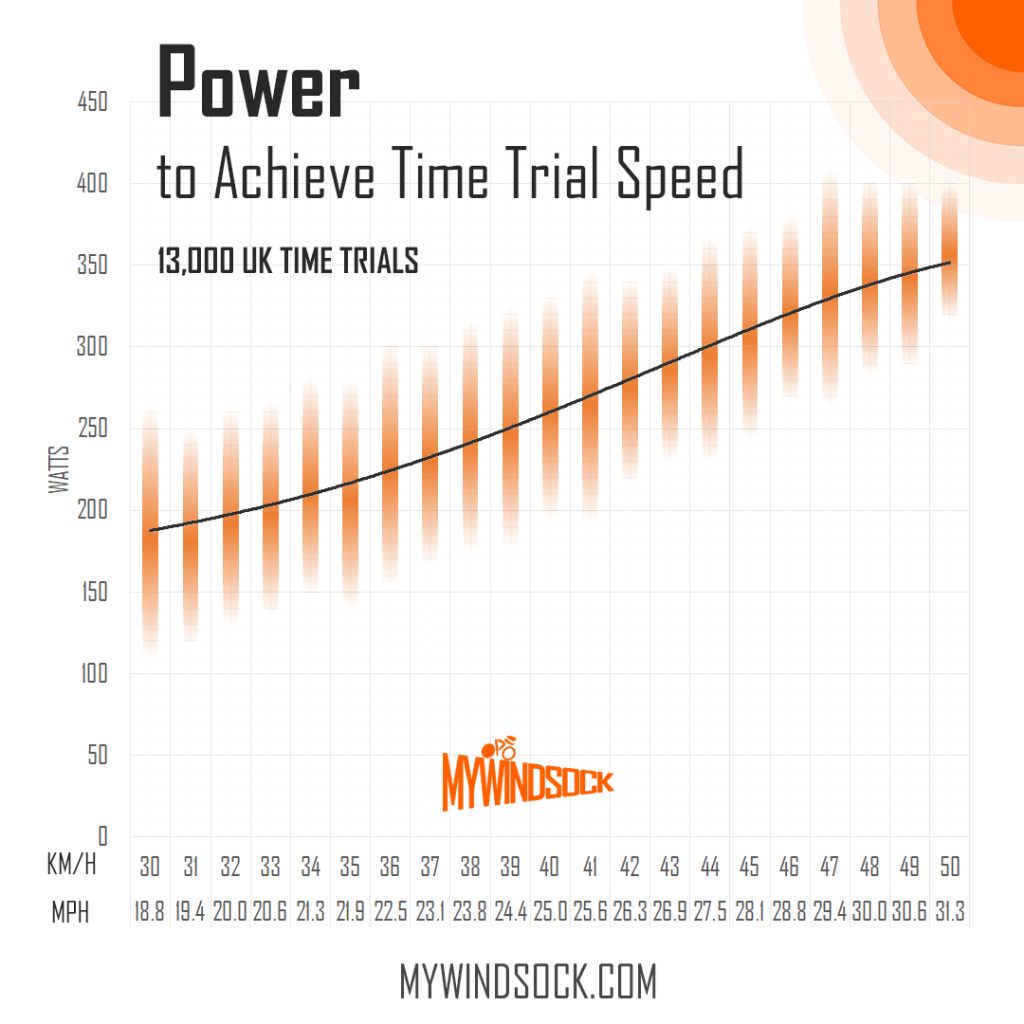
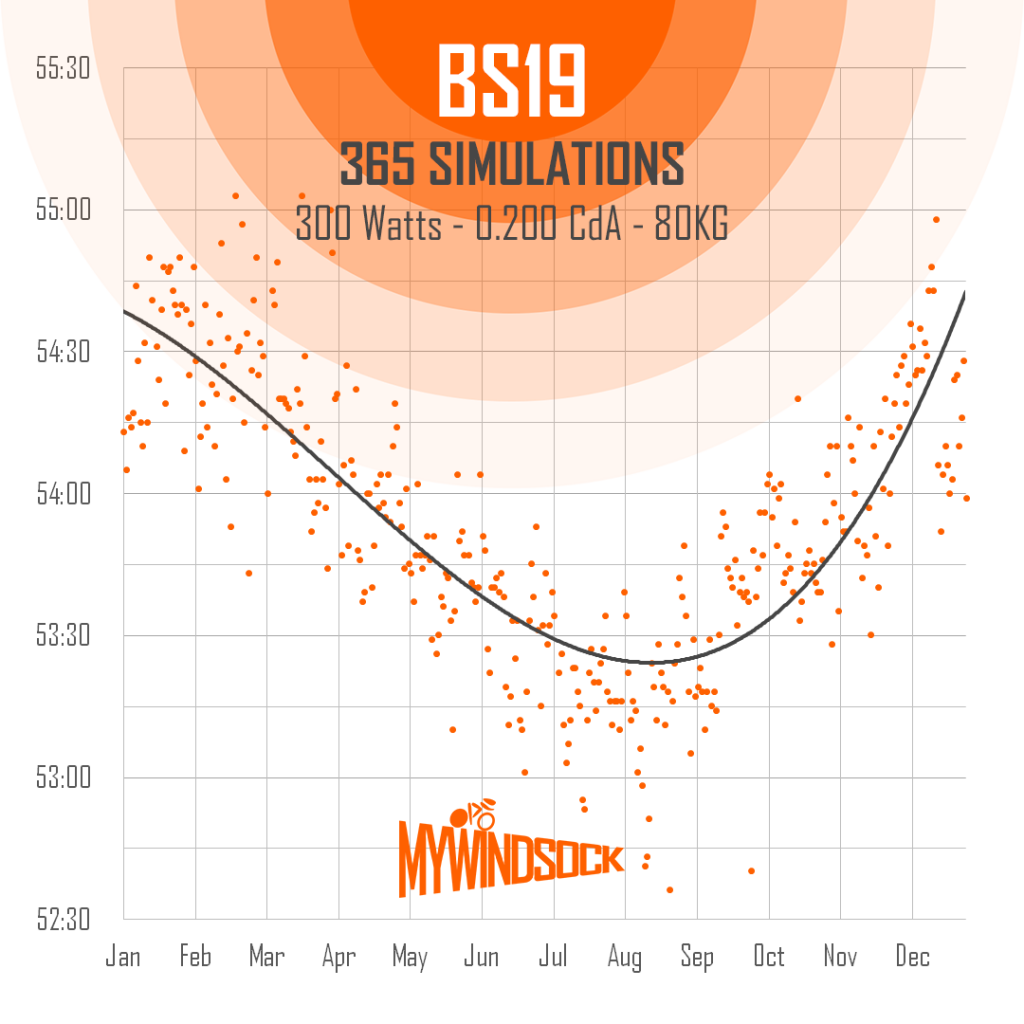
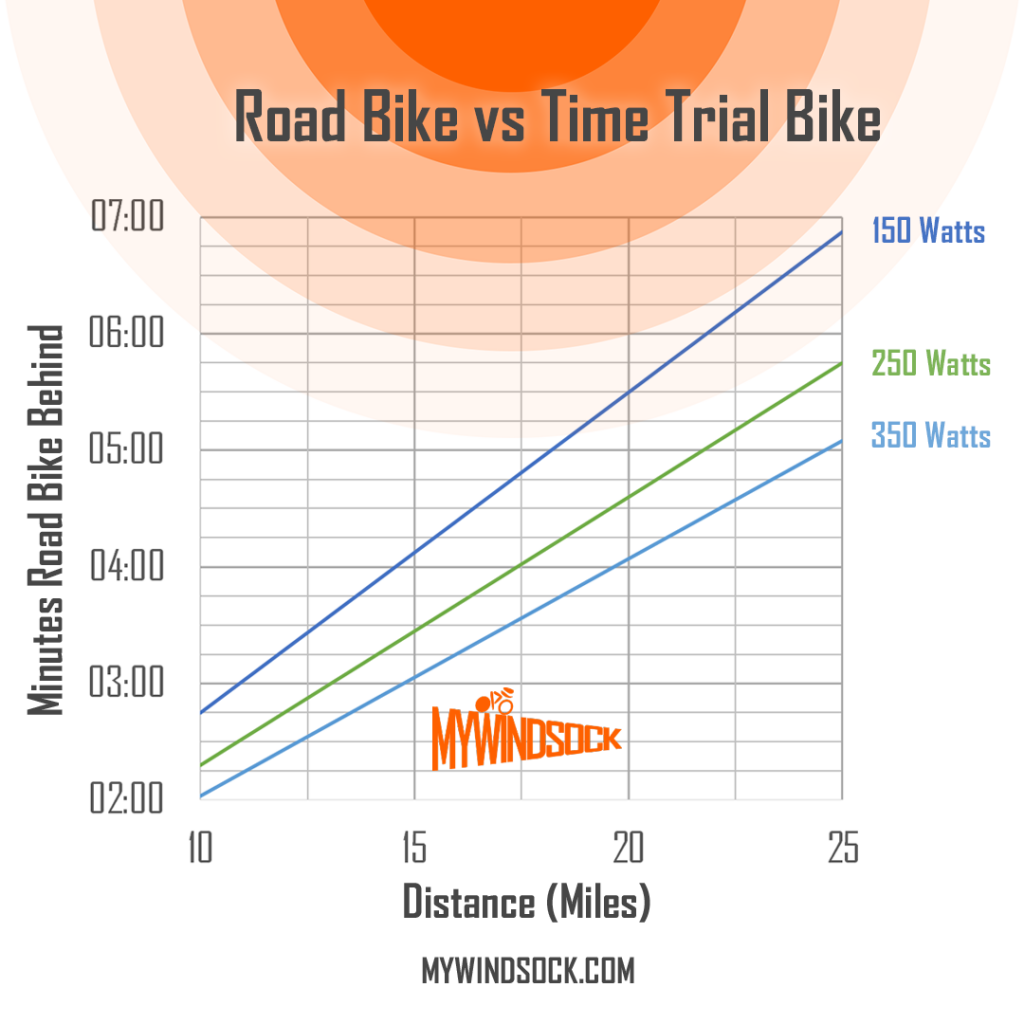
Below are the results of the test. On the left we have the time lost by the road bike and the distance travelled along the bottom.
Conclusion
As expected the time trial bike is significantly faster than the road bike. For a rider producing 150 Watts they will lose close to 7 minutes on a road bike. We often hear people saying “I’m not fast enough for a time trial bike”, however what is clear from the above graph is, the less power you have the more time you will lose choosing the less aerodynamic option. In terms of absolute time savings, a TT bike is better value for a slower rider!
Why is a time trial bike faster?
A time trial bike is designed to be faster than a traditional road bike, hence the price hike, in time trials for a few key reasons:
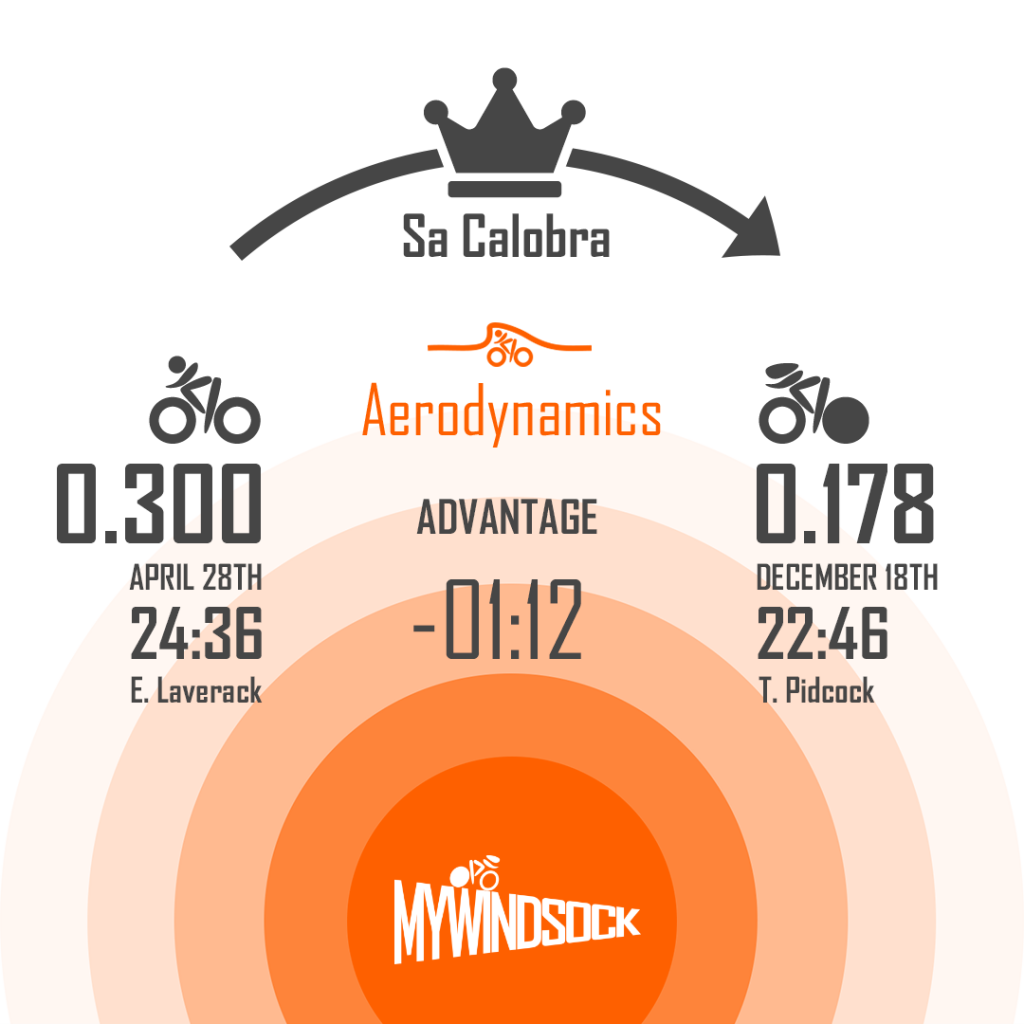
- Aerodynamics: Time trial bikes are designed with aerodynamics in mind. The frame, wheels, and components are shaped to reduce air resistance, allowing the rider to move through the air more efficiently. Much of this comes from the position the rider is able to hold due to the arm rests and aero-extensions. This position is not allowed in traditional bunch racing due to the chance of a crash as the brakes can’t be immediately reached.
- Geometry: Time trial bikes have a more aggressive geometry than traditional road bikes, with a steeper seat tube angle and longer top tube. This puts the rider in a more aerodynamic position than they’d be able to achieve on a road bike with clip on bars, reducing wind resistance even further.
- Integrated components: Time trial bikes often feature integrated components, such as handlebars and brake levers, which further reduce drag and streamline the bike’s profile. This can make them difficult to work on – often turning what would be a simple fix on a road bike into a complicated job for a mechanic in a bike shop.
- Wheel choice: Time trial bikes often use deeper section wheels, which are more aerodynamic than traditional road bike wheels. Wheels deeper than 90mm aren’t allowed under CTT’s (the UK’s governing body for time trials) road bike TT rules.
All of these factors combine to make time trial bikes faster than traditional road bikes in time trials. However, it’s important to note that time trial bikes are not necessarily faster in all situations. They are designed specifically for time trials, and may not be as comfortable or efficient for longer, more varied rides.
If you’re looking to get into time trials but are worried about not having the right equipment – Cycling Time Trials have introduced a road bike category at all their events! Make sure you’re prepared with myWindsock – perfect for planning and analysing your time trials.