


The Lands End to John O’Groats record holder, Christina Mackenzie is taking on another formidable test of endurance. On Friday 13th of May, she will be attempting to set the a new North Coast 500 record. The 500 mile route, around the Scottish Highlands, climbs a huge 10,000 metres. That elevation gain is more than an everesting attempt!
In prepartion for the event, Christina and her team have been monitoring the myWindsock forecast. RRA record breakers, are using myWindsock forecasts to help understand the demands of record attempts. Here are few things that have caught our eye.
Power and CdA numbers are for demonstration purposes and not that of the record attempt.
Wind gusts up to 33.6mph
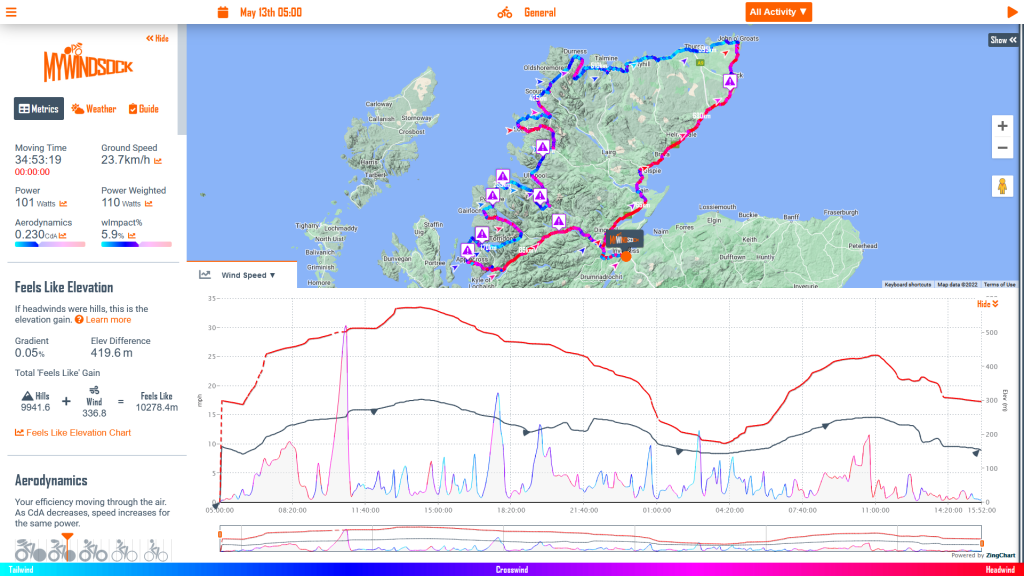
It’ll be a very windy record attempt. The purple triangles indicate potentially hazardous crosswinds. This may impact equipment choices for these sections of the ride. The wind will affect overall speed. It is anticipated that Christina’s average air speed will be 1km/h higher than her ground speed.
18hrs of Headwind
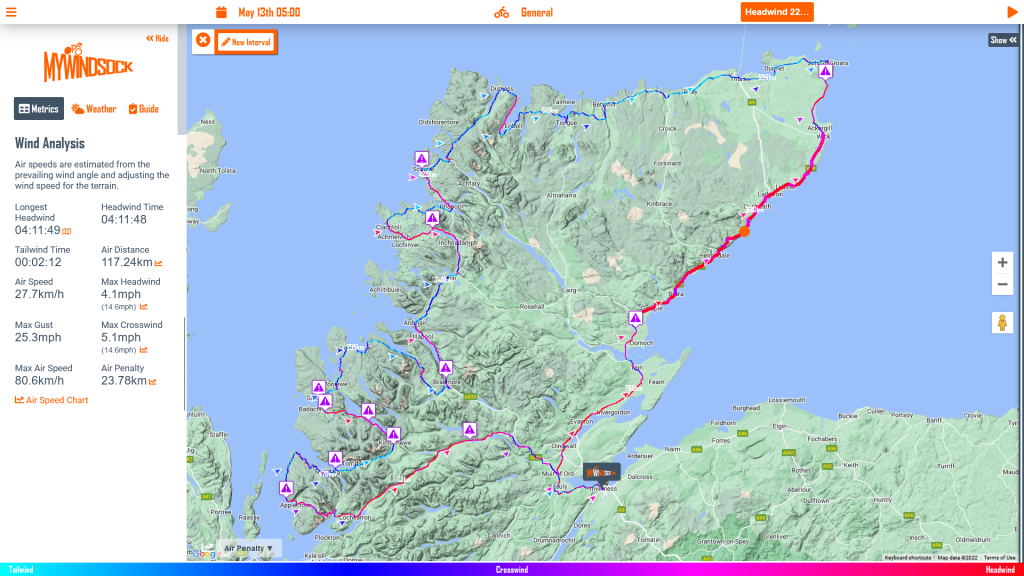
Of the 18hrs of headwind we think the toughest section will be the 22nd Headwind of the attempt. This is 4hrs between Wick and Loch Fleet, happening from 7am, 26 hrs into the record attempt. The average forecast wind speed here is 12.5mph gusting to 23mph. Air Speed here will be on average 5kmh higher than her ground speed.
How will the ride feel
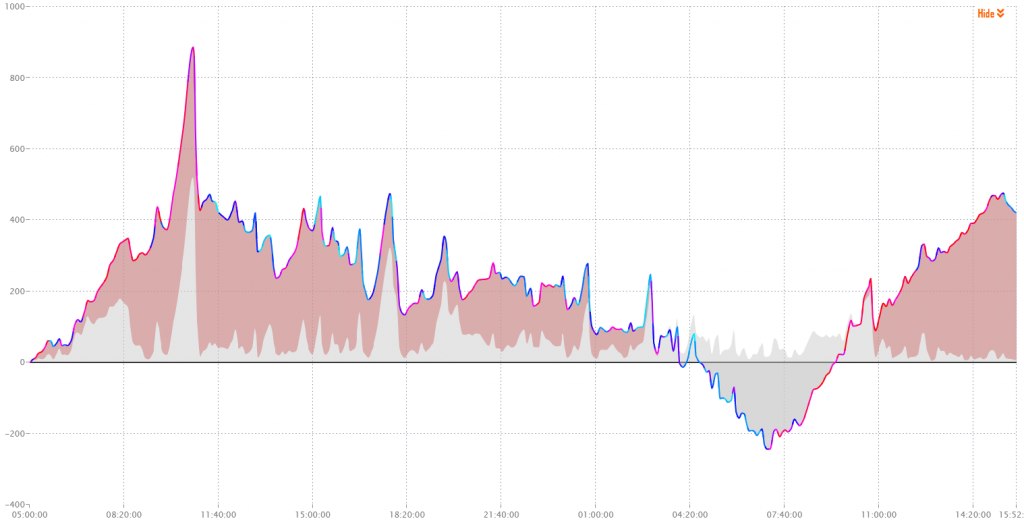
When we combine the wind with gradient we get a new perspective of road feel. We call this Feels Like Elevation. The red sections show how much greater the road feel has been overall due to the weather. After the summit of Bealach na Bà the areas of red begin to reduce indicating that the road feel has become easier, there is now assistance being provided by the wind.
In fact by 7am, 26hrs into the attempt, the weather will have been to Christina’s advantage. From this point however we see the Feels Like line begin to ascend and exceed that of the terrain. Eventually the weather will give an additional penalty of 434 metres Feels Like elevation gain.
Speed Expectations
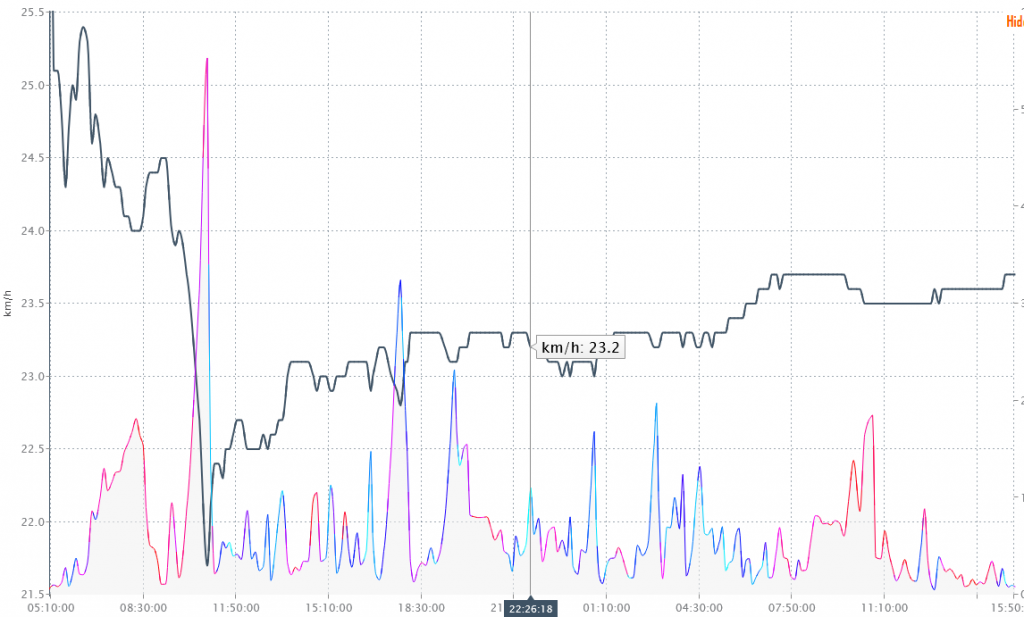
Average speed can vary considerably during record attempts. Inevitably, when a rider sees average speeds are below what is required for the record, they can be anxious. The crucial thing is to have the data to support decision making. Have the data of rolling average speed throughout the record attempt, will give a far better indication as to whether a change of plan is required.
Where will aerodynamics play the biggest role?
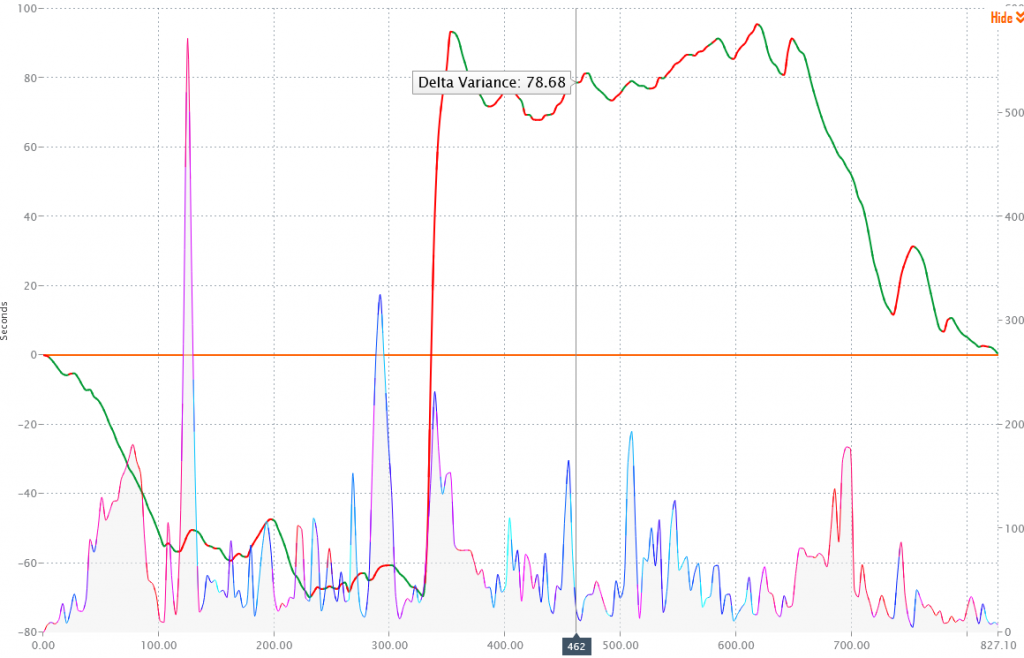
With a quick experiment we can find exactly where Christina should be focusing on aerodynamics the most. We simply reduce her CdA by a small amount. Then, by viewing the Delta Variance Chart, we can see in Green the parts of the course her aerodynamics are most important.
We have no doubt Christina will be focused on aero throughout. However, inevitably on a 34 hour ride to be 100% locked into position is probably unrealistic. Therefore, the red sections offer some opportunity to stretch and relax, a little. Where as the Green sections indicate where it is very important to maximise aero.
Good luck Christina

We wish Christina and the team all the best of luck. If you would like to support Christina’s charity, you can donate to the Cruse Bereavement Scotland Charity through her Just Giving page.