


The 2022 time trial season is just around the corner. In this series, I’m going to show you how I would use a myWindsock forecast, to prepare for the first Cycling Time Trial event, the Ely & District 25 mile SPOCO on BS19.
PLEASE NOTE: Weather forecasts are updated hourly, this forecast may have changed from the time this article is published. View the forecast for yourself here.
In this first part we look at how understanding the challenges of the course weather so we can prepare a mental strategy. This is what we refer to as the Descriptive side of myWindsock. We are describing race day, so you have all the information required for optimal mental preformance.
In our second part we will look at the Prescriptive tools. We will show you how to formulate the optimal power plan.
First thing, we need a Virtual Athlete to Ride the Course
We want to ensure everything we are looking at reflects our performance on the day. To do this, we need a Virtual Athlete (VA). Your Virtual Athlete will ride the course as many time as you like, with infinite setup choices. The beauty of your VA, they never get tired!
In the next part of this blog series, we will look at how to use your Virtual Athlete to formulate the best race plan. For now, we just need to have a good estimate of race day performance.
You may want to create a new Virtual Athlete for this race distance, I have one simply called “25 mile”. I will use this as the basis to begin all 25 analysis and then, as we will learn in the next post create a race specific VA for the event when I come to plan power.
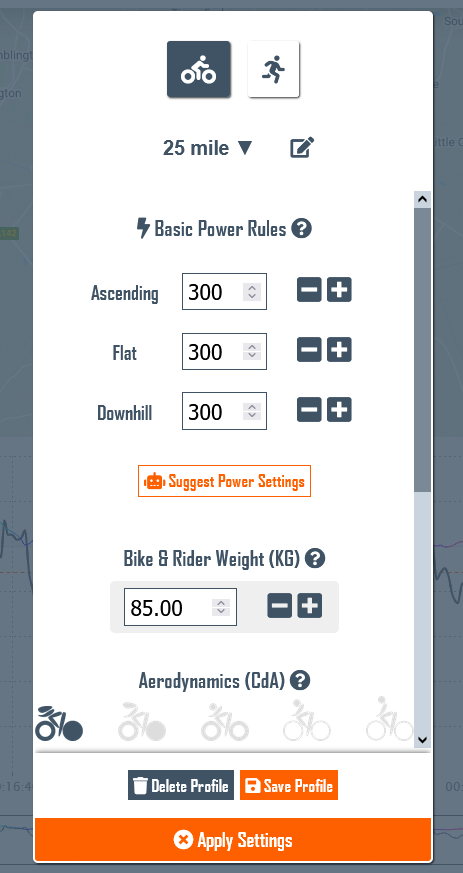
Often I am asked about what to enter for aerodynamics. You can use this post to find your CdA from a previous race activity. You can also use the icons to guide you. For time trials if in doubt use 0.200.
What to expect
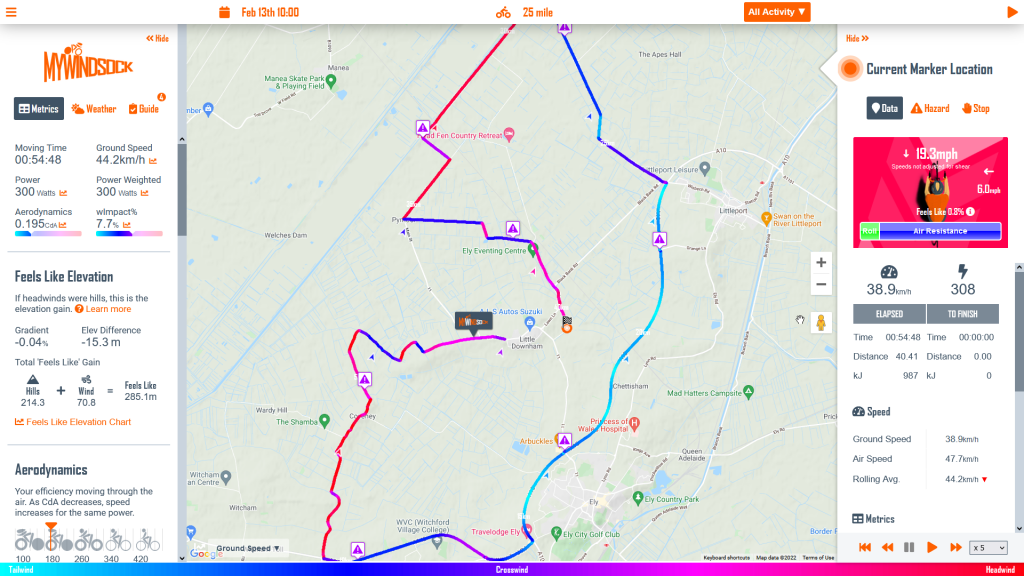
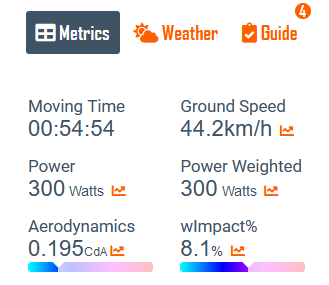
We start in the Metrics tab. My attention is initially drawn to the Moving Time and average ground speed. Notice that we refer to ‘Ground’ speed rather than simply ‘Speed’. This is because we also have metrics for ‘Air’ speed.
Power and Aerodynamics are as we have set for out VA.
Weather Impact is quite high at 8.1%. This tells us, for me to achieve the same time as on a weather free day, I’d require an additional 8.1% power. Find out more about Weather Impact.
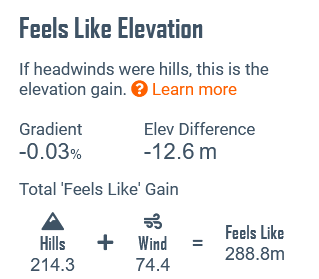
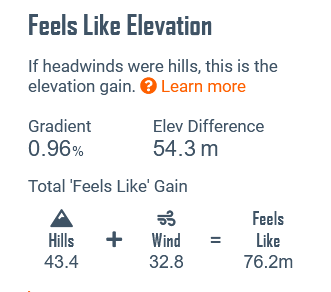
Moving down the metrics panel we have our Feels Like data. Feels Like gives us an alternative way to view the wind. We equate the wind to it’s equivalent gradient. Why? Well, I find it is easier to imagine a how difficult a gradient will feel. Whereas, the combination of prevailing wind direction, wind speed etc. is more difficult to imagine.
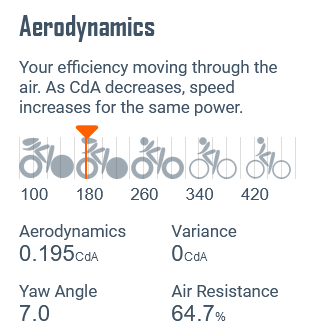
Next, we move down to the Aerodynamics panel. There are two pieces of information we should be aware of. First is Yaw Angle. This is the average Yaw, we have a chart showing the Yaw distribution, to help make informed equipment choices. I have a couple of wheelsets and some technical data on them that gives me the best operating Yaw angles.
Also in Aerodynamics we have the Air Resistance. This is the percent of your power absorbed by air resistance.
Weather Overview
Our Virtual Athlete has now collected data at the correct speed. So now the data will reflect the correct time and locations for our weather data. Let’s take a look under the Weather Overview.
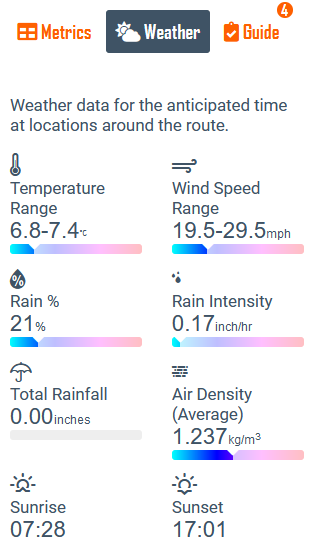
The above numbers are an overview of the data collected from around the course. It is forecast to be a chilly ride with strong 19.5mph average wind speed, gusting up to 29.5mph. Some rain may be present.
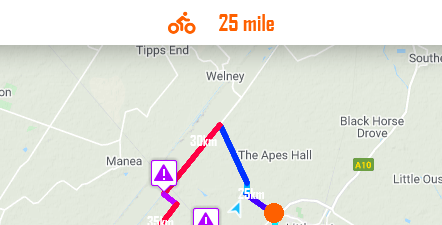
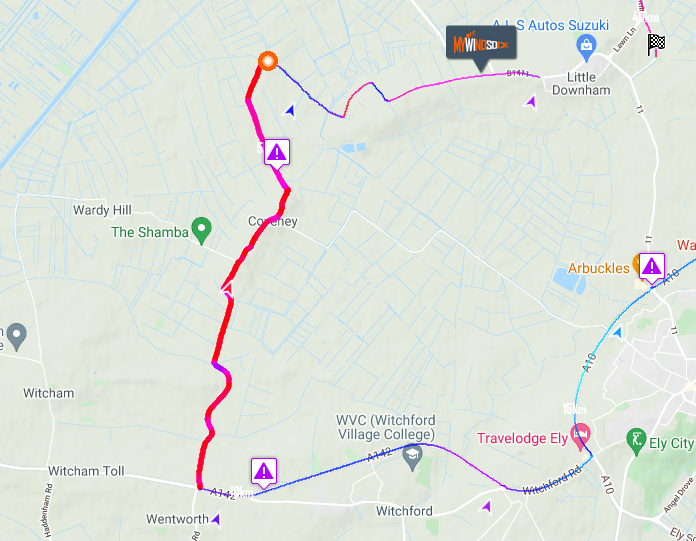
The headline from the forecast has to be the 20mph plus wind, so our next stop is to see where that wind will be on the course. We head to the Course Navigator.
Finding the Headwinds
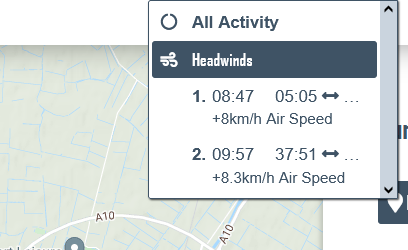
First thing we note is that there are no significant climbs listed. However there are Headwinds.
Two headwinds are brought to our attention, each around 9-10 minutes in length. The first starts 5 minutes into the ride, then the second almost 38 minutes in. We also note the additional 8km/h air speed, this is quite significant. Why 8km/h. We calculate this additional air speed from the prevailing wind angle, wind speed and wind shear, which is the slowing of the wind close to the ground.
To see each headwind we simply click the headwind we are interest in. This highlights the headwind on the course so we can visualise where to expect the wind to start and finish. This also creates metric summaries for the selected portion of the ride.
How to use this data
Why do we need this information? By understanding how the headwinds will affect our performance, we can create an effective mental strategy.
What usually comes into your mind when racing through a headwind?
I’ll tell you what comes into mine.
Sometimes, I can be defiant, “I’m not going fast enough”, “I need to push harder”.
Then there is, “this sucks”, “I’m having a bad race” and “today’s not my day, I don’t have the legs”.
Non of these thoughts keep us in a calm high performance mindset and are likely to sabotage a race performance. To combat these thoughts we need facts as our weapons. This is where our analysis goes next.
By being mindful during a race we can discover what information we need to have. This is personal to you. However, I will outline from my experience what helps me.
- When and where to expect the headwind to start.
Use the map and the Course Navigator to ensure we know the start position. - Know what the affects of the headwind will be
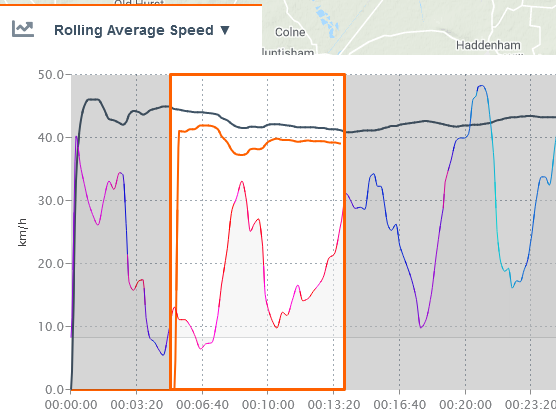
- Check the Average Speed Graph. How much does the speed rise all fall during the headwind. This helps with any thoughts around not going fast enough.
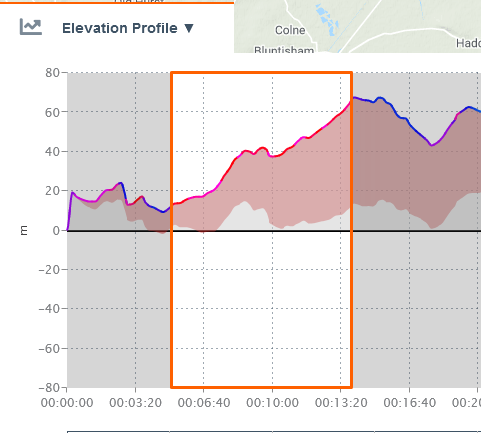
- View the Feels Like Elevation chart to visualise how the headwind relates to gradient. You may find it helpful to imagine this theoretical hill you are climbing. Imagine the summit to be where you know the headwind finishes.
- Know where and when the headwind will finish
We repeat the above for each of the significant headwinds. The crucial part of this planning phase, what we call the descriptive phase, is to minimise the unknowns. I think of it this way, if we were tennis players we would expect to know what court surface we would be playing on. The weather poses as much of the race day challenge as the distance and terrain.
In our next post we plan the optimum power strategy.