‘Feels like’ Elevation allows you to mentally prepare for the event you have coming up. A huge part of racing is being prepared and knowing the course you are going to be riding.
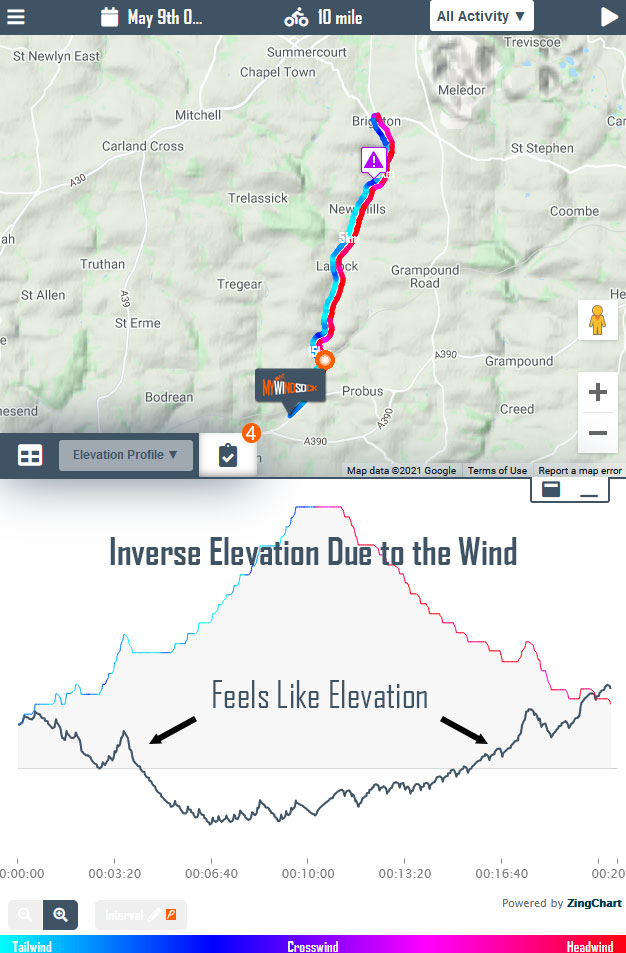
With this graph and metric you will get a perspective on the effect the wind will have. This will give you a better and clearer image on how to pace yourself during a race so you don’t burn yourself out. Our graph allows you to visualise the wind, like you would the summit of a hill. Have a look at this event The S6/10 Tri-Logic Event time trial.
This course is up hill on the way out to the turn and downhill on the return. However with the added tailwind on the up hill and headwind on the downhill, on this particular day, the course would feel flipped. The uphill with the assisted tailwind would require less effort and power and would actually feel like you were going downhill.
The headwind is very harsh and strong on this particular day and would make the downhill would ‘Feel Like’ an uphill effort. Find out more about ‘Feels Like’ Elevation graph and metrics.
We have all the UK Time Trials ready for forecasting each week. Discover the ‘Feels Like’ elevation for your next race in our Time Trial Events section.
Discover your CdA, how aerodynamic you are, from past races. myWindsock can analyse all of your Strava Activities, Segment Efforts or uploaded TCX file from your power meter data. To use the features described you will require Premium membership and power meter, learn more about Premium.
IMPORTANT: Please ensure you disable Auto Pause on your GPS device when field testing.
What your CdA is and why it’s important
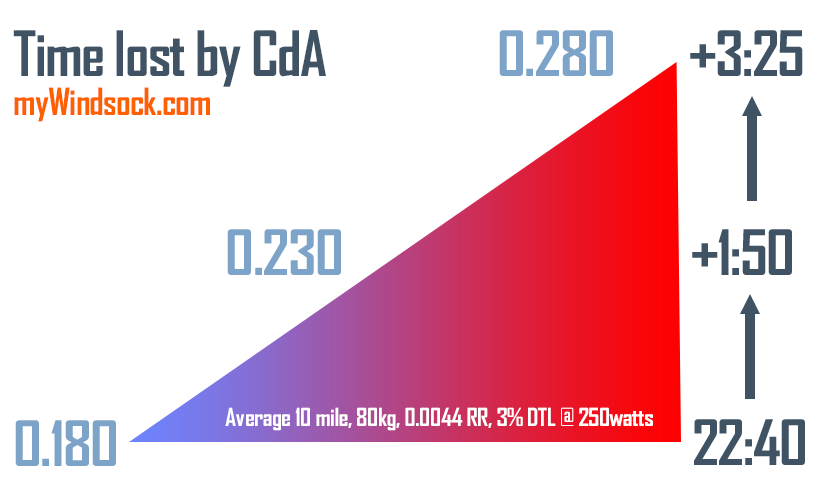
Knowing your CdA is useful to help you improve and squeeze out as much speed from your power. In most cases the most important determinant of performance in time trials is not Watts/Kg it is Watts/CdA. Here are a few ways you can use this number to improve your future time trial performances.
Improve your position – small changes to your position can make large changes to your CdA. Make purposeful changes and record how your CdA changes for better or worse.
A measurement of position discipline – when the adrenaline is pumping and you’re cranking the pedals as hard as possible it is easy to loose focus on position. Post race you can discover how disciplined you were at maintaining your position during the race. It is another performance measurement very much like your wattage.
A more accurate time prediction – Entering a measured CdA into the Performance profile for your next race will dramatically improve the time prediction myWindsock generates. This means charts such as Rolling Average Speed will be of greater accuracy for your next race.
Short video tutorial
This video shows how to extract the CdA of a the time trial from the ride file or Strava Activity and how to ensure your CdA is comparable to other time trial CdA measurements. Most of this is covered in the video however below the video I have included some further explanation and tips.
Loading up your time trial
To analyse your time trial there are two methods of upload to myWindsock.
Through your connected Strava account, simply click on the Activity from the Strava Connect menu.
Or from the course Strava Segment myWindsock forecast go to > Leaderboard Weather > My Efforts and select the effort. This requires power data to be included in your Strava upload.
If you prefer to keep your ride data private you can upload directly to myWindsock from the homepage using the ‘ GPX/TCX’ button.
Creating an Aero Test profile [Optional]
This is a recommendation and not required, but will ensure your CdA is not affected by changes to your Profile settings. It is easy to forget the settings previously used for Weight, Rolling Resistance and Drivetrain Loss when calculating previous race CdAs. To keep it simple it is recommended to keep a profile for just CdA calculations.
This assumes that race to race you haven’t changed these actual values and they remain static in the real world. If you have altered tyres, gained/lost weight, changed the location of your power meter or the course has a significantly different road surfice, you may need to factor these changes in the CdA calculation.
Viewing the CdA of the Time Trial
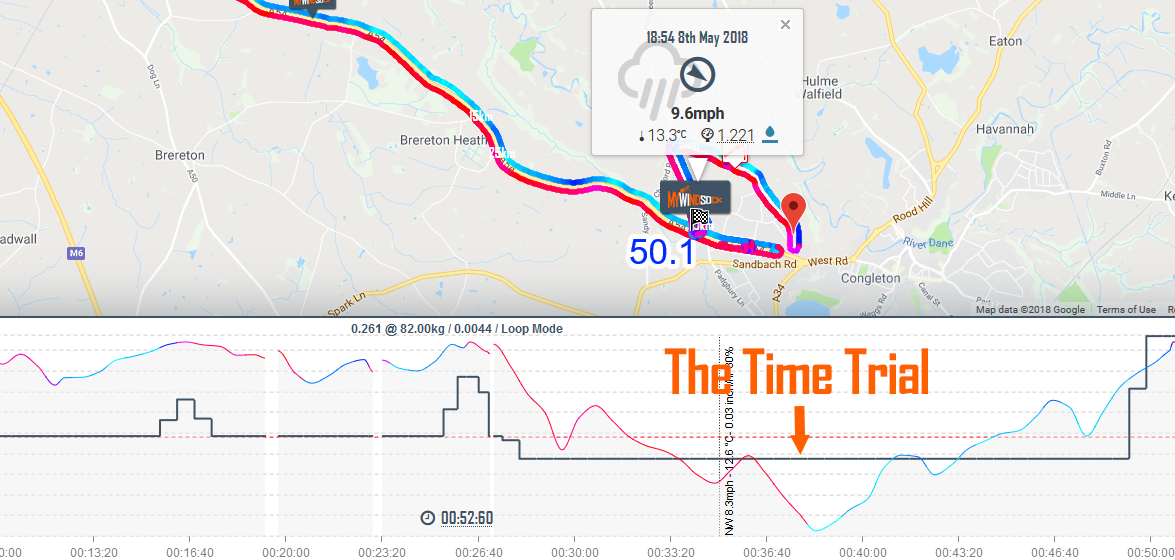
The average CdA for your ride may include your warm up and cool down CdA. To extract the the time trial CdA you will need to access the ‘CdA Profile’ chart. Locate the line in the chart that represents your time trial. If your activity includes wam up and cool down your time trial is likely to look like the below. The point to point CdA of an out and back course is usually easy to spot.
The CdA for your time trial
“I used my brakes, is that a problem?”
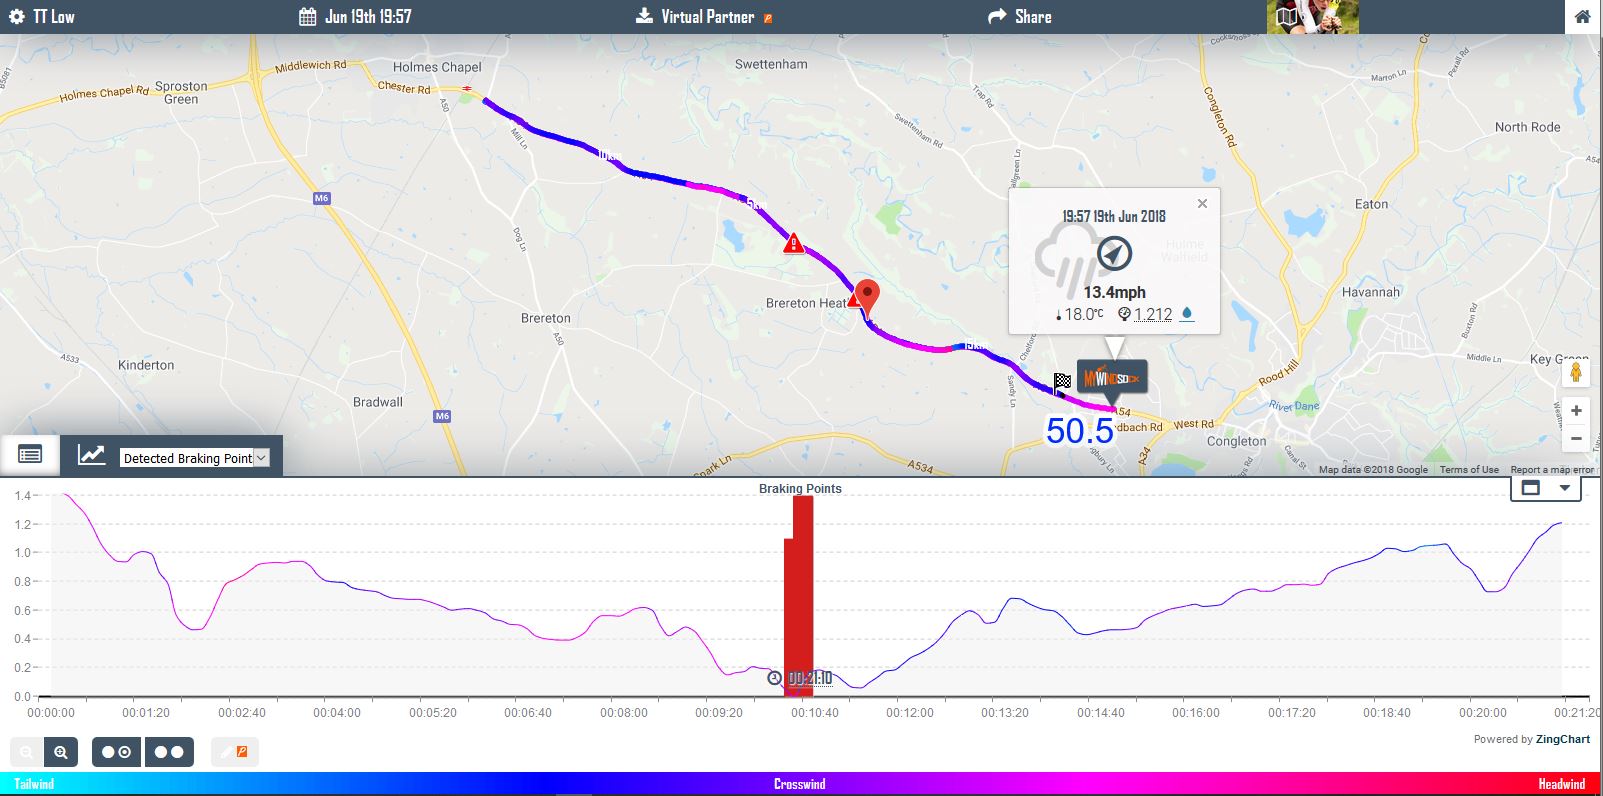
Braking will affect CdA calculations, however myWindsock can detect when you brake and remove these moments of braking from your CdA calculation. View the chart ‘Detected Braking Points’, this chart shows where on you ride you braked. Using this information we can remove the brake elements from your CdA calculation. This dramatically improves the accuracy of your CdA calculation.
Detected Braking Points in an Out and Back time trial.
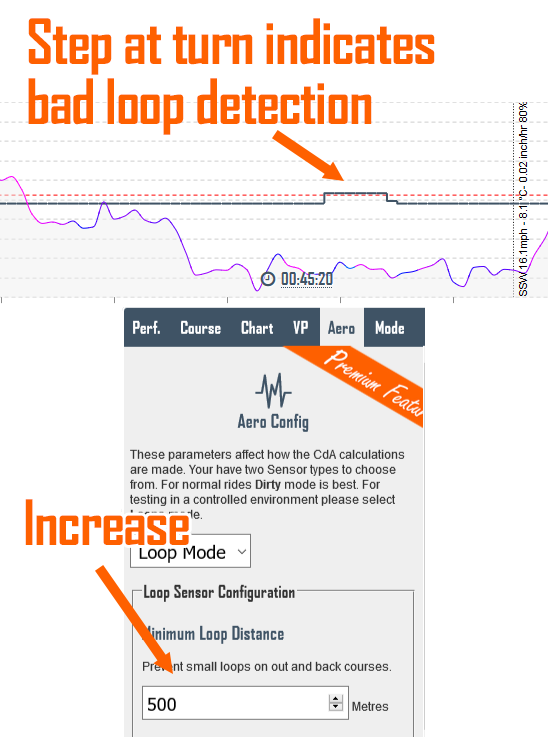
My CdA line has a step at the turn
The best CdA is calculated from a route in which you pass the same point of road twice. This can either be in the same direction ‘A loop’ or in opposite direction ‘out and back’. If your time trial course is slightly longer in one direction, so the start is up the road from the finish, this bit will not be as accurate and is probably shown on a different line. This uses elevation information rather than the more accurate loop. Look to the line that covers most of the time trial from two identical points on the course.
If at ‘the turn’ you have a different CdA experiment with increasing the Minimum Loop Distance. This will ensure a loop detection for more of your time trial.
Increasing minimum detectable loop will remove step for better CdA calculation
Go to > Settings > Aero Firstly increase the Minimum Loop Distance to a bigger distance but less than the distance of the two points on the course that you cover twice in the time trial. If this doesn’t resolve a better CdA line reduce the Loop Tolerance by a point.
A quick note on Yaw angles
A difference in wind direction and wind speed can produce a different CdA calculation. The greater the wind speed difference the larger the difference of CdA will be for the same position. Your position’s CdA will be better or worse for various Yaw ranges.
Bike speed, wind speed and it’s direction relative to the bike alters the yaw angles and effectiveness of your aerodynamics.
Yaw is determined by your speed and the wind speed and direction. The best description I’ve heard for explaining yaw is to think of the angle that a balloon held on a string would make to the bike if you were to hold it whilst moving. In a crosswind as you increase your speed the angle of the string to the bike reduces.
So in extraordinary weather you may expect to see a very different calculation of CdA. It is therefore best to discount these days.
To use the features described you will require Premium membership and a power meter, learn more about Premium.
A very quick overview of aero testing with your Premium account. To use Loops Mode for field testing from your activity go to > Aero and then change the mode to ‘Loops’.
We’ve looked at setting up the forecast and understanding the map. Let’s take a look at some of the key charts for Time Trialists that will help you plan for your upcoming race. Some of these charts require Premium membership, please take a look at all the extra features of Premium including many of these charts here.
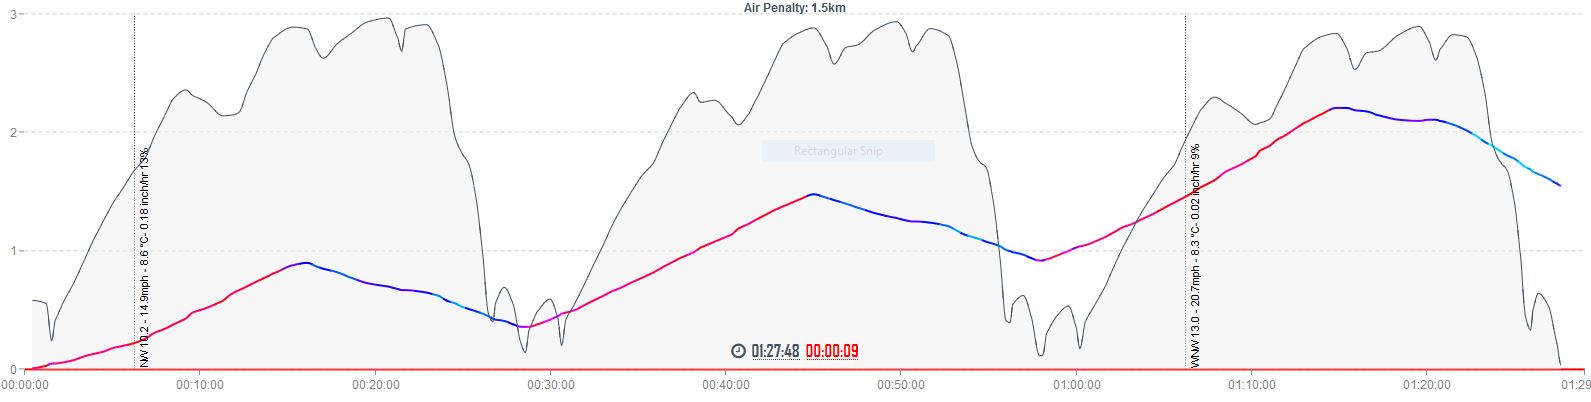
Air Penalty Chart
Air Penalty, the accumulative difference between Air and Ground distance
What is it?
Shows the accumulative air distance. When the graph is rising (headwind) air distance is being accumulated faster than ground distance. When it is falling (tailwind) ground distance is accumulating faster than air distance.
How to use it
Where the AP line is rising expect greater air resistance. A steeply rising line informs you of sections where the headwind is at its greatest. In these sections expect ground speed to be slower. Where line falls there is less air resistance and your ground speed is likely to be higher than neutral conditions. Pay attention to how the rises and falls are distributed before a time trial to set expectations of ride experience. In other words how long will I have to grit my teeth into the headwinds.
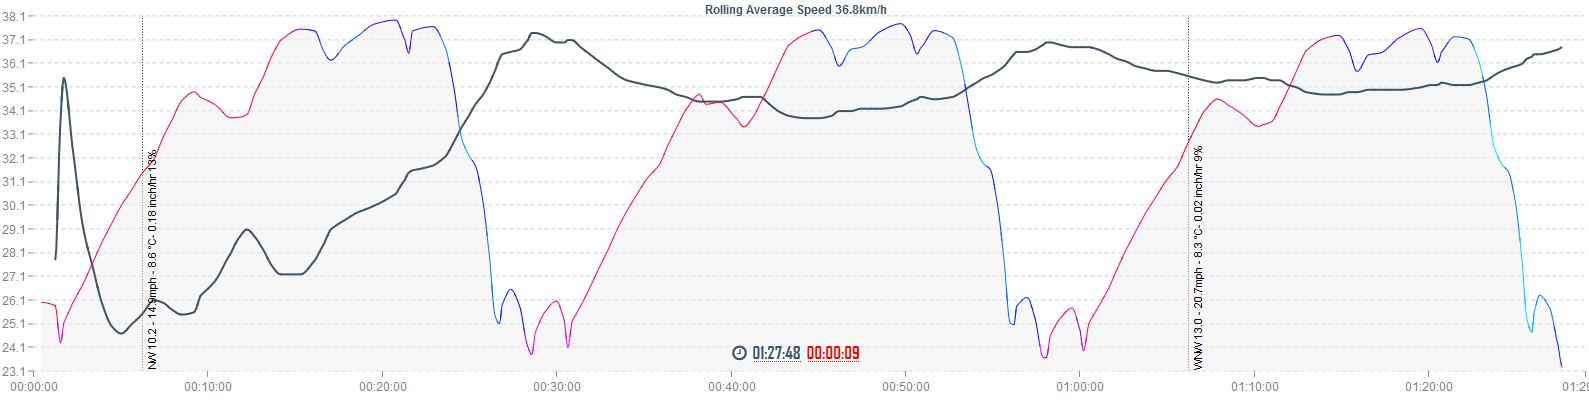
Rolling Average Speed
Predicted change in Average Speed throughout your Time Trial
What is it?
From the Performance settings you have entered in combination with the rolling weather forecast how will your average speed progress throughout the time trial.
How to use it
When monitoring your average speed during a race you should do so in context of how the entire race is predicted to unfold. On courses where there are fast starts and slow finishes your average speed is likely to be higher than your target average. Where slow starts are expected for example hills or headwinds your average speed will be lower than your eventual average. Being up or down on your predicted rolling average will give you a much better understanding of how you are performing rather than your overall target average speed.
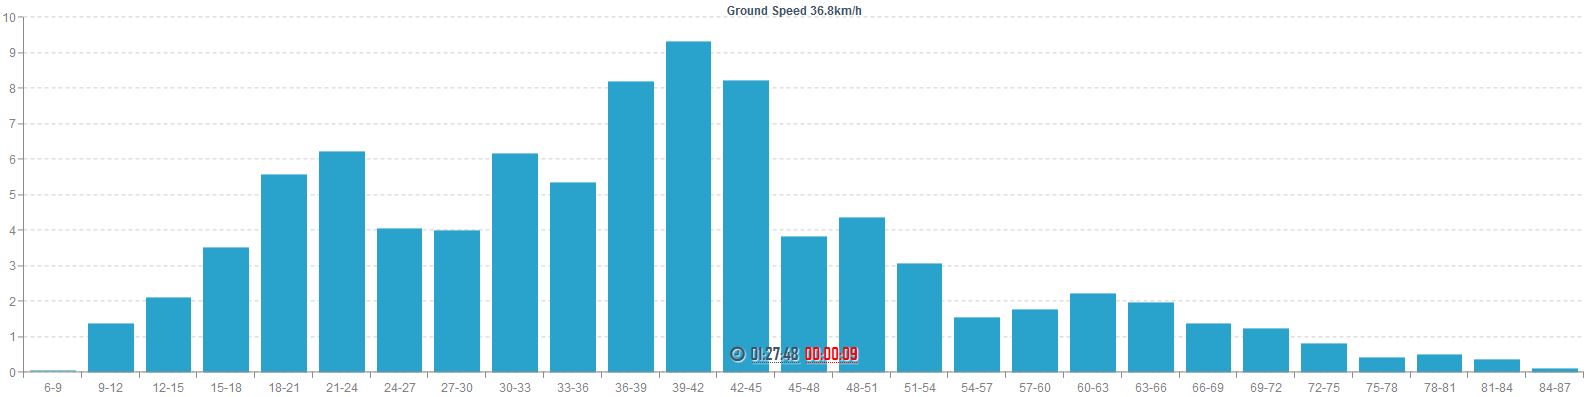
Ground Speed Distribution
Time spent at each speed range.
What is it?
Displays the predicted speeds and time spent at within each speed range.
How to use it
This chart has many uses and is critical for those choosing to ride a fixed gear. Chainline efficiency on geared bikes can be improved by ensuring the cassette and chainring combination has the straightest chainline when at the speed most frequently encountered. Overall average speed can be misleading when making these calculations as often this is affected by large periods below and above this speed. The highest peaks are key speeds to gear for.
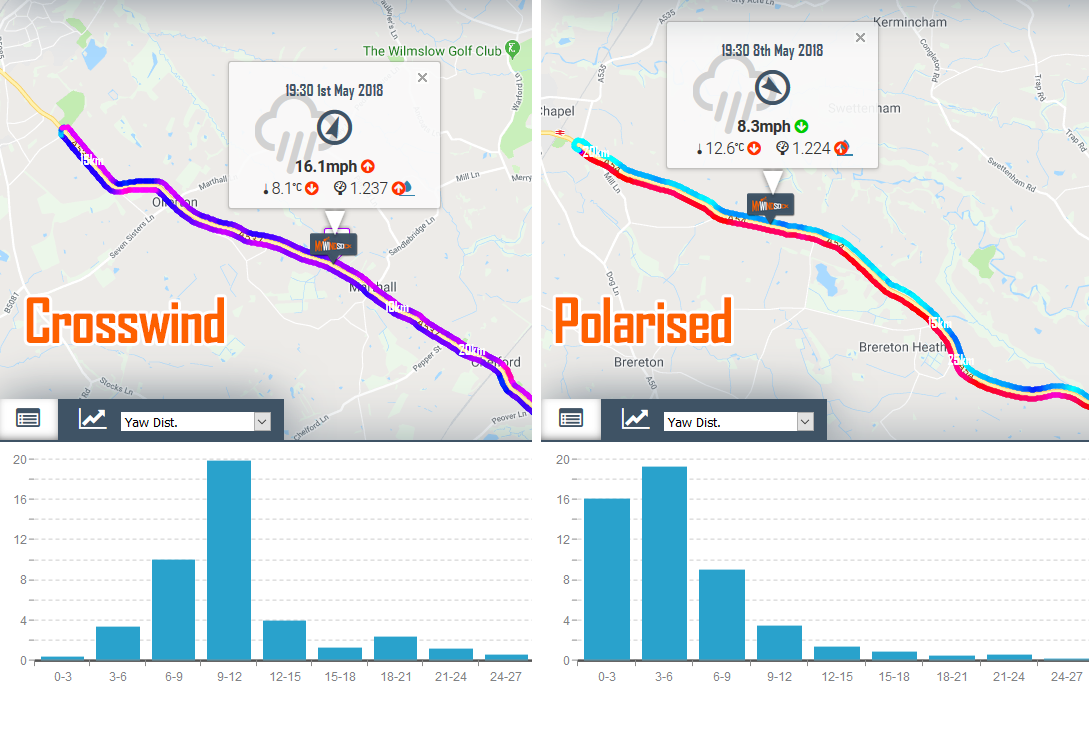
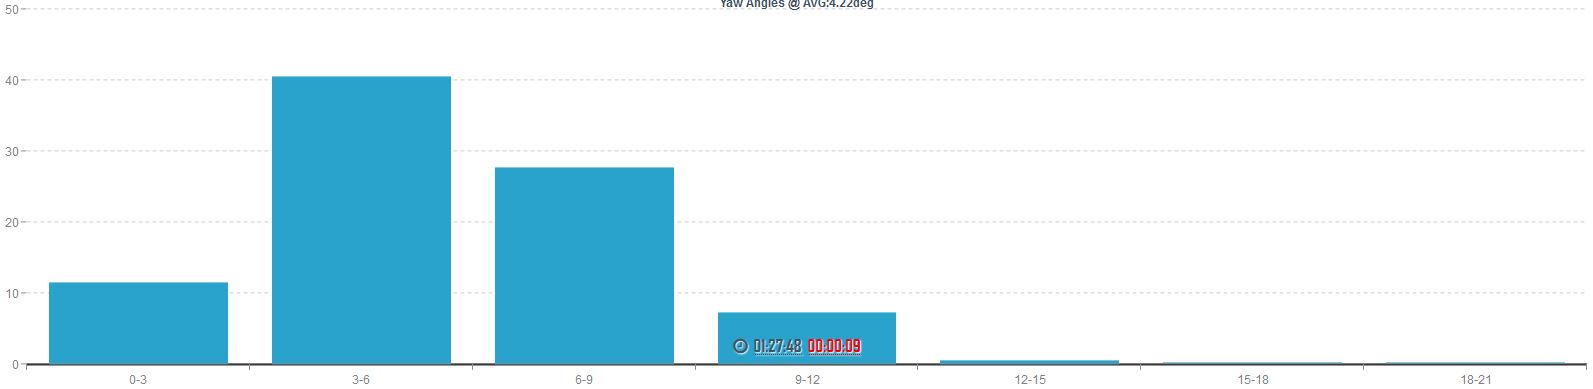
Yaw Distribution
Time at each Yaw angle range.
What is it?
The predicted Yaw angles produced by the prevailing wind. A windless day would produce 0 yaw. High crosswinds will increase yaw angles. Increasing a bikes ground speed reduces Yaw angles.
How to use it
This is one for those who have the luxury of equipment selection. Choose the equipment you have available that has been shown to produce the lowest CdA for the most frequently anticipated Yaw angle. For example perhaps the long tail helmet will work better for you on a low yaw day. Where as a stubby tail helmet may be better suited where the yaw angles are higher.
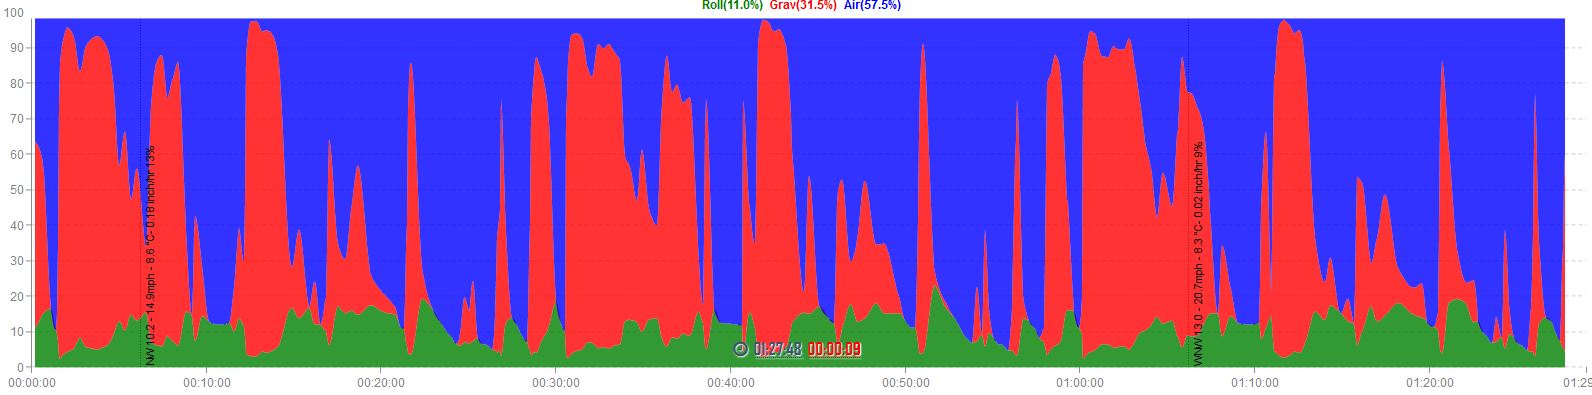
Resistance
Distribution of forces working against you. Air, Gravity and Rolling Resistances.
What is it?
Combining course weather conditions, elevation profile and your Performance settings this graph depicts the distribution of resistances working against you along the course. Large Red sections show where Gravitational resistance is high in comparison to the other forces. In flat time trials the majority of the graph will be Blue as Air resistance is greater than Gravity and Rolling. Tailwinds will increase the proportion of Gravity and Rolling resistance to the overall resistance that prevents you going faster. A headwind on a hill will increase the air resistance component and reduce the Gravitational proportion of resistance.
How to use it
Look out for large section of Red (gravity) it may be more efficient to relax your position to avoid restricting power output. A Resistance graph predominantly Blue (Air) will favour a TT bike. If a graph is predominantly Red (Gravity) you may find a road bike set up more advantageous.
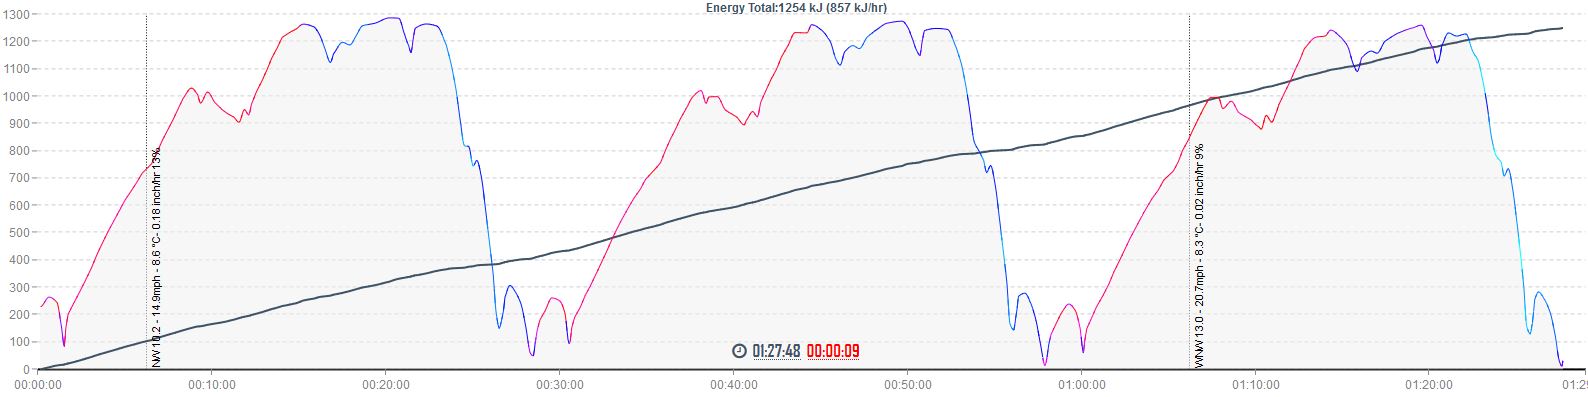
Energy Requirement
Accumulative energy requirements
What is it?
The accumulative energy expenditure throughout the time trial. The line will rise steeper where power out put is at it’s greatest.
How to use it
Beneficial to medium and long distance time trials where energy consumption is required during the event. The frequency and quantity of energy intake can be planned from this chart. You may choose to plan your feed stops/hand ups around the predicted times and locations. Ensure you have taken on sufficient energy with enough time for digestion prior to steep rises in energy requirement.
Now that we have the basics set up for an accurate time trial forecast, we covered this in part 1, we are now ready to assess the forecast.
Key weather map features for Cycling Time Trials
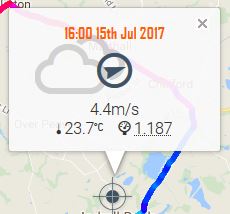
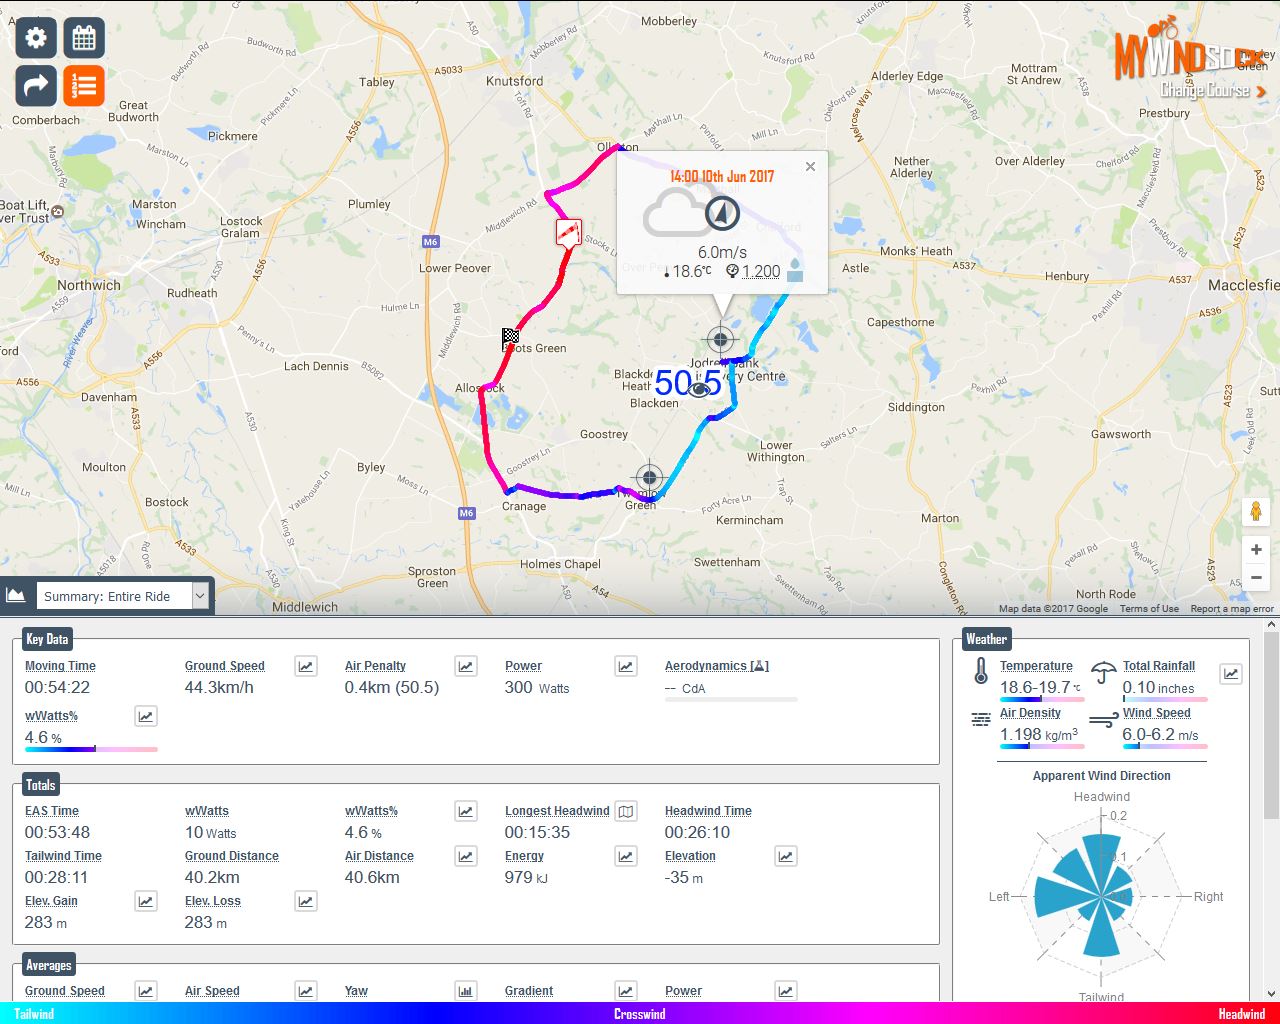
Weather overview: Every forecast has a weather overview at the start and along the route where changes to the weather are detected. Within the overview box the following details are displayed: Wind Direction, Wind Speed, Temperature and Air Density.
Weather Overviews are displayed along the course where weather changes are detected.
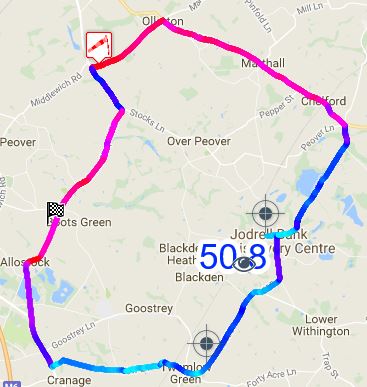
Wind Lines: The colourful Wind Lines illuminate the apparent wind direction along the course. Light blue indicates a tailwind, dark blue and purple crosswind and deep red a headwind. Use the colours to instantly see where the wind will assist or hamper your progress. Tip: You may consider increasing your effort into the red sections to limit your time exposed to the slower conditions.
Wind Lines show the apparent wind direction.
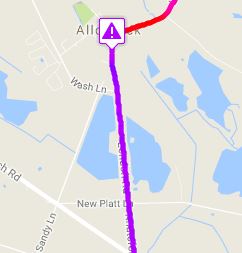
Crosswind Warnings: When running deep section front wheels knowing where the crosswinds are and how severe the wind speed will be is useful. When warnings are displayed a shallower rim width may be preferable.
Crosswind warning markers show where the crosswinds are at there strongest.
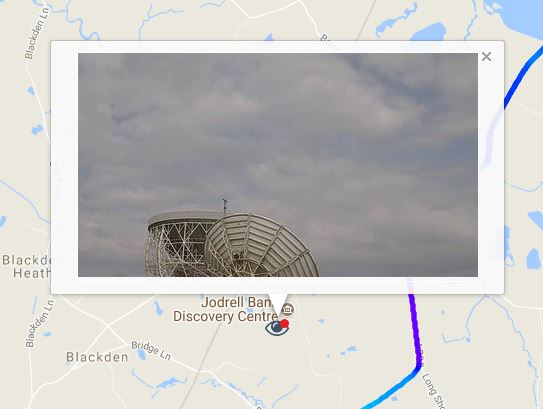
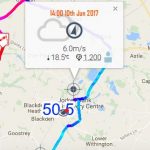
Eye on the Ground: On the day of your time trial the Eye on the Ground shows a recent image from locations near the course.
Eye on the Ground
In our next post we find out how to use key charts to get the best time possible in the conditions.
Racing a time trial is all about squeezing every bit of your potential out within the distance and time set. Falling short in race preparation is a disservice to the efforts you make in training, lifestyle and during the race itself. In this series of posts I will guide you on how to get the most out of myWindsock.com cycling weather forecasts for your time trial event.
Let’s take a look at how to get set up with the most accurate forecast.
Time trial course loaded
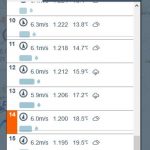
The very first thing to do with any forecast is check the time and date of the forecast. If you have used the Open Events directory or Time Trial Finder this should be correct but it’s worth checking or adjusting for later start times. Click the icon to reveal the available forecasts.
The weather box shows the date and time the forecast relates to.
Select the correct date and time for your time trial.
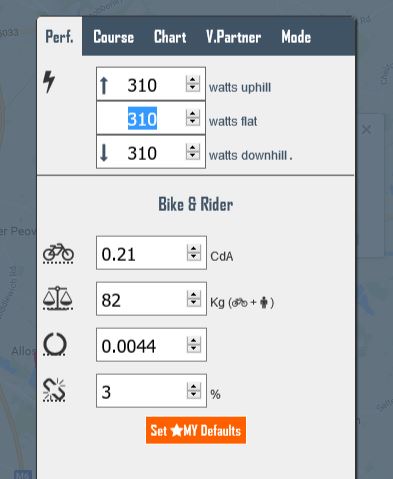
Before we start checking out the numbers we first of all I need to check that the physics engine is using good estimates for my expected performance on the day. Clicking the icon in the top left corner reveals the Performance options tab. From here I can set some loose parameters for the physics engine to use when making predictions and metric calculations.
Adjust the parameters for accurate forecasting
If you don’t know what numbers to enter for Watts, Rolling resistance and CdA check out the advice here Performance Options.
In the next article we look at getting the most out of the myWindsock forecast maps and charts.