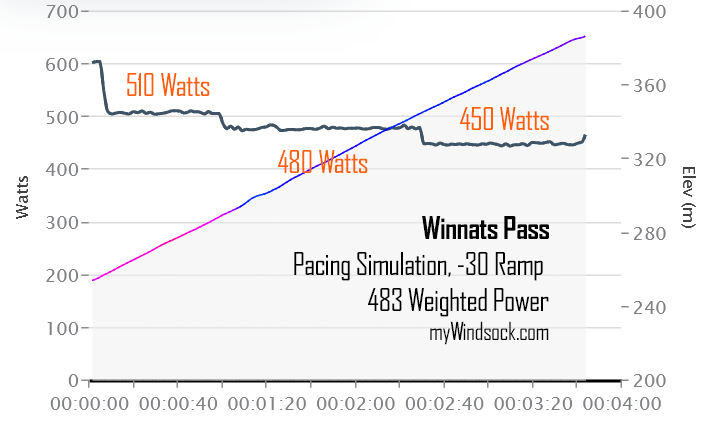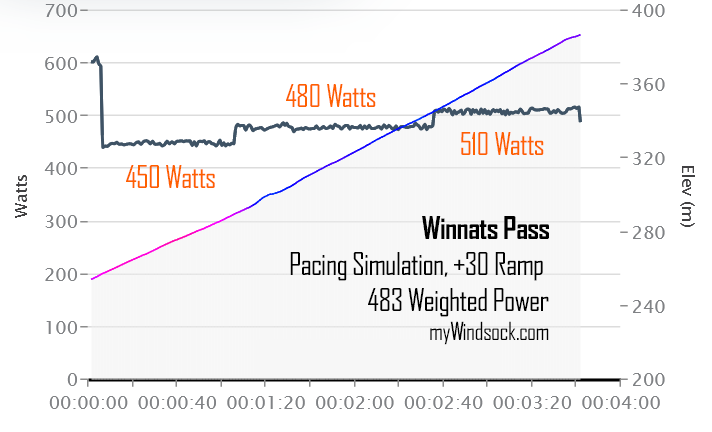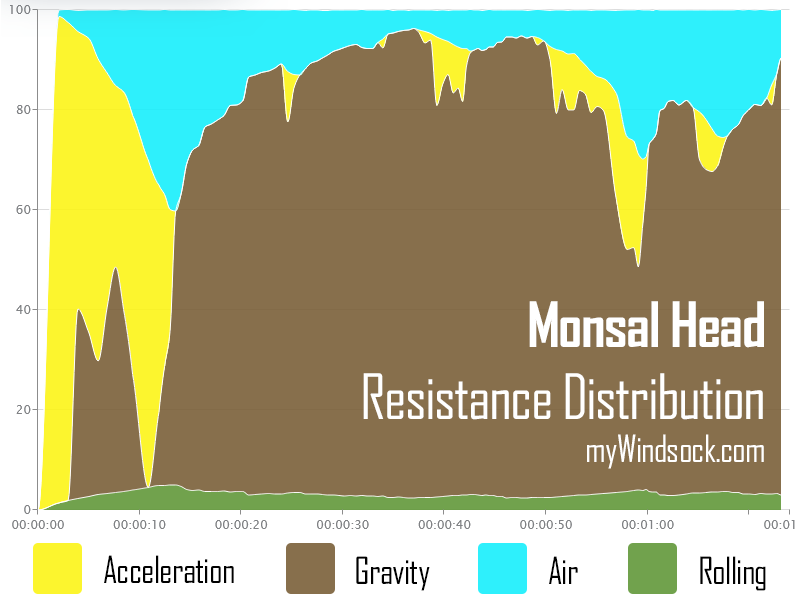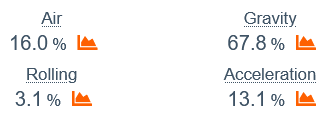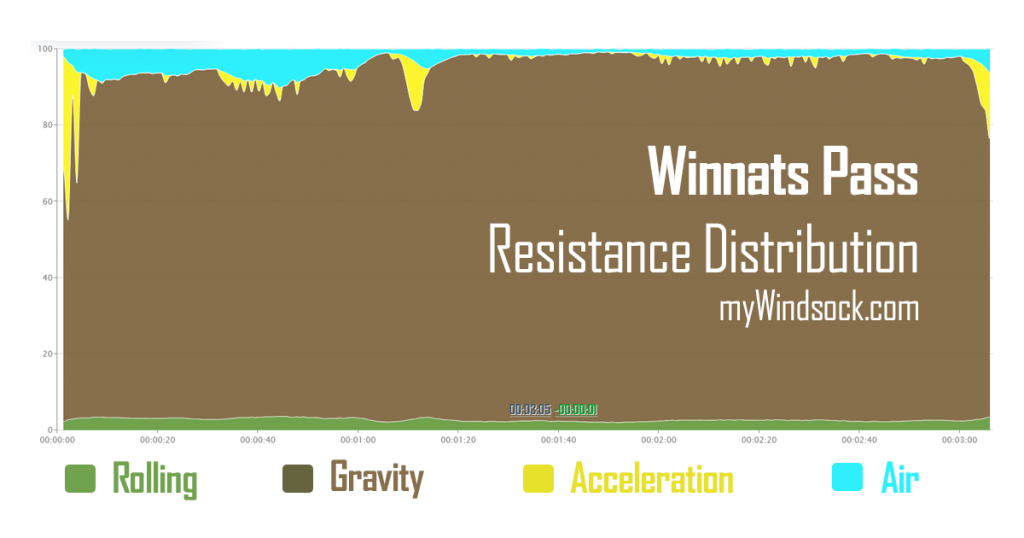
The above Resistance Distribution, is based on our estimates of a male podium finisher. We’ve estimated this to be an athlete with an output of 7.7 Watts/kg. With a total mass of 70kg, averaging 540 Watts. Our predicted time for this rider is 3mins 5 seconds.
The forces acting against each rider is very individual. By far the greatest force is gravity. It is no suprise that as we increase a rider’s weight, so does the proportion of energy required to move the rider up the hill. However there may be some interesting changes to the distribution of the other resistances.
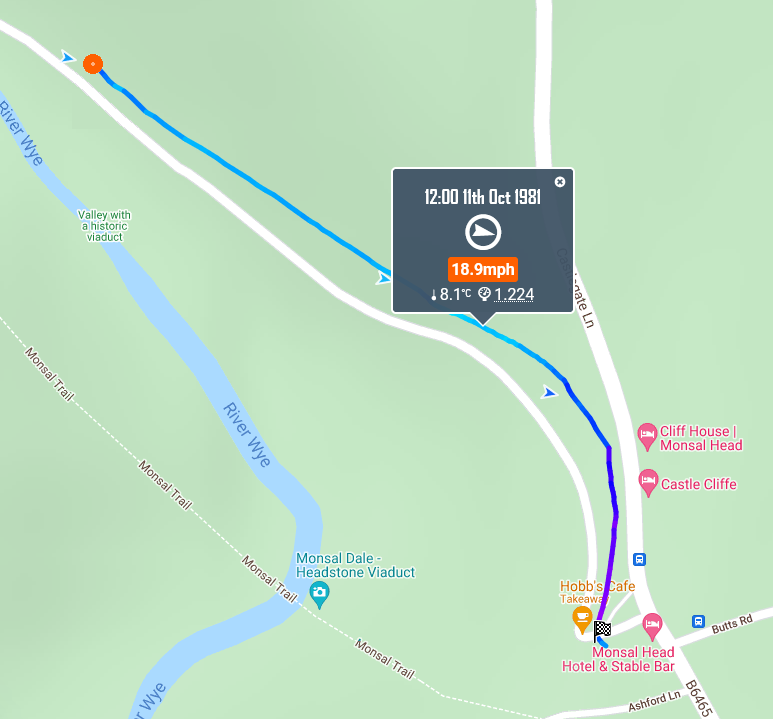
Live Winnat’s myWindsock data here
How does resistance change for different riders
Let’s face it, at 15% average, gravity is a huge part of the battle between Watts and Speed. However, with a few trips up the hill for our myWindsock Virtual Rider, we can see how each rider’s morphology has an individual mix of additional resistances to pay attention to.
Increase Mass of Rider, bike & equipment
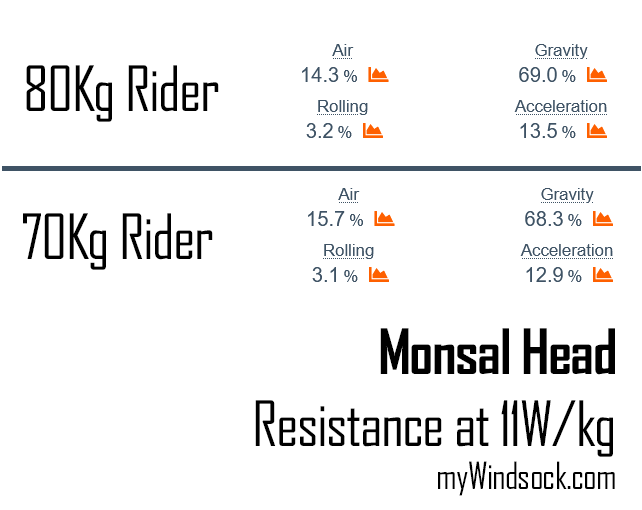
Keeping our Watts/Kg the same, let’s see how three riders of 60Kg, 70Kg and 80Kg compare. Here we see an exchange in distribution between Air resitances and Gravitational resistance.
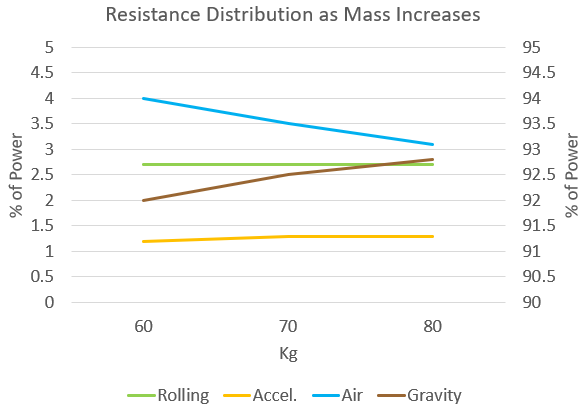
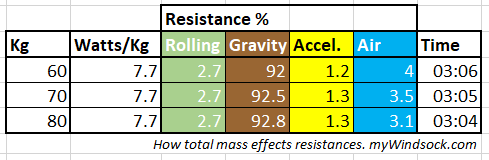
Look at how air resistance decreases, whilst gravity increases as a proportion of the rider’s energy consumption. Heavier riders are less affected by changes in the wind. See also, despite the power ratios being the same at 7.7Watts/Kg, a larger rider actually rides the hill quicker.
Increase Rider’s Power Output
Taking a 75Kg rider we then altered their power from 5Watts/kg up to 8Watts/Kg. As the power increases, the proportion of Air Resistance increases the most.
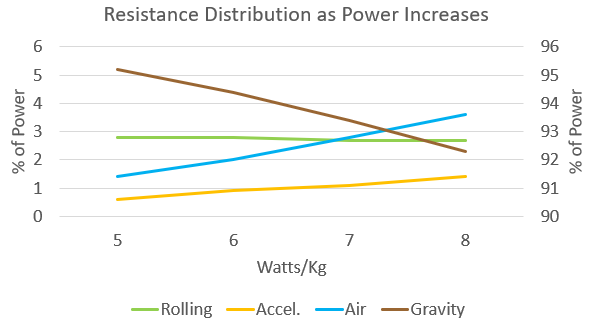

Here we see a similar exchange between Gravity and Air resistance. It’s interesting to observe that a less powerful rider will be impacted more by their bike and equipment weight.
Also see that as a rider becomes more powerful, Acceleration increases as a proportion of energy expenditure. This is the energy required to change the rider’s speed. As power increases, rotational weight becomes more important.
Conclusion
You may not be able to change much about your morphology. At 6ft 2inches, I wish it was something I could train around September and October. However understanding your individual fight up the hill may give you some idea as to where to focus for that extra edge.
Try your own experiments and learn about your individual hill climb. Live Winnat’s myWindsock data here