


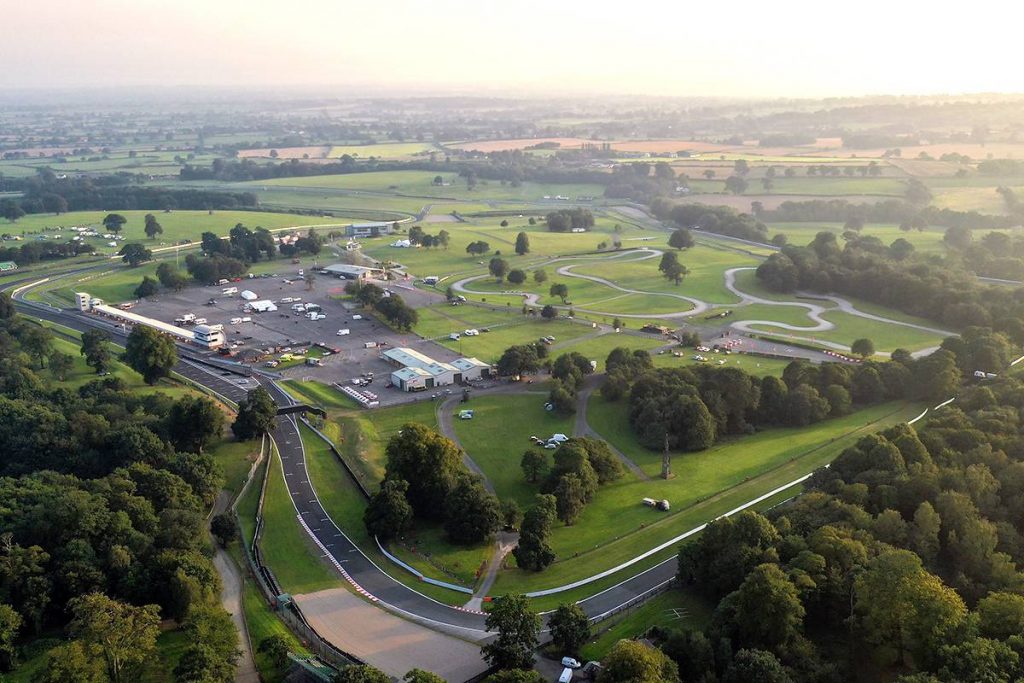
Enjoy your Track Pass ride on the historic, silky smooth, Oulton Park tarmac.
Then, the tension builds, for an “all out”, lung busting, Hot Lap competition.
Proudly supported by


For more details check out thehotlap.co.uk
View myWindsock data, analysis and experiments.
Highlighting and discussing events in cycling and using myWindsock to improve performance.
Enjoy your Track Pass ride on the historic, silky smooth, Oulton Park tarmac.
Then, the tension builds, for an “all out”, lung busting, Hot Lap competition.
For more details check out thehotlap.co.uk
For competitive cyclists, every second counts. Achieving peak performance on race day involves more than just rigorous training and top-notch equipment; it also requires a keen understanding of environmental conditions. This is where MyWindsock comes into play. By providing detailed weather and environmental data, MyWindsock equips cyclists with the information needed to strategise effectively and gain a competitive edge. In this guide, we’ll explore how to leverage MyWindsock for optimal race day performance.
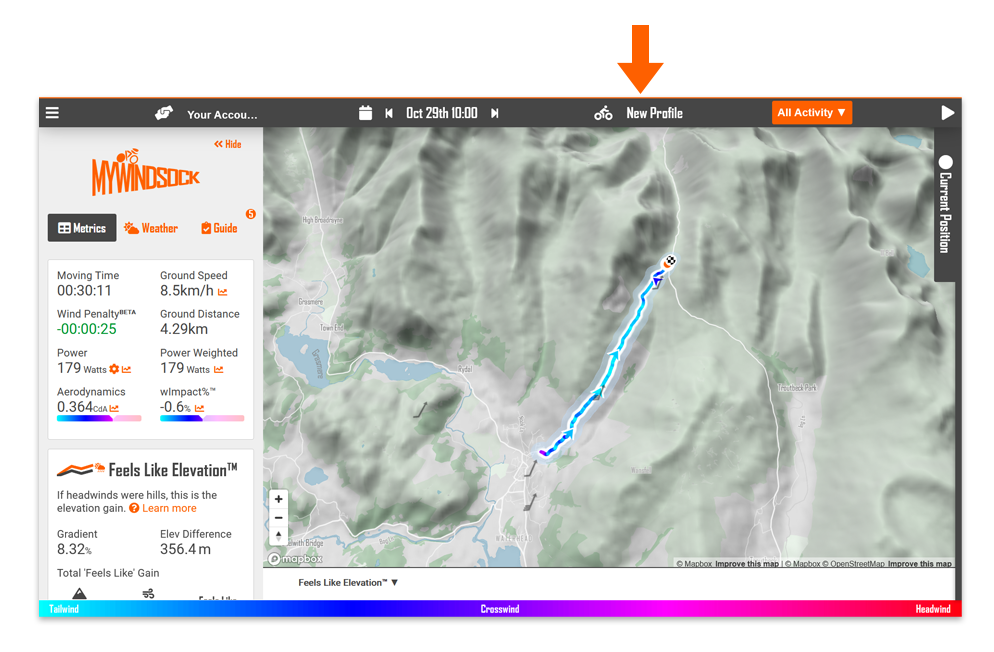
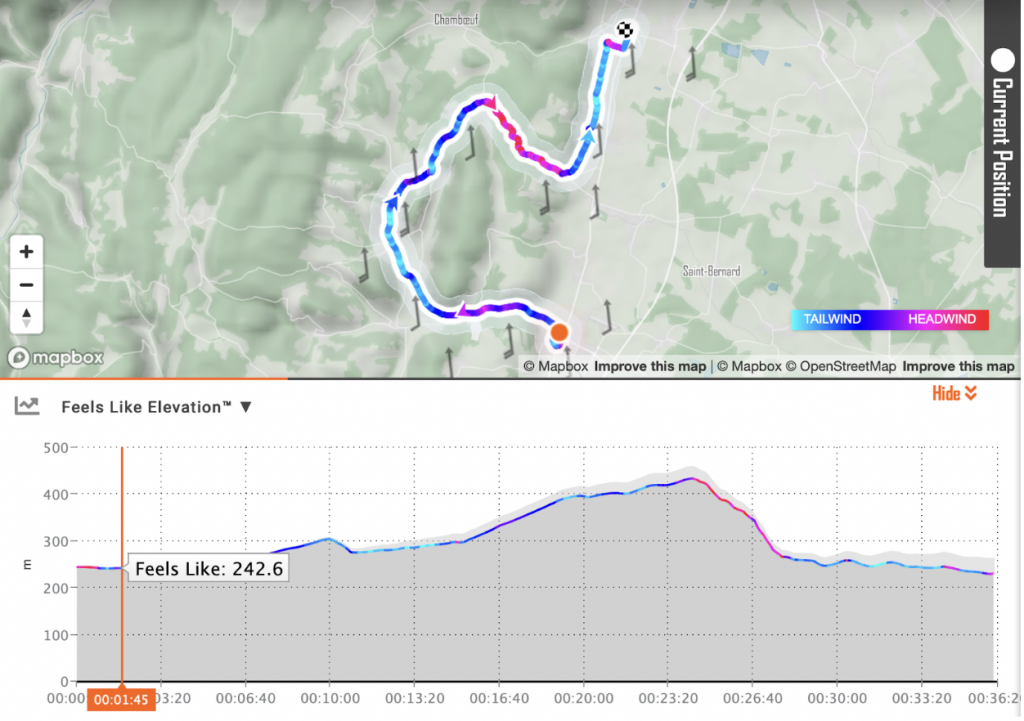
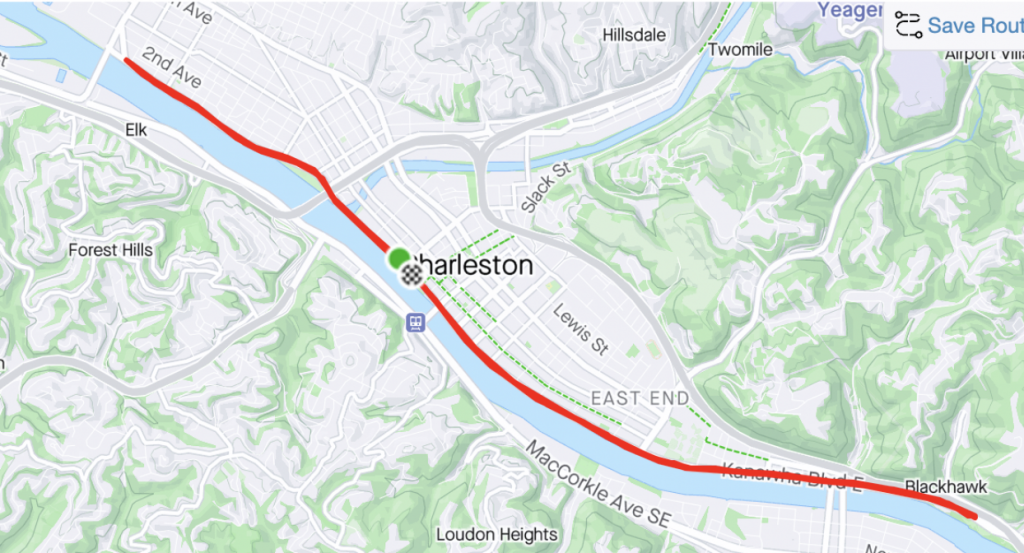
Begin your race day optimisation by thoroughly analysing the race route using MyWindsock. Input your route via Strava, RideWithGPS or just upload the GPX file straight into Windsock to get a comprehensive overview of the environmental factors that will impact your ride:
– Wind Direction and Speed: Identify sections of the route where you’ll face headwinds, tailwinds, or crosswinds. Tailwinds can help you conserve energy, while headwinds require more effort.
– Elevation Changes: Pay attention to where the climbs and descents are. Plan your energy expenditure accordingly, conserving energy for challenging climbs and capitalising on descents.
– Weather Conditions: Check the weather forecast for race day. Temperature, humidity, and potential precipitation can all affect your performance and equipment choices.
Once you have a clear understanding of the route and conditions, use this data to plan your effort:
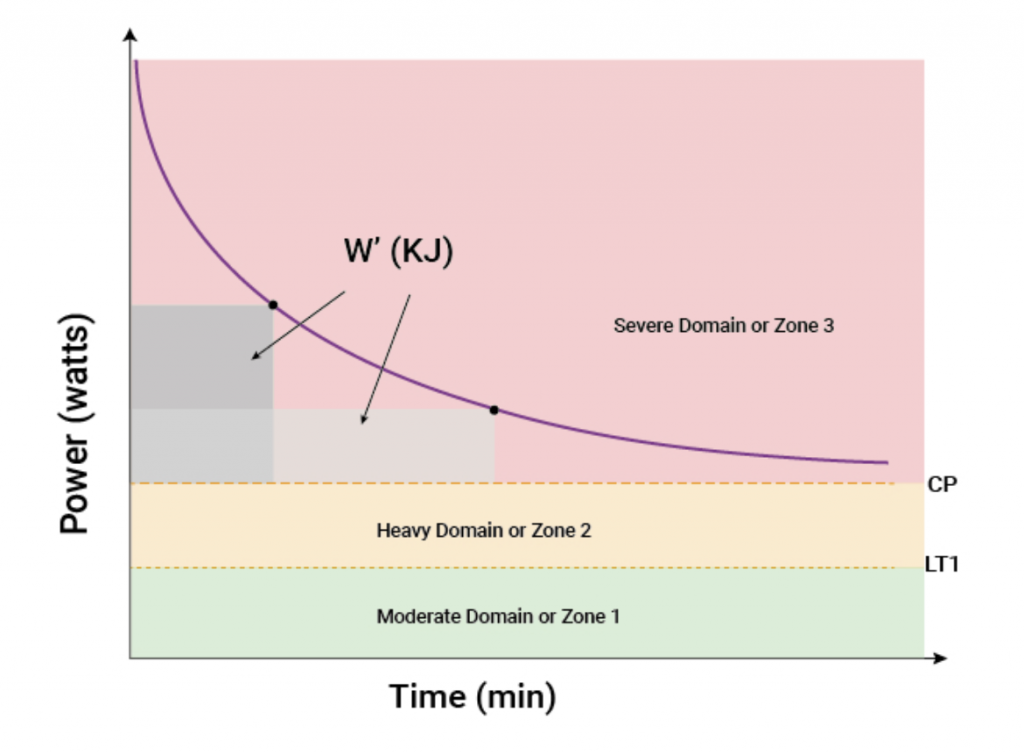
– Pacing: Adjust your pacing strategy based on wind and elevation data. For instance, push harder during climbs but work out just how hard you can go without blowing up using W’ Balance.
– Drafting: In windy conditions, drafting behind other cyclists can significantly reduce your energy expenditure. Use MyWindsock’s wind data to identify the best times and places to draft as well as checking wind direction data for cross-tailwind sections where drafting can be hardest.
– Equipment Choices: Tailor your equipment to the conditions. For example, choose aerodynamic gear for windy days and tires with better grip if rain is expected.
On race day, keep MyWindsock’s insights in mind as you execute your plan:
– Stay Flexible: While having a plan is crucial, be prepared to adjust based on real-time conditions. If the wind changes direction or intensity, modify your strategy accordingly.
After the race, use MyWindsock to review your performance:
– Compare Data: Analyse how actual conditions compared to forecasts and how well you adhered to your planned strategy.
– Identify Improvements: Look for areas where you can improve. For example, did you lose time in headwind sections? Did you push too hard on climbs?
– Refine Future Strategies: Use insights from your post-race analysis to refine your strategies for future races. Continuous learning and adaptation are key to gaining a competitive edge.
By leveraging MyWindsock’s comprehensive weather and environmental data, you can optimise your race day strategy to enhance performance and gain a competitive edge. From pre-race planning and effort strategizing to real-time execution and post-race analysis, MyWindsock provides the tools needed to maximise your potential. Embrace the data, refine your strategies, and watch as your race day results improve. Happy racing!
Is it possible to save minutes just by pacing optimally? Without getting fitter or more aero? Let’s take a look…

Pacing your efforts is much easier with myWindsock. It’s the only place you can virtually test pacing strategies without having to ride them on the road. Pacing can make a bigger difference than anything, especially on rolling and sporting time trial or triathlon courses. It’s not just for solo efforts though, myWindsock can also help you spot the best place in a road race to attack! Sign up here.
Tadej Pogačar of UAE Team Emirates stormed to an impressive victory on stage 7 of the Giro d’Italia back in May, dominating the 40.6km individual time trial from Foligno to Perugia. His stellar performance not only extended his lead in the maglia rosa but also brought him closer to clinching the overall victory.
Filippo Ganna from Ineos Grenadiers initially set the pace with the fastest times at both intermediate checkpoints, hinting at a potential victory for him. However, as Pogačar tackled the final climb towards the finish line, the suspense escalated as Ganna’s substantial lead began to dwindle. By the finish, Pogacar took the victory.
On stage 4 of the Critérium du Dauphiné, the European time trial champion, Josh Tarling of Ineos Grenadiers, delivered a scorching performance but fell short of surpassing the unstoppable Remco Evenepoel from Soudal Quick-Step. Despite Tarling’s impressive run, Evenepoel, the reigning time trial world champion, seized the lead with a remarkable time of 41:49 over the 34.4km course, ending Tarling’s reign in the hot seat.
Tarling set the early benchmark, finishing just 17 seconds behind Evenepoel in second place, while Primož Roglič of Bora-Hansgrohe secured the third spot, trailing the winner by 39 seconds.
The competition remained tense through the first two time checks, with Evenepoel and Tarling neck and neck within a few seconds of each other. However, it was the Belgian rider who made a decisive push for victory in the final kilometres, securing his dominance on the stage.
On the fifth of July, the first of two Tour de France TTs will take place over a 25.3km course with 300m of elevation gain and the course will likely take the riders around 30 minutes – so relatively similar to the TTs we are comparing in terms of energy systems used by the athletes. The way we will decide whose TT was better is to back calculate the riders watts and cda based on their performances and what information is available and input these performances onto the course for the Tour de France stage 7 TT on July the 5th. On the surface, Remco Evenepoel’s TT looks streaks ahead of Pogacar’s – however, I have Pogacar’s performance as around 5% “better” in terms of power output for the estimated cda (however, all of these are estimated as neither rider publishes their power and, as a result of this, 5% is within the margin of error).
During the grand tours, myWindsock is the place to be for TT predictions. We will provide predictions for the entire race and specifically, the two TTs for the GC top 10 as well as TT favourites.
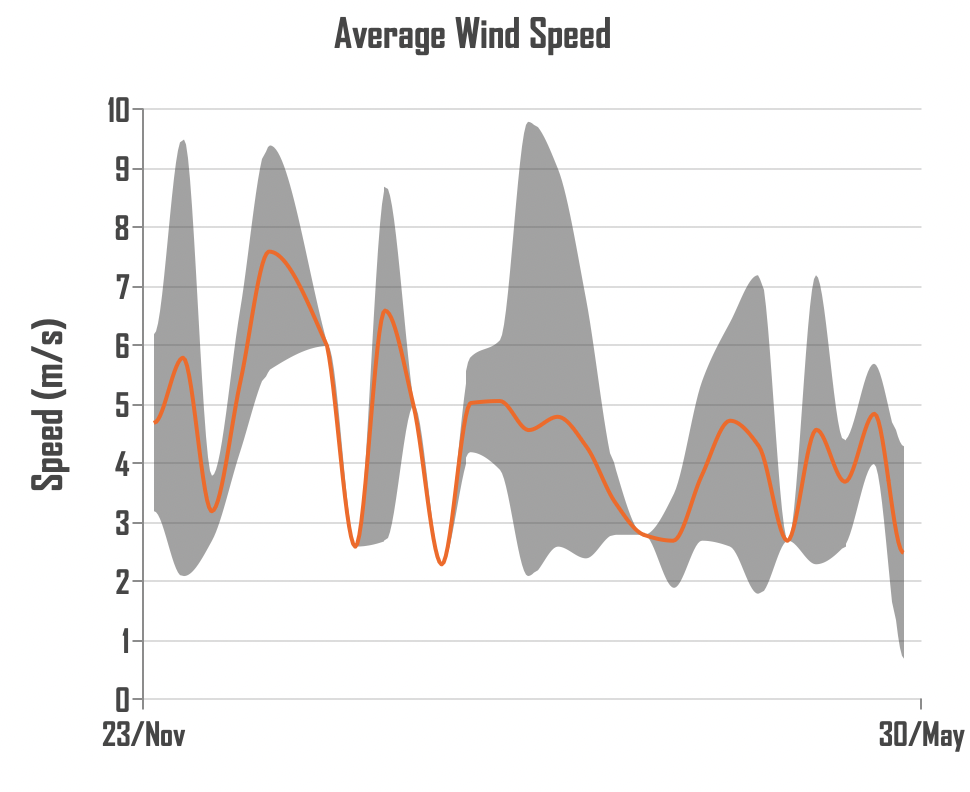
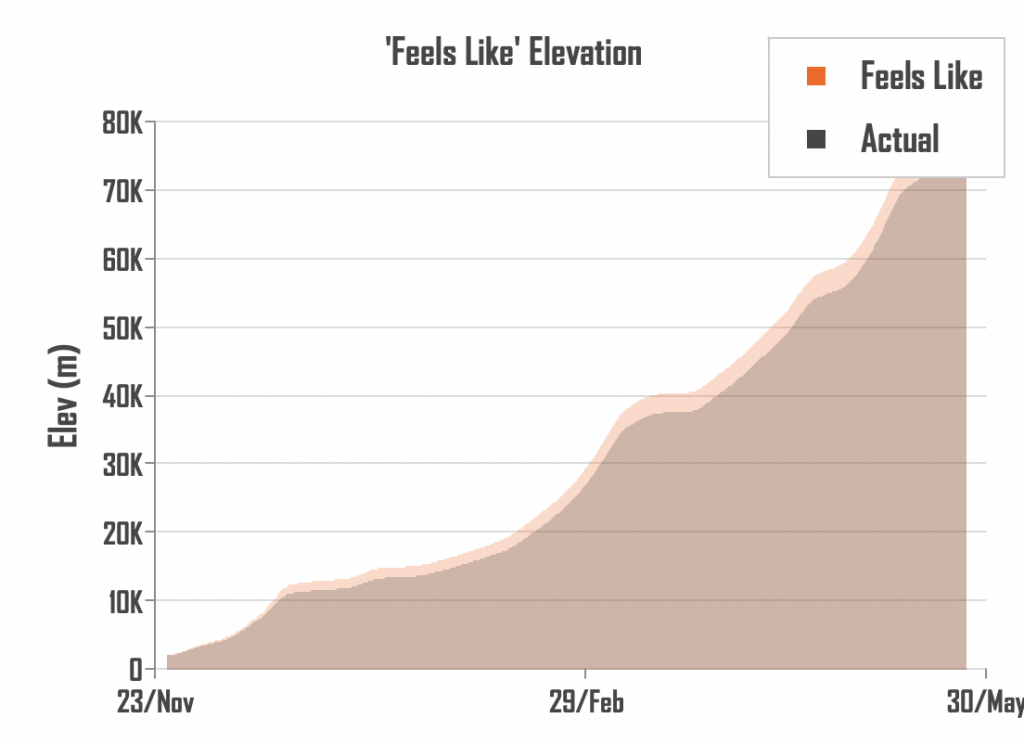
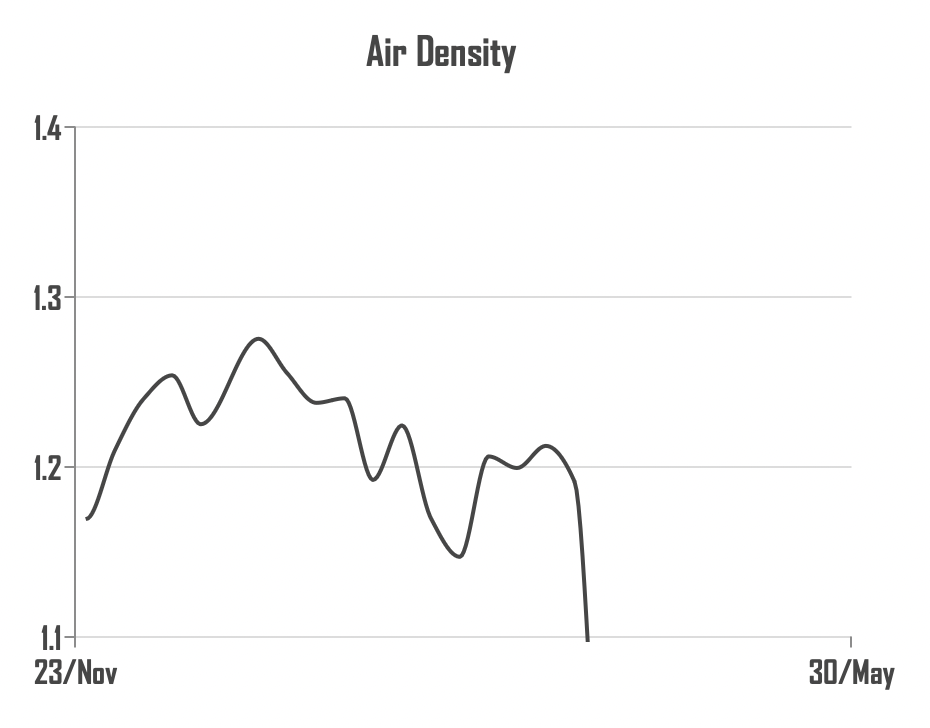
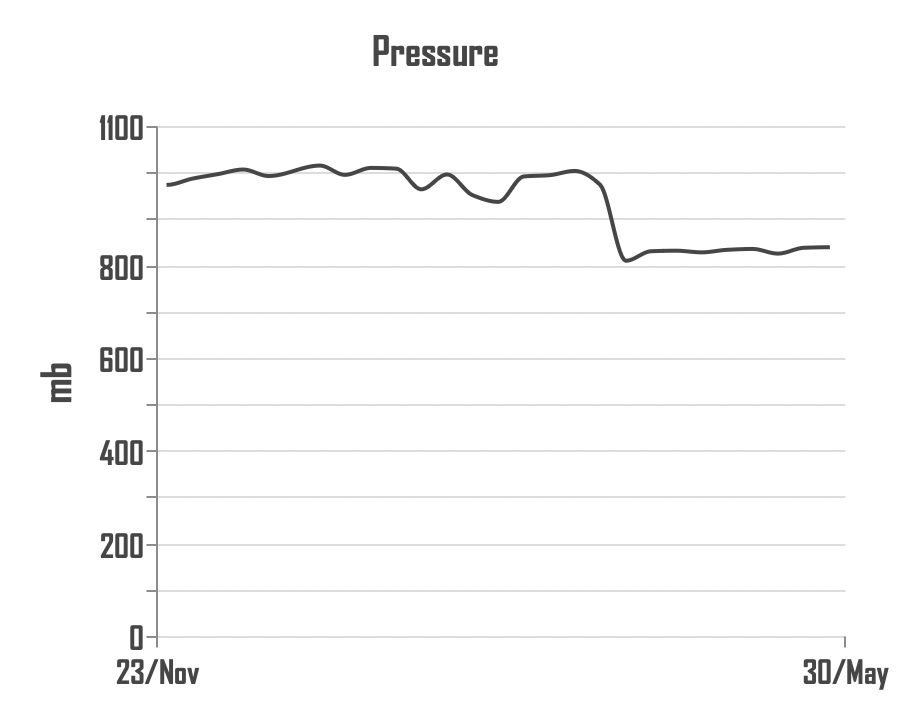
We often neglect to highlight our own features here at myWindsock and one thing that we don’t talk about enough is our trends dashboard, what these charts mean and how to use it.
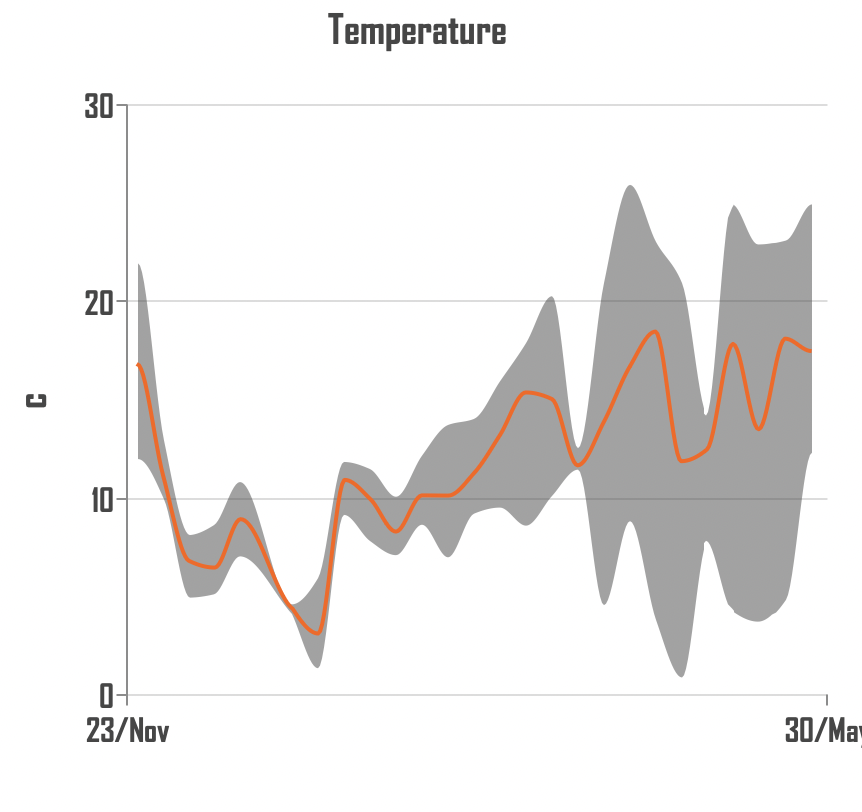
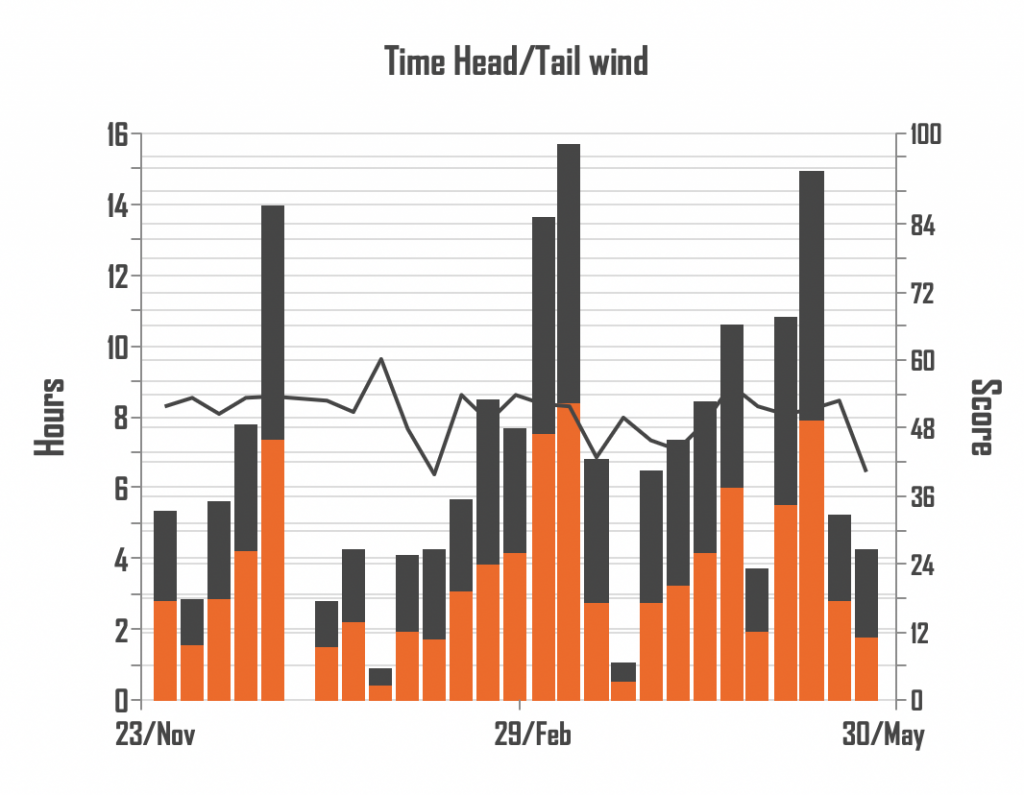
For insights like these into the weather you train in, or to get ready for your next race, sign up to myWindsock here.
Taylor Knibb is a professional cyclist and triathlete from America. She has recently qualified for the Olympics for triathlon, which most people expected, but then won the USA national TT championships to punch her ticket to Paris for the TT as well – which less people expected, including Knibb herself who said, “I’m in shock and so is my whole team. We just wanted to go out, give a good effort, and see — hopefully improving on last year. But it just all came together.” She beat a double world TT champion in order to win, so she wasn’t racing any Mickey Mouse field. This isn’t the first time a triathlete has dabbled in time trialing in recent years, with Canadian Paula Findlay racing in Stirling at the UCI World Championships in 2023.
The nice thing about the USA National TT championships is all the riders take on the same course which means we have a larger pool of riders to pick from when calculating power numbers to figure out if Knibb can win in Paris. She also managed to top 20 the men’s race, which in a country as big as the USA, is quite impressive.
Can Taylor Knibb actually win in Paris? Three Olympic time trial gold medals have been won by American women in the past – all of which were Kirsten Armstrong, and there’s been a few others winning silver and bronze along the way. There’s most definitely pedigree and it should tell us that USAC aren’t sending her as a publicity stunt.
Figuring out whether Knibb can win in Paris is a question of working out how fast she could ride the course based on what she did at the USAC national championships then working out how fast the women’s winner of the Paris TT might go – a slightly more difficult task.
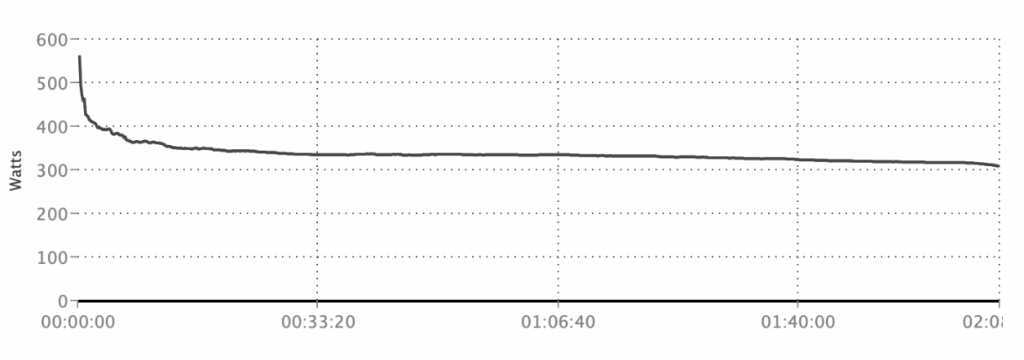
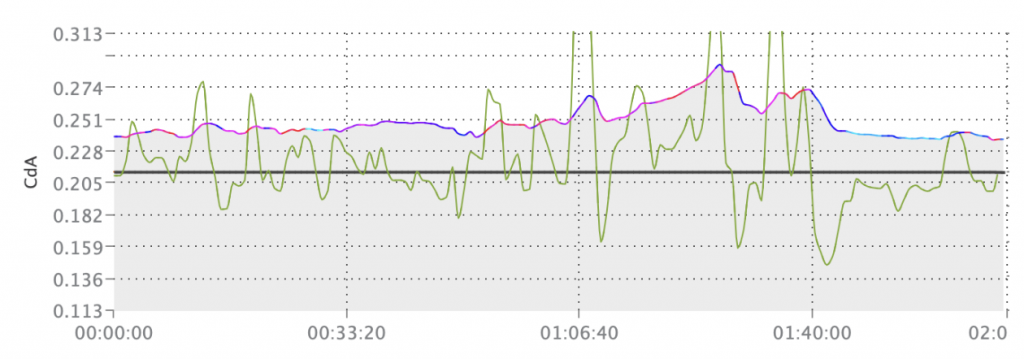
Triathlete Taylor Knibb (Boulder, Colo.; Trek Factory Racing) secured the National Title in her second-ever Time Trial National Championship, finishing with a time of 41:54.69. Fixing this time, we’ve had a look at the various different combinations of power and cda required to achieve this time.
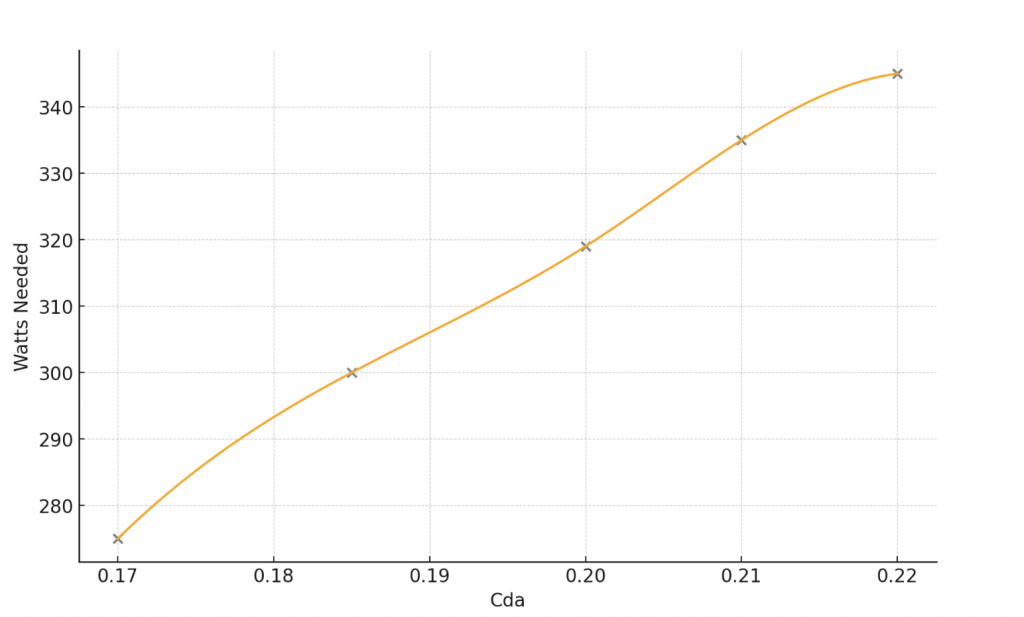
There’s likely gains to be found in Knibb’s set up when it comes to aerodynamics. Purely because she has not been time trialing long – she has great sponsors and a manager who understands what it takes to win an Olympic gold medal (her manager’s wife is Gwen Jorgenson, winner of the triathlon in Rio). The woman’s TT is likely to be around a 40 minute effort in Paris – not dissimilar from the USA national championships. There are around 15 corners in the TT route in Paris and Knibb will have to improve technically between now and then to be in with a chance of winning.
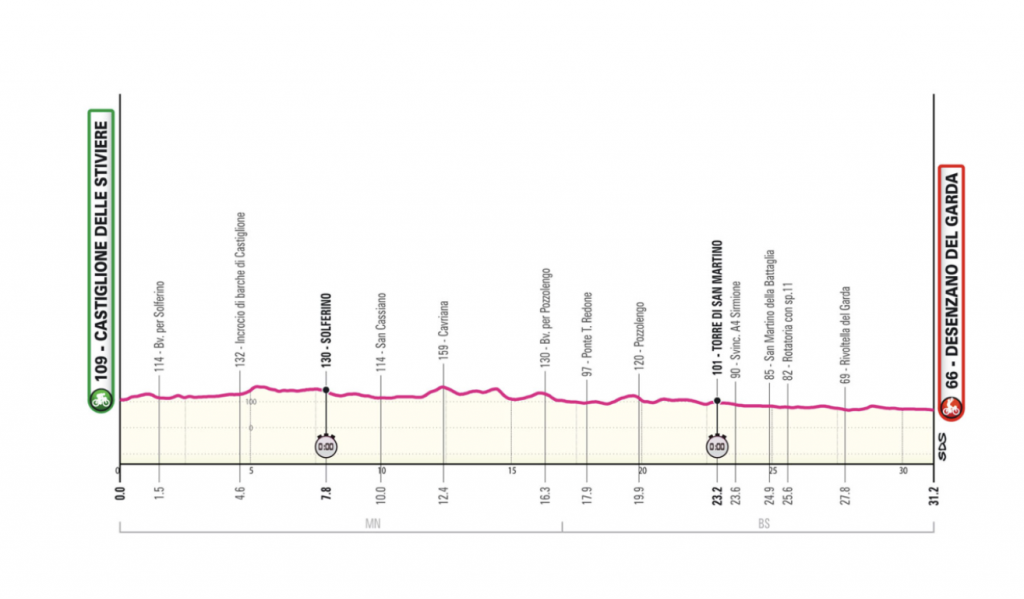
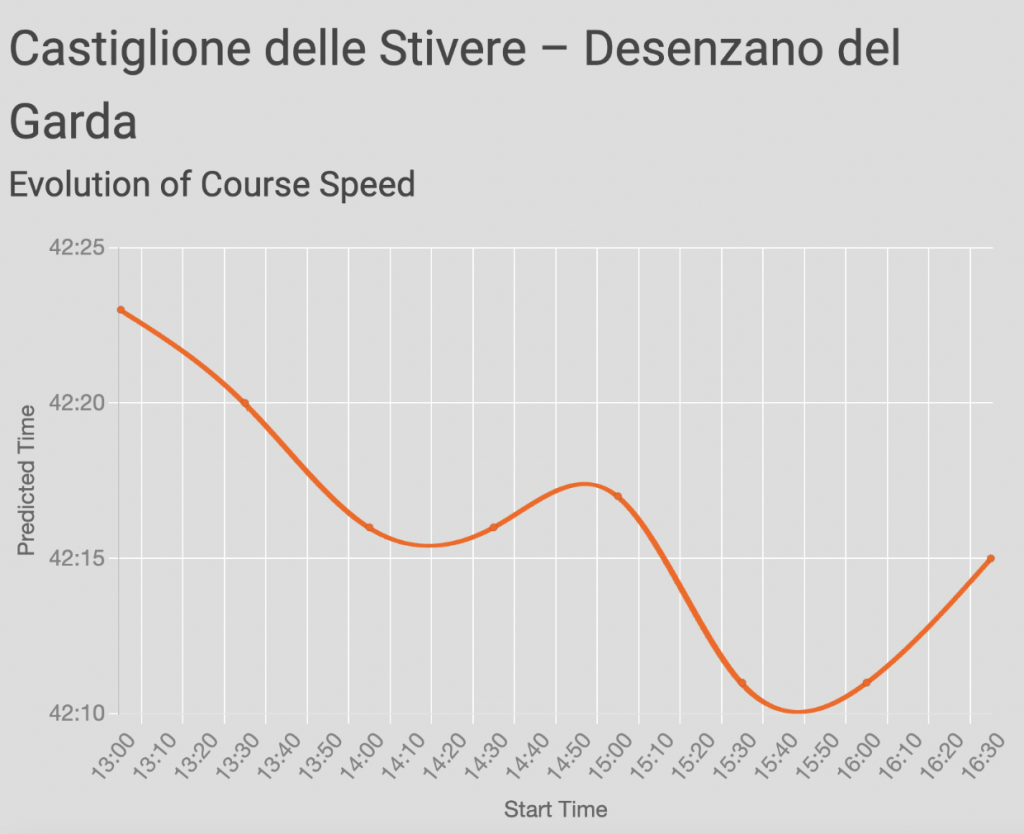
The second individual time trial culminates against the stunning backdrop of the southern tip of Lago di Garda. Spanning 31.2 kilometres, the trial kicks off in Castiglione delle Stiviere, renowned as the birthplace of the International Red Cross. Following this challenging stage, the contenders vying for the top spots will likely require some TLC for their weary legs, making this segment pivotal in determining the overall classification.
The first TT featured a category 4 climb at the end, which you can read about here. In the first individual time trial of the 2024 Giro d’Italia, Tadej Pogačar from UAE Team Emirates delivered an impressive performance. He surged up the category 4 climb at the conclusion of the 40.6km route from Foligno to Perugia, seizing the stage victory.
Filippo Ganna of Ineos Grenadiers, who had held the lead for much of the day, expressed disbelief as Pogačar turned a 44-second gap at the foot of the climb into a 17-second triumph. Adding to Ineos’ success, Magnus Sheffield secured third place on the stage, finishing 49 seconds behind the leader.
The flip side of this is the physiological penalty for riding the small climb from kilometre three to kilometre six too hard and losing time in the second half of the race. It’s likely we will see a number of impressive time splits at check one, which sits 7.8km into the course. The second split is 23.2km in – is likely to be relatively final.
We’ve seen, over the last few years, conditions in Giro TTs change quite a bit over the course of the day.
If you want to check out the TT loop for the Giro TT – have a look here.
The pandemic was an interesting period for endurance sport – we all had nothing to do other than ride Zwift, do time trials and ride alone. This was the same for the professional triathletes who had no racing for the best part of a year. When we came back from the pandemic, tentatively in 2021 and then more comprehensively in 2022, times started getting faster and, as is often the case with endurance sports, eyebrows got raised.
Given the history of endurance sports, the eyebrow raising was probably justified and a healthy amount of scepticism keeps sport honest (ish). The question was, given the gap in time, was the extra scepticism warranted? For this example, we will use IRONMAN World Championships in Kona for two reasons, firstly, it’s on the same course every year which is obviously not the case for something like Le Tour du France which makes performances more comparable – especially when we can normalise for the weather conditions which we’ll have a go at later. Secondly, I just really like triathlon and often use this blog to look into stuff that interests me and hope myWindsock users also share my esoteric interests.
The first step is just to take a look at the Kona times since 2014 (because that’s as far back as IRONMAN publish race results without me having to look really hard) and just draw a line through them to today (a straight line because it works pretty well) and see if any of the performances jump out at us…
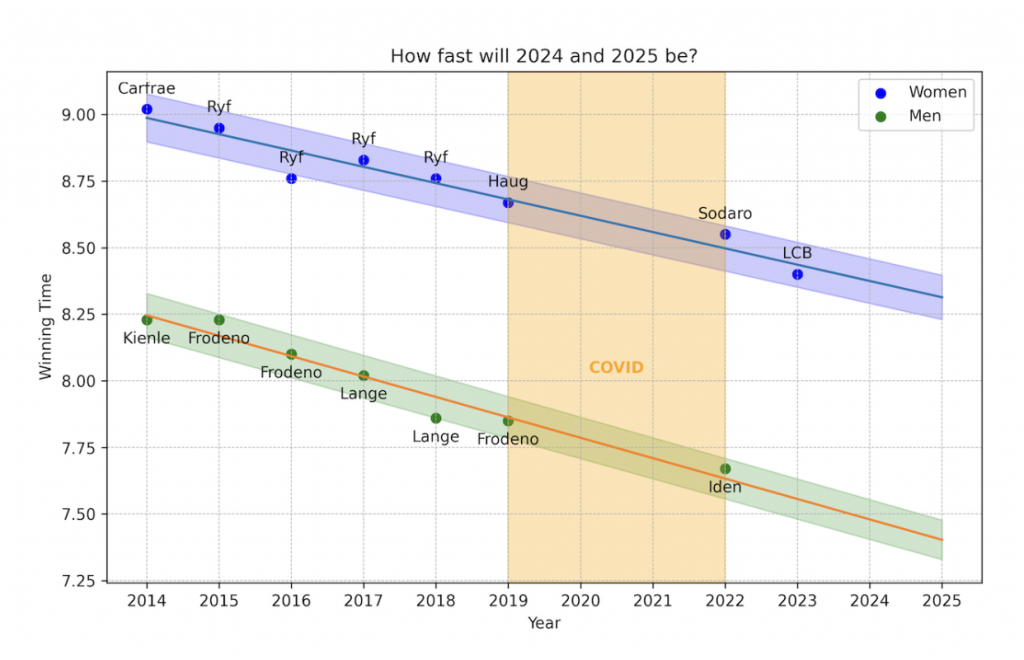
Going forward, the times will probably continue getting faster. In 2024 the men are in Kona (and the women in Nice due to some post pandemic location shuffling) and it’s likely that, in order to win this race, someone will have to go under 7 hours and 30 minutes for the first time.
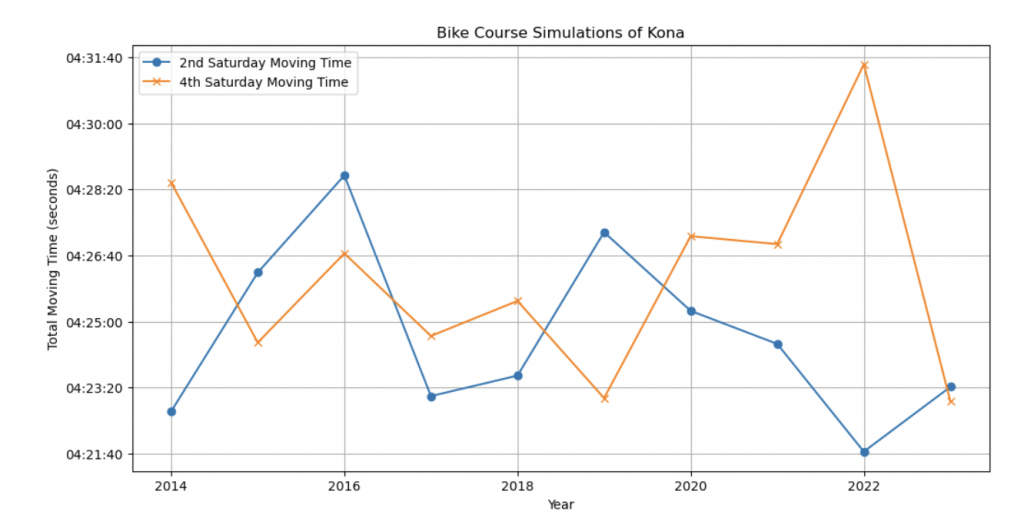
They’ve moved the date of Kona a bit over the years – is that why times are getting faster?
Good question reader. I checked, broadly no but there’s one outlier – the Men’s race this year (2024) is on the 26th of October – as late as it’s been for some time (maybe ever?) and I wonder what difference this might have on the conditions. The 26th of October is the 4th Saturday of the month and traditionally, Kona has been on the second Saturday. Will these two weeks make a big difference?
In general, Kona tends to experience trade winds, which are typically stronger in the summer months (May to September) and weaker in the winter months (October to April). Therefore, October might have lighter winds compared to the preceding summer months, but it can still experience occasional windy days, especially in the afternoon. This means, the famous cross winds on the Queen-K might be a bit gentler this time round as the race is later. Let’s have a look though…
Broadly speaking, the answer to our question is no. The trend of races getting faster is not much to do with the weather. It’s probably due to materials, decreases in resistance due to aerodynamics, faster tyres and other things.
In 2024, to win the Ironman World Championships in Kona (only the men are racing) you’ll have to finish in sub 7:30 according to the trend that appears to be in place. If you add up all the current records for individual disciplines and add very quick transitions we get sub 7:30. The likelihood is we will see a sub 4 hour bike split if the weather plays ball. By 2030, sub 7 might well be on the cards. One day, we will look into what that might take.
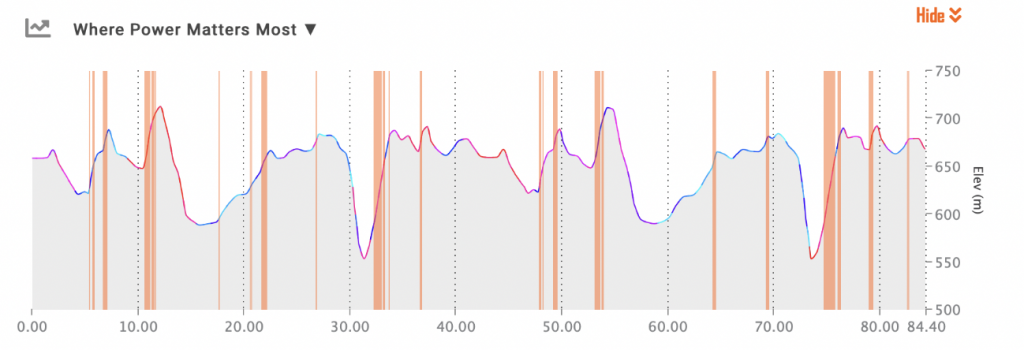
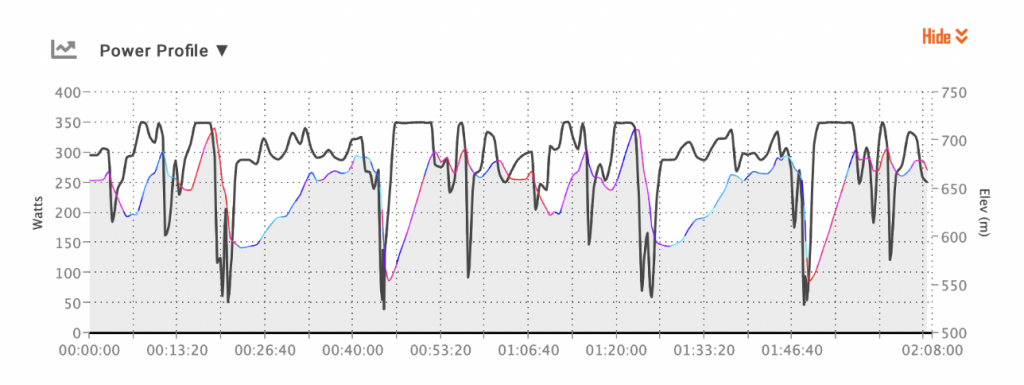
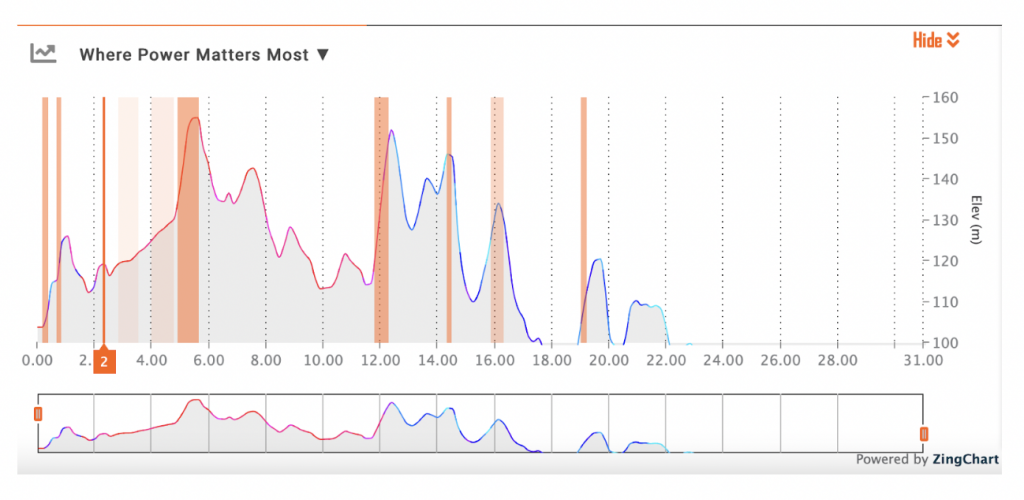
Personally, my favourite graph in myWindsock is “Where Power Matters Most”. This plot essentially tells you where you should ride a bit harder. This is a plot I’ve spoken about quite a lot on this blog before but today we will take a look into why power matters most – rather than where. In order to do this, we need to take a little look into what actually slows a cyclist down when they’re riding.
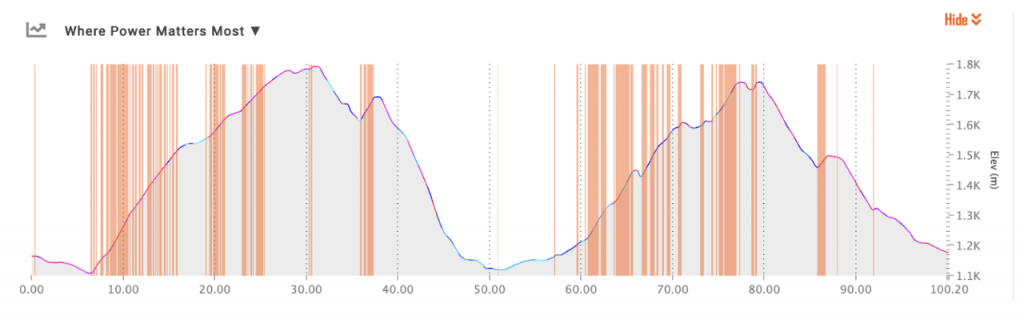
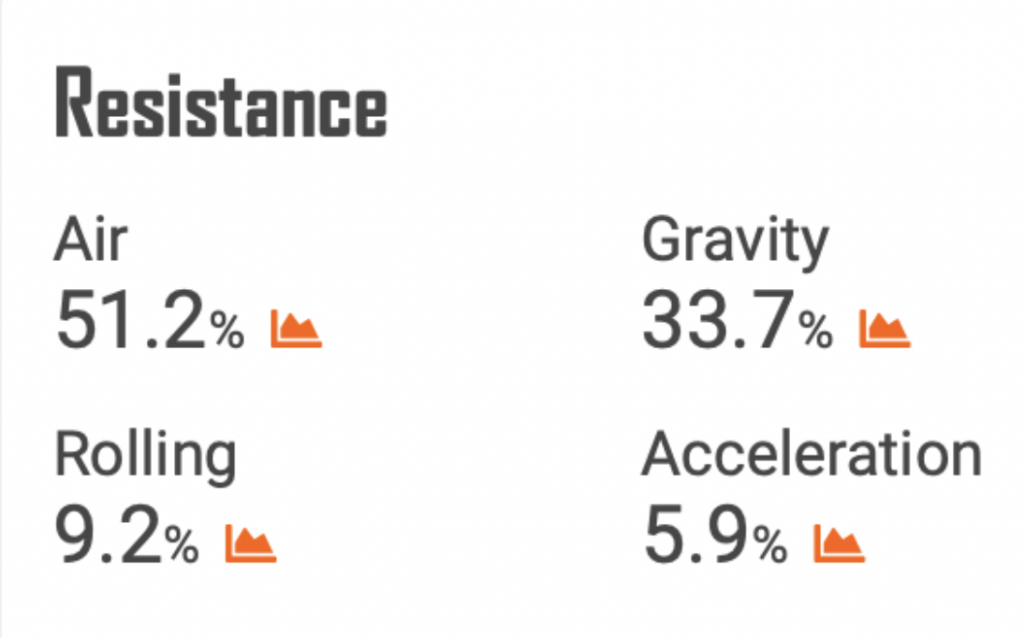
Let’s consider the factors that speed a cyclist up and what slows them down. In slowing down we have headwinds, rolling resistance, drivetrain resistance and going up hills. The things that speed our cyclist up include tailwinds, going down hills and the obvious one – pedalling. The intuitive explanation for Where Power Matters Most is simple – when the things slowing you down are on the up, and there’s not much other than your legs contributing to your speed. The old time trial adage of “minimising the amount of time spent going slowly” is key here.
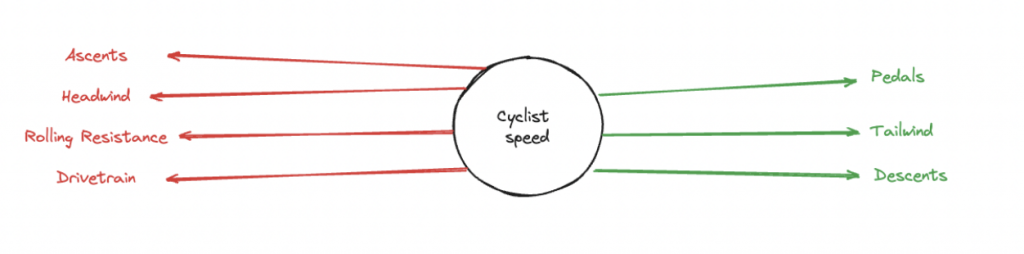
The simple way to think of this is by looking at this little drawing and if there’s more red than green, power matters more. This is the same as adding up all the forces acting on the cyclist and if there’s more slowing them down than there is speeding them up – power matters more. The greater extent to which this is true, the more power matters! On the graph, a long region of uphill with a headwind will show where power matters.
In an ideal world, we will get up to target speed and keep the green arrows and the red arrows in balance. If, when you’re riding, you imagine the sum of the green (positive) and red (negative) arrows changing and your job, when pacing, is to keep their sum as close to zero as possible by adjusting the power input through the pedals.
The penalty for overadjustment is a blowup of course, go too hard up the first climb and you won’t have enough gas for the second. This is where myWindsock can come in handy, as we can, using the critical power model, calculate your effort for you.
Prepare for your next race like the pros, sign up to myWindsock here.
In a field with a great deal of swim talent, most people had their money on an athlete like Marc Dubrick to lead out of the water in Oceanside, but instead it was relatively unknown German pro Magnus Manner who exited the water first. Magnus Manner is a great swimmer and this was not unexpected to anyone who knows anything, that said. Stringing out the front group, Manner led Dubrick, Canadian Olympian Matthew Sharpe and Italian Mattia Ceccarelli out of the water by a couple of seconds, with the next group half a minute down.
In the second pack, there was plenty of firepower for the bike leg ahead, with German Florian Angert and American Dylan Gillespie just ahead of a group of eight which included pre-race favourite Jelle Geens and two-time Kona champion Patrick Lange. Lange will have been pleased with this swim, but probably not much else as he took a wrong turn on the bike and was then anonymous for the remainder of the race. Further back, a number of other contenders were still in the mix, with Braden Currie down +1:05, and Lionel Sanders out in 25th at +1:38. Miami T100 runner-up Sam Long was +2:38 down, with British fan favourite Joe Skipper looking at a deficit of +3:40 out of the water.
Dubrick was first onto the bike. During the initial stretch leading up to Camp Pendleton, Geens took the initiative, swiftly manoeuvring through the field during transition and seizing the lead by the time the front group had covered the first 20km of the bike course. This would prove to be a major tactical error by the Belgian as he was unable to follow Sam Long later on in the bike. Meanwhile, further back, Long and Sanders emerged as contenders, steadily gaining ground on the leaders. Hailing from Tucson, the duo began to assert their presence in the race. By the halfway point, they, along with Jackson Laundry and Currie, had surged to the front of the pack.
Upon closing the distance, Long accelerated the pace, driving alongside Sanders, Laundry, Justin Riele, and Maximillian Sperl to initiate a breakaway with less than 20km remaining. As they entered transition, the leading quintet remained cohesive, leaving the rest of the field far behind. Geens, the closest pursuer in sixth position, trailed by +2:34, while Dubrick and Gillespie lagged a further 90 seconds behind the Belgian.
Unless Geens produced a monster run split, it seemed the men’s winner would come from this front group, with Long, Laundry and Sanders trading blows over the opening kilometres. Dropping Riele, then Sperl, then Laundry, Long and Sanders pulled ahead after 5km, before the Canadian made an early move for the win, opening up a ten second gap, which gradually doubled by the halfway point. Keeping his foot on the gas, Mr “No Limits” looked unstoppable over the middle section of the run course, and with less than five kilometres to go had a lead of over a minute back to Long, who had thirty seconds over Laundry back in third. Pushing like only he knows how, Sanders never relented despite the gap, as his lead continued to grow and grow. Taking the tape in an emotional finish, Sanders put Long and Laundry to the sword with a 1:10:40 run split.
The race was won on the bike, with the podium all coming from that lead group. Pre race favourites Sam Long, Lionel Sanders and Jelle Geens all made their impact on the bike. Sam Long attacked, Lionel Sanders held on (before going on to win the race on the run) and Jelle Geens went out the back door. Sam Long attacked the bike very hard, and it was a select lead group of 5 that managed to hold on until the end. Our man Jackson Laundry rode with the front group, showing that on his day, he can ride with anyone in the sport.
I had a brief exchange of messages with Jackson after the race and he put his bike success onto spending all winter on the turbo (he lives in Guelph, where temperatures in winter drop below minus ten Celsius). He told me that Sam was pulling very hard for most of the ride. Post race, Sam mentioned that he was worried about Jelle Geens on the run.
Interestingly, the fastest run of the day was done by Connor Weaver, down in 38th position who pulled a 1:10:01 out the bag.
Stay tuned for more ride analysis from pro races. If you want to be as well prepared as these athletes, sign up to myWindsock here.
![]()
Wind Lines and the concept of colours for the depiction of wind direction on a route map is the Copyright of Ben Norbury.
©2025 Ben Norbury Arclid.com Ltd
Welcome back...