It’s February and the open TTs are appearing on the CTT website, and the triathlon sign ups are starting. It’s often at this point in the year where people start to think… damn, I haven’t done much training. This leads us to wonder, how quickly can you improve? Does panic training work? The rate of progress in cycling performance can vary widely among individuals and depends on various factors, including genetics, training consistency, dedication, and overall health and we will talk about all of these today. Of course, being less fit can always be offset by getting more aero and pacing better…
Some factors that might impact adaptation…
1. Genetic factors play a significant role in determining an individual’s athletic potential. Some people may naturally have a higher predisposition for certain aspects of cycling performance, such as endurance or power. Training in such a way to maximise these strengths while addressing the weaknesses will help you find low hanging fruit where faster improvements can come.
2. Consistent and structured training is crucial for improvement. Cyclists who adhere to a well-designed training plan, incorporating a mix of endurance, interval, and strength training, are more likely to see progress than those that just randomly bash about for 10 hours a week on the bike. That said, there’s plenty of riders who have success by training like this, most notably – Andrew Feather.
3. Novice cyclists may experience relatively rapid improvements initially as their bodies adapt to the new training stimulus. As individuals gain experience, progress may slow down, and gains will become more incremental.
4. Proper rest and recovery are essential for progress. Overtraining can lead to fatigue, injury, and a plateau in performance. Balancing intense training with adequate rest is crucial for long-term improvement. You can’t improve under a maladaptive training load and you need to program in time for recovery.
It’s important to note that there is no one-size-fits-all answer to the rate of progress in cycling performance. Individual responses to training vary, and factors like injury, illness, and life stressors can also impact progress. Now we’ve talked about the factors that impact the progress you make – let’s take a look at some research on the matter…
What does the science say?
Research on cycling performance improvement is extensive, and various studies have explored factors influencing progress. Here are some key findings:
1. Training Intensity and Volume:
– A study published in the “Journal of Strength and Conditioning Research” (2017) found that high-intensity interval training (HIIT) can lead to significant improvements in cycling performance compared to traditional endurance training.
– Another study in the “European Journal of Applied Physiology” (2018) suggested that a combination of high-intensity and moderate-intensity training may enhance both aerobic and anaerobic cycling performance.
Essentially, absolutely smashing yourself for very short periods of time (maybe 3-6 weeks) you can get away with large increases in volume and intensity and this will lead to fitness gains, especially in relatively untrained people but you need to be aware this is not a long term solution.
2. Genetic Factors:
– Genetics play a role in determining individual responses to training. A study in the “PLOS ONE” journal (2015) highlighted the impact of genetic variations on endurance performance, with certain genes influencing factors like oxygen transport and utilisation.
There are athletes with world leading adaptation to training stimulus but it’s not all genetics. On top of this, it’s possible there’s athletes who are genetically predisposed to certain training stimuli and others to different stimuli – meaning studies may look as if certain people are gifted but actually just happen to be predisposed to the type of stimulus applied in the study.
3. Age and Adaptation:
– Research in the “Journal of Strength and Conditioning Research” (2013) indicated that older individuals can still experience significant gains in cycling performance through proper training. However, adaptation may be slower compared to younger counterparts.
We know age plays a role here, and the older you are – especially once you’ve passed the age of 35, the slower those gains will come.
4. Nutrition and Recovery:
– Nutritional strategies, including carbohydrate intake and timing, have been shown to influence cycling performance. Additionally, adequate recovery, including sleep and post-exercise nutrition, is crucial for optimising progress (Journal of the International Society of Sports Nutrition, 2017).
The most recent research says well fuelled training, with adequate micro and macro nutritional intake alongside as much sleep as humanly possible will lead to the fastest possible adaptations. Making sure that you eat enough to maintain energy availability is also important – your body cannot adapt if it does not have the fuel to do so.
While studies provide valuable insights, it’s important to recognise the variability among individuals. What works for one person may not work as effectively for another due to differences in genetics, training history, and other factors.
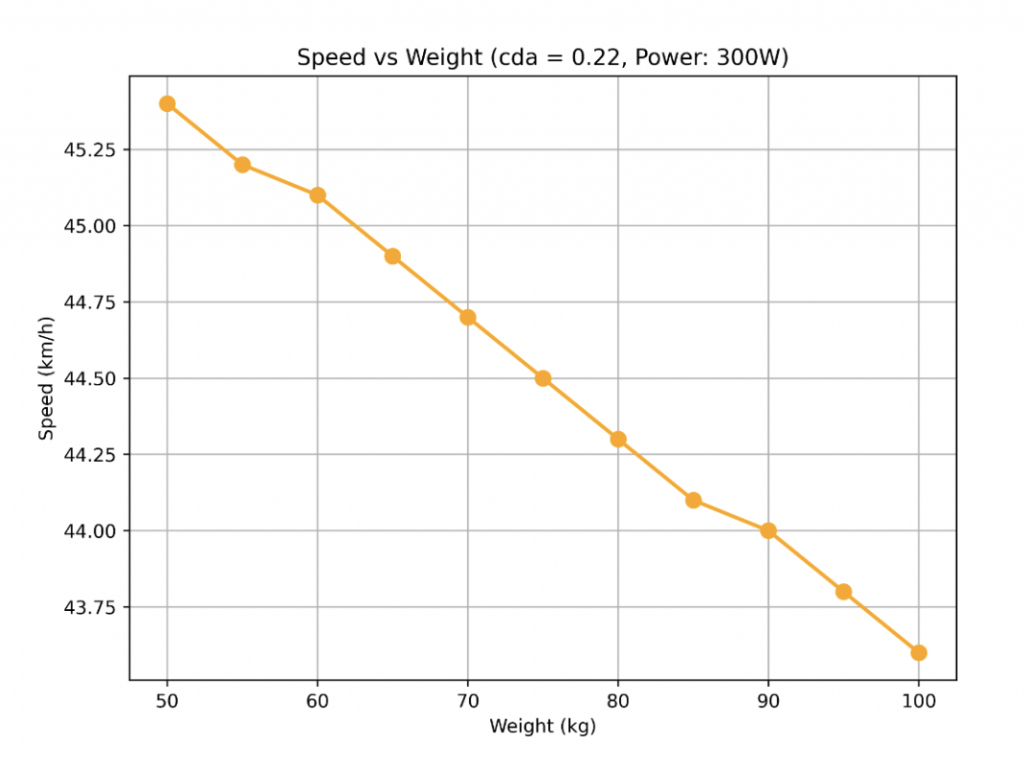
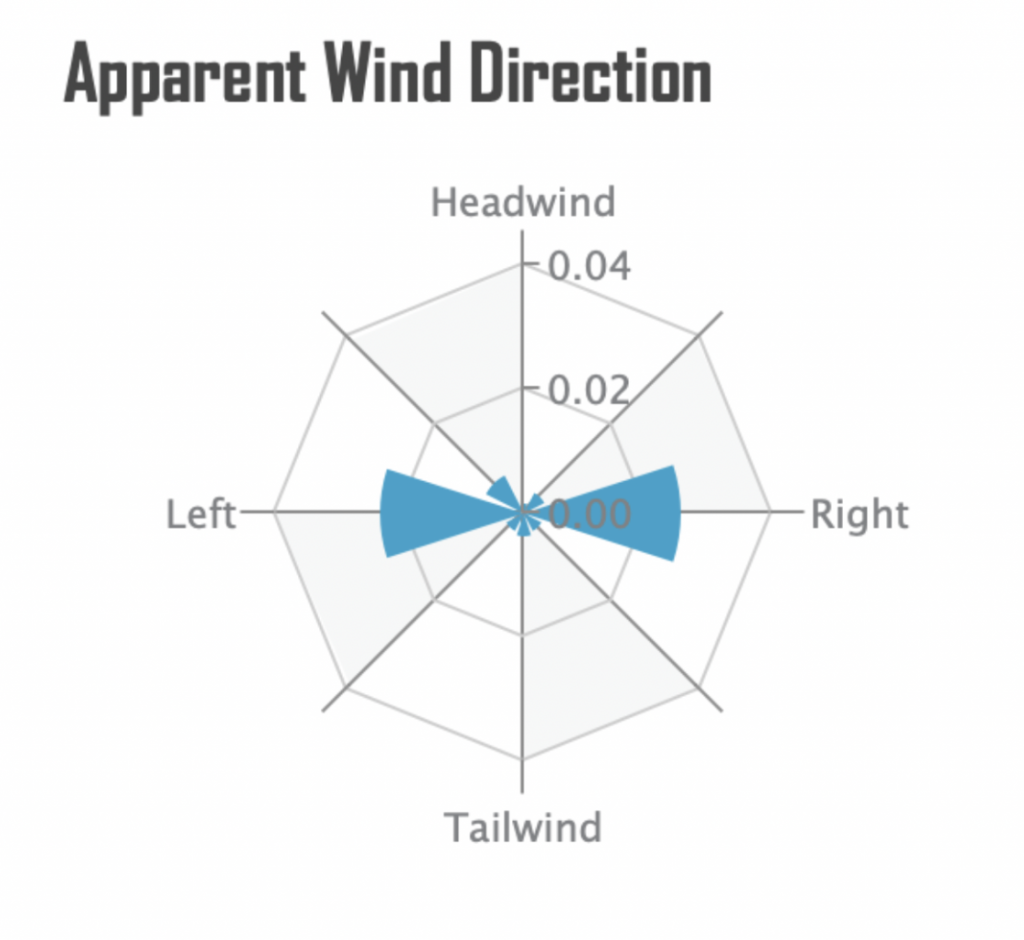
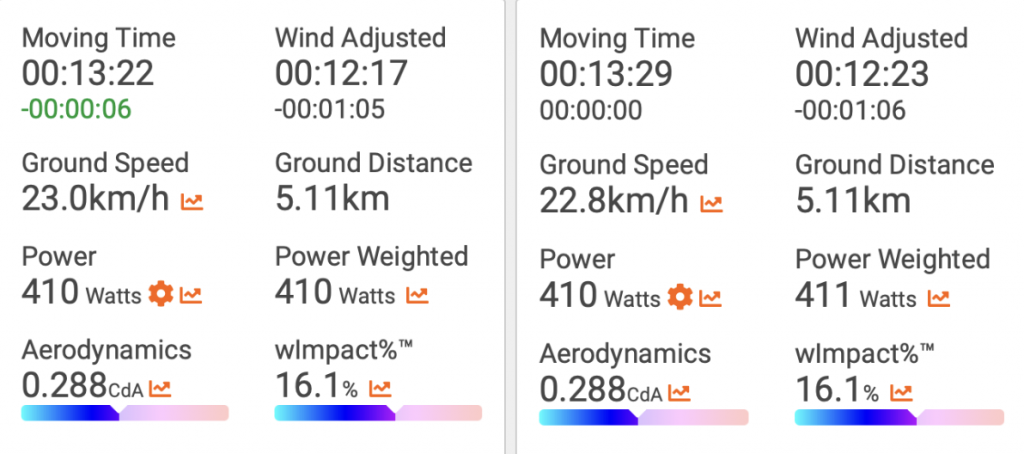
In practical terms, four weeks is often a short enough time frame to see improvements. Especially for shorter duration events like a ten mile TT. During this period, you can improve your power maybe ten percent or so – especially if you’re starting fresh, but you can also massively reduce your aerodynamic drag with myWindsock aero testing, on top of this you’ll be able to pace perfectly using myWindsock too – leading to huge time savings all in! Sign up here.