FTP RACING – U7B – 9th April

We’re excited for the FTP Racing U7B time trial on Saturday 9th April. This is a quick look at some course dynamics. All charts are correct to the current forecast. We recommend viewing your own forecast, to see the most up to date course forecast and data. View the course and the forecast for Saturday here.

How the course will feel

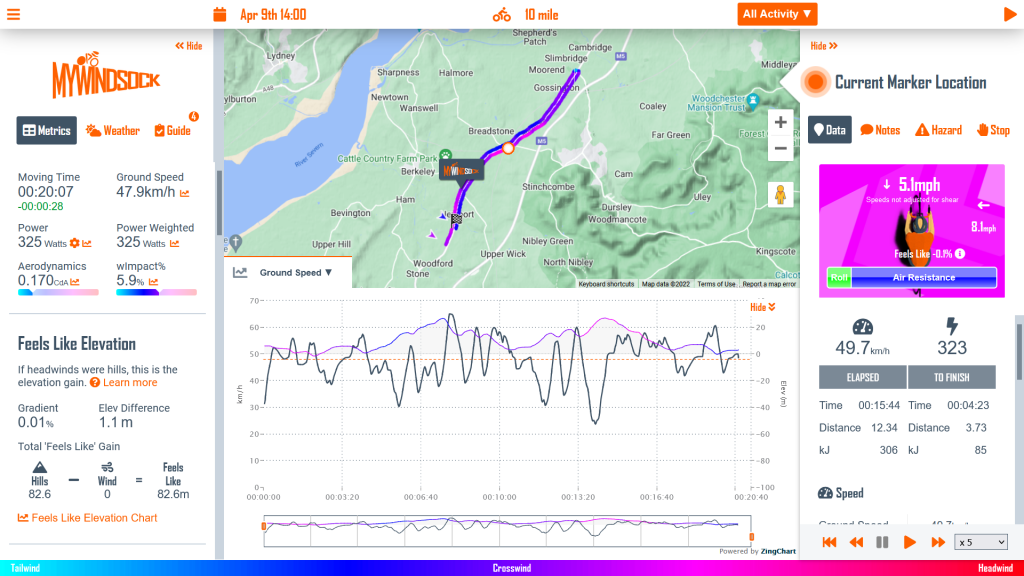
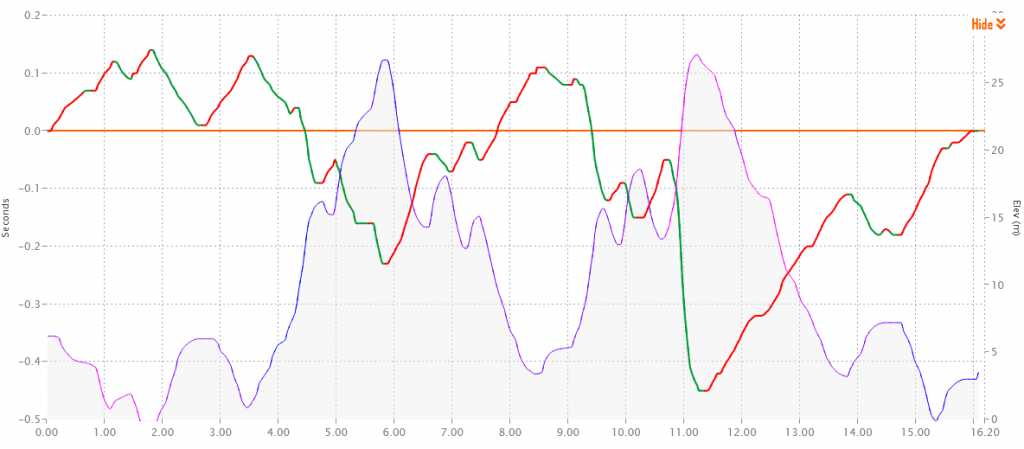
‘Feels Like Elevation’, helps us to visualise the wind in the same way as we would the elevation profile of a hill. We are equating the wind to the hills. Helping us to see how the wind would feel, by viewing it’s equivalent gradient. This helps us formulate our mental strategy for race day.

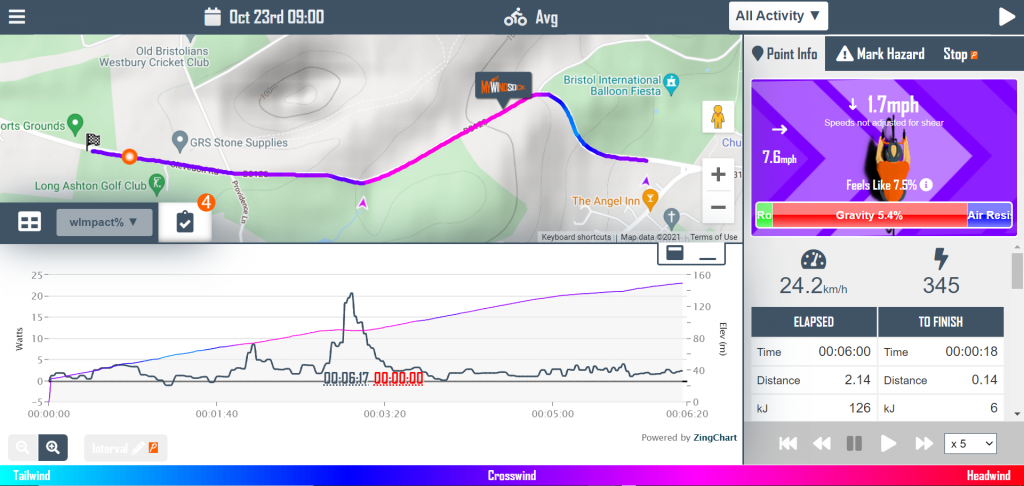
Below is the graph for Saturday’s race. The Westerly 10mph wind, is now combined with the elevation profile. The grey area is simply the standard elevation profile. However, the coloured line shows the wind and elevation together to give you a clearer idea of how the course will feel.

The red areas are showing that the wind has created harder feel than the original elevation profile would suggest.

Feels like elevation, when we factor the feel of the wind combined with gradient

Where should we put more power out

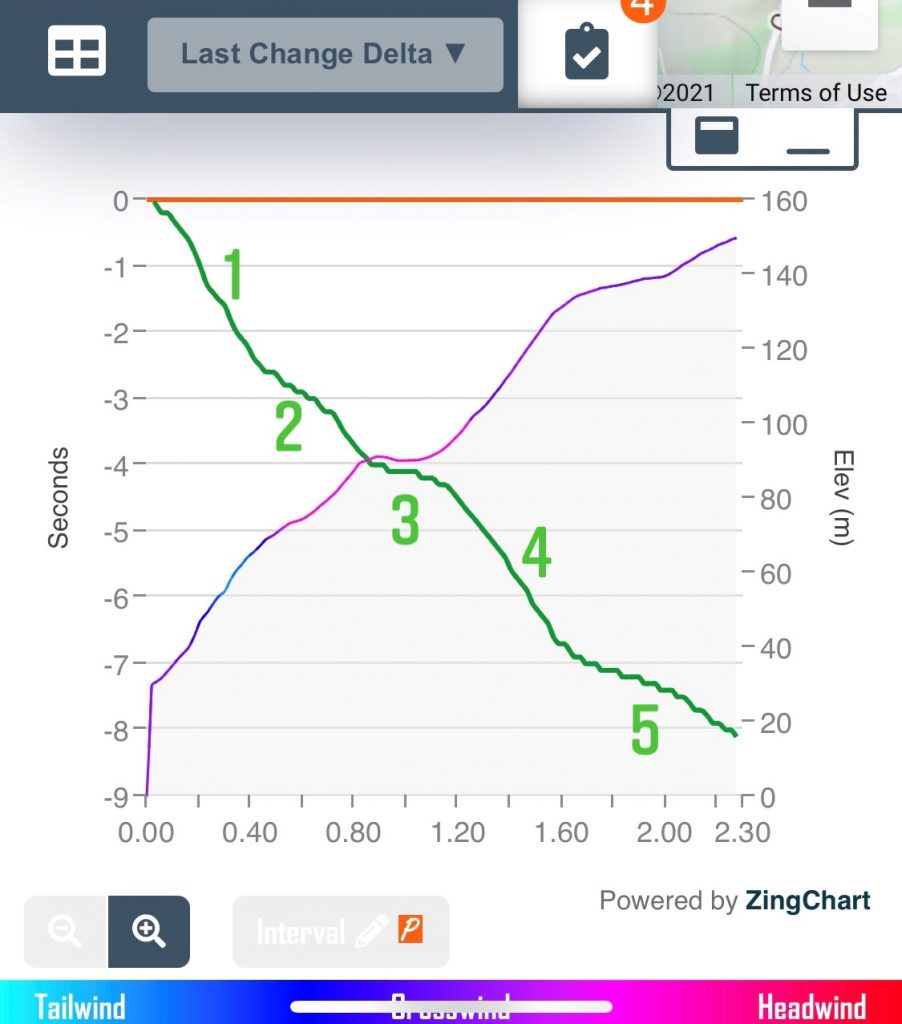
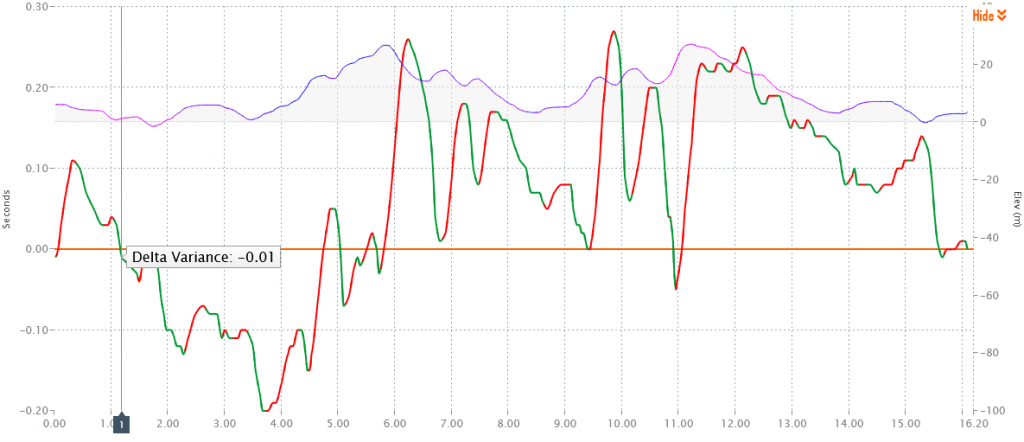
We next turn to where the course will give us the most return, for a little extra power. The green areas of the line chart below shows were on the course we get the greatest return for each additional Watt. Pay attention to 3.5-6km, 9-9.3km and 10.75-11.25km, those locations will give you a good return on a slightly increased power output.

On the flip slide, the red section, will give you an idea as to where it would be less advantageus to increase your power. Looking at 11.25km to 14km, it wouldn’t be as efficient to increase power here. Better to increase the power in the preceeding 0.5km.

Where power has the greatest affect on time. Green shows where you get the most return for each Watt.

Where aero is most important

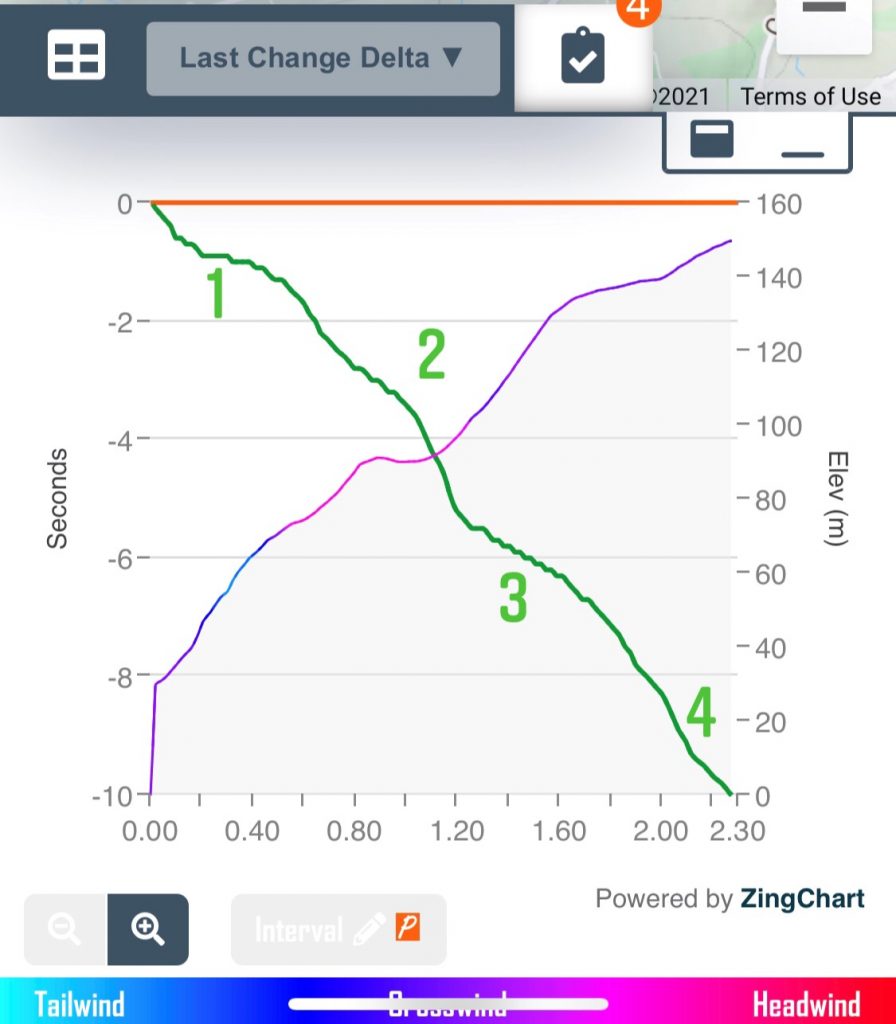
Next, where on the course does an increase in our focus on aero pay off the most. This is depicted in Green below. In red aerodynamics are having less affect on the overall speed. This is not to say aero is unimportant in these areas. This graph simply shows that if we were to increase our aerodynamic efficiency where along the course would that increase in efficiency give us the greatest return.

Where aero has the greatest affect on time

You can make your own experiments using myWindsock for all your time trials. We have all the UK time trials already preloaded for you. Simply visit our CTT Time Trial Forecasts.

Saturdays are for Parkruns

Did you know we have all the parkrun courses uploaded on our site? (If your course is missing or an old version, please let us know here and we can update it for you.)

Simply click on your location to find a course near you.

MyWindsock gives you a full detailed course and weather analysis. See how the wind and weather affects your run on a given day either post run or pre run to help you prep. For example, here we have Congleton Parkrun at Astbury Mere, which is normally a flat course (shown in grey). We can see how the wind gives a small up hill, down hill feel with the wind direction so this can help us better prepare going into our run and pace ourselves accordingly.

Blue is tailwind

Red is headwind

VIEW MAP HERE

UH16 – FTP RACING – 23rd Oct

On Saturday the majority of the climb will be in a crosswind from the south (Shown in pink and purple).

Correct as of 20/10/21 11:30am

CHECK OUT THE LIVE FORECAST HERE

So lets get on to what we’re all really interested and look at how we can be the fastest possible.

Hammer the power?

So here we see the time for a person with a bike and rider weight of 80kg, putting out an average of 350W and a CdA OF 0.335

Lets look at what happens if we put out an extra 10W across the course.

Shown in green meaning a quicker net time – we can see we have gained 8 seconds across the course by putting out 10W more.

So at the start (1) the green line becomes steeper meaning putting out more power here is important and will make a bigger difference.

At 2 and 3 we can see the line flattens out, meaning the increase in power hasn’t actually made much of a difference to your time here so you don’t need to waste extra energy pushing here.

Number 4 the line is at it’s steepest over the whole graph so here is where we really want to push out the power.

The finish (5), again flattens off, so obviously push out whatever you have left, but the best place to really focus on is number 4, just before the end!

The other big question is seated or standing? Obviously you can push out more power standing but sometimes to maintain standing for the whole climb isn’t always possible. So is there a best place to take a rest?

Seated or standing?

So here we see what happens if we are seated for the whole climb. I’ve lowered our CdA by 0.07. We have a net gain of 10 seconds across the course, but this is assuming we can keep the same 360W sat down and standing.
At number 1 we can see the line is flatter which means having a lower CdA doesn’t make a huge difference so the best thing is to get out of the seat and get the power out.

At 2 we can see the graph is steeper and we saw from the power graph that the increase in power isn’t actually as important here, so here is the ideal time if you need a break from standing, lowering your CdA is favourable.

3 has a slight slope but is flatter than most of the graph and we know that this section, the power really makes a difference, so standing here really is your best bet!

4 gets steeper again so the lowered CdA will make a difference to your time in the region of about 2 seconds quicker.

General overview

The weather impact graph shows the percentage more watts you will have to put out compared to baseline weather less conditions. As we can see from here, the middle of the climb has a very high weather impact of over 20%.

.

For live updates and to play around with your own numbers, find the forecast here.

.

These numbers are for a rider and bike of 80kg, CdA of 0.335 and 350W, with weather conditions of 20/10/21 – 11.30am

CdA or Power? Where should I attack?

When attacking in a race, you need every Watt possible optimized to create maximum distance between you and your competitors.

The myWindsock resistance chart shows you each force acting against you and it’s proportions when moving forward.

resistance

On a ride, the limiting factor on your speed is the fact that your power is equal to resistances against you. Choosing areas in yellow means high acceleration opportunity, so this is a good place to attack as other resistances are lower here and not a limiting factor.

Areas with high proportions of blue show that wind and air resistance is a strong limiting factor so CdA is particularly important here. The reverse goes for areas with low amounts of blue – CdA isn’t as important here as air resistance is lower, so it might be better for you to get out of the saddle here and just focus on getting the power out.

After that KOM, Course Record or a new PB?

Everyone wants to be the best athlete that they can be and get the fastest times they can possibly achieve.

But do you ever feel that you’d perform so much better if you didn’t have to battle a headwind?

Well… what if i told you, you don’t have to battle that pesky headwind!

With segment windsocks, you can choose a Strava segment that you would like to target and be informed when is the ultimate time to attack.


So how do you do this?

  1. Simply set the bell on the segment windsock

    segment

  2. You’ll then get alerted when it is optimum conditions

    email

  3. Win the day!

    qom

Almost late for work

I ride back and fourth between work and home quite regularly. On paper, the way out should be easiest with only 97m elevation compared to the way home being 108m elevation. So why did the way out feel so hard??

On the way there I had 89% headwind!!! This gave me a feels like elevation of 170m. Without knowing it, I had climbed up mow cop, our local climb (150m).
On the way home I had only 14% headwind, meaning 86% tailwind making the 108m elevation only feel like 93m elevation!

0004 wind

Looking at the wind impact is quite amazing on out and back journeys because if you’re going straight into headwind it has a massive effect! I’ve done the journey before and it’s taking me 33 minutes with a relatively easy effort but it took me 50 minutes with the headwind as it was today!

Luckily I wasn’t late to work but I did cut it close!

0005 mow cop


Mow Cop – 150m elevation gain