Ben Norbury is four times Manchester & District Middle Distance and Best All Rounder Time Trial Champion from 2016-2019. During this time he developed software to eliminate uncertainty of the weather conditions out of his pre-race preparation.
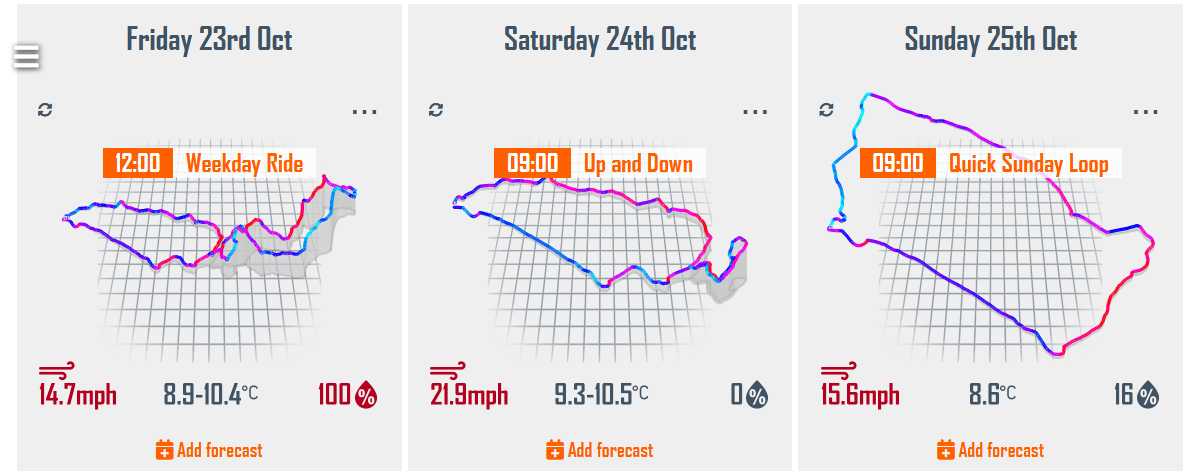
I created the myWindsock Planner so I can view all the cycling weather I can expect for the week ahead. I really like seeing what I can expect well before I ride. Which days will be wet, windy or rather pleasant. It’s especially useful this time of year in the UK where the weather is so changeable.
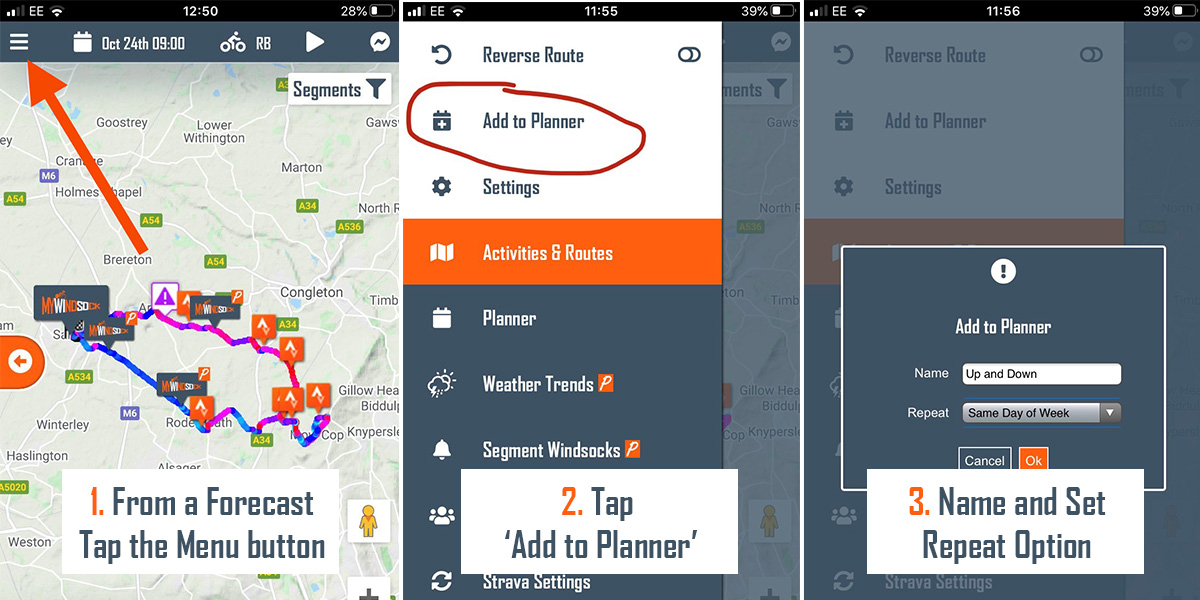
I wanted to ensure you knew about the feature so you too can view ride summaries for the week ahead. Set your regular rides to repeat however you wish so your Planner is always current.
I hope you will try adding forecasts to your Planner. Don’t forget you can reuse any of your past rides as a forecast by clicking ‘Use as route’ or simply changing the Date and Time when viewing a ride.
We’ve created a new myWindsock Strava Club. We will be providing tip and tricks to get the most out of myWindsock. Plus the announcement of our latest new features.
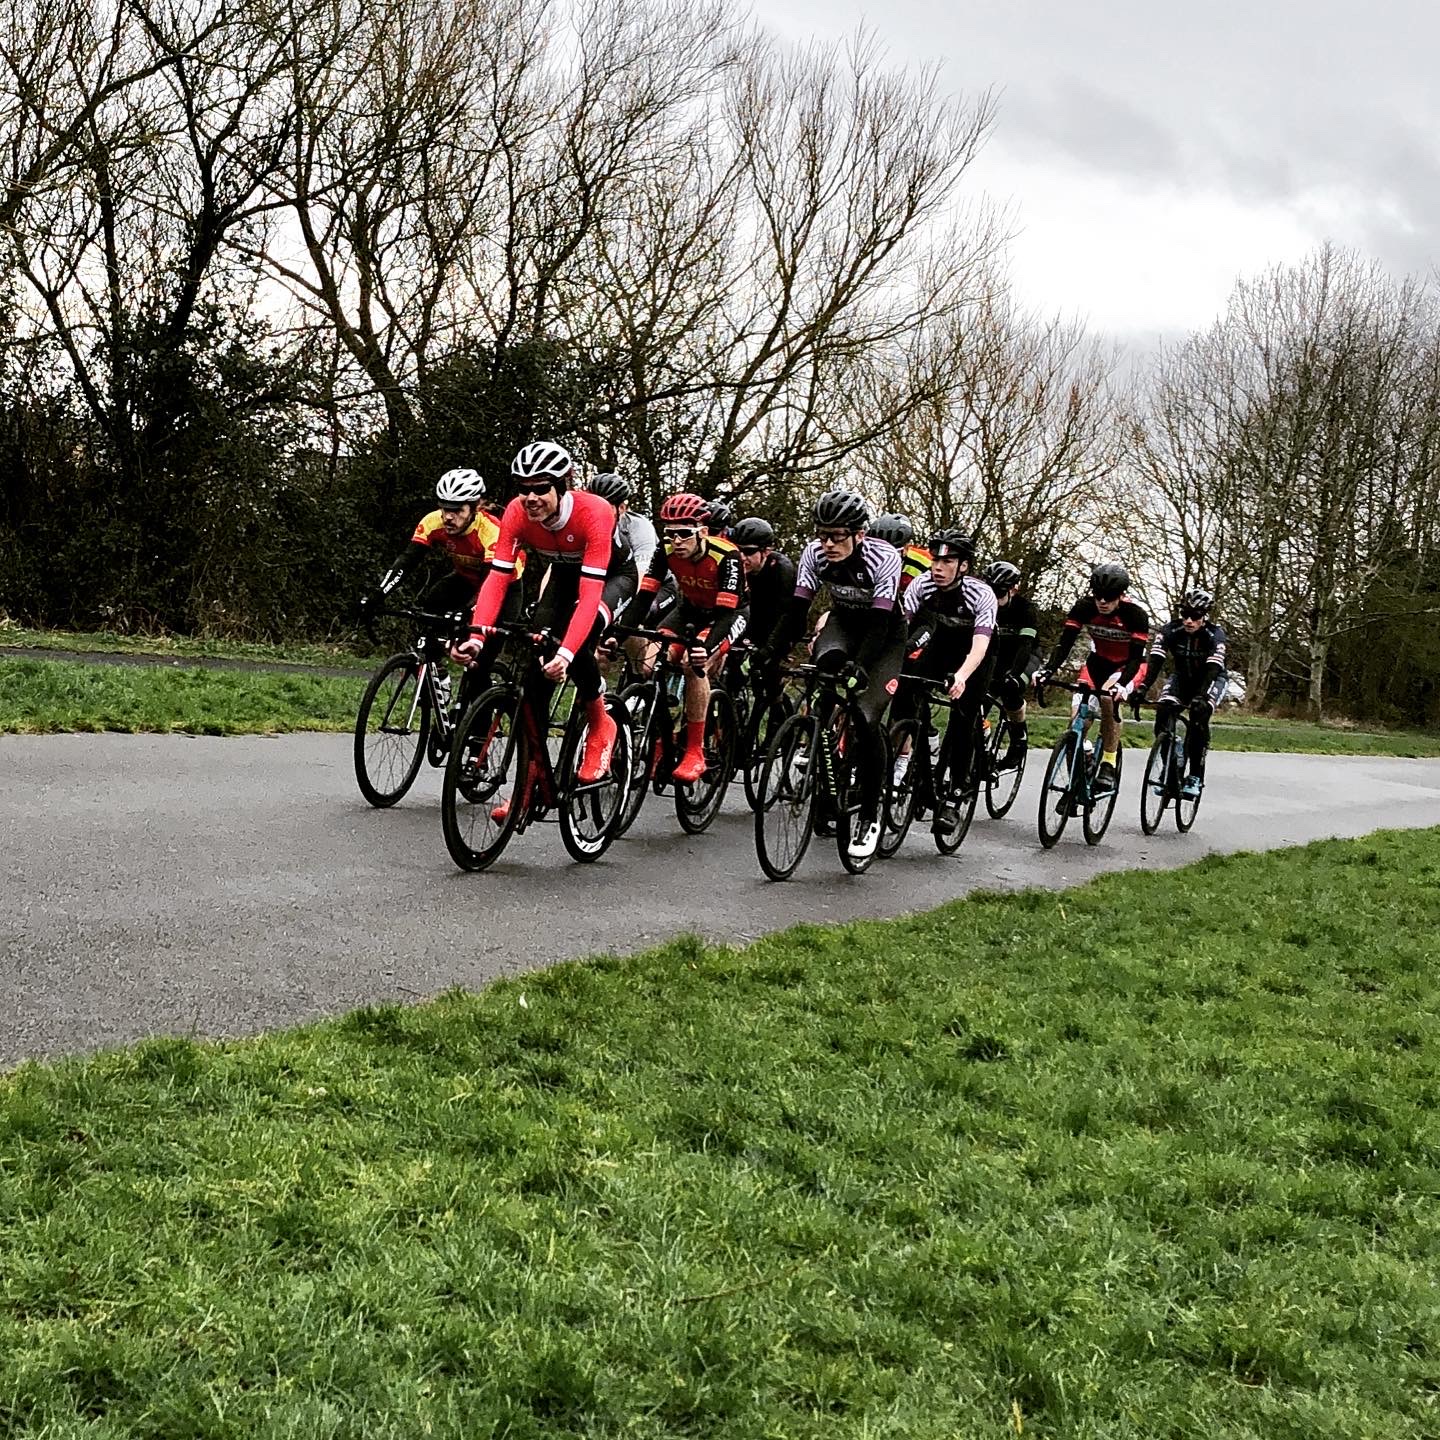
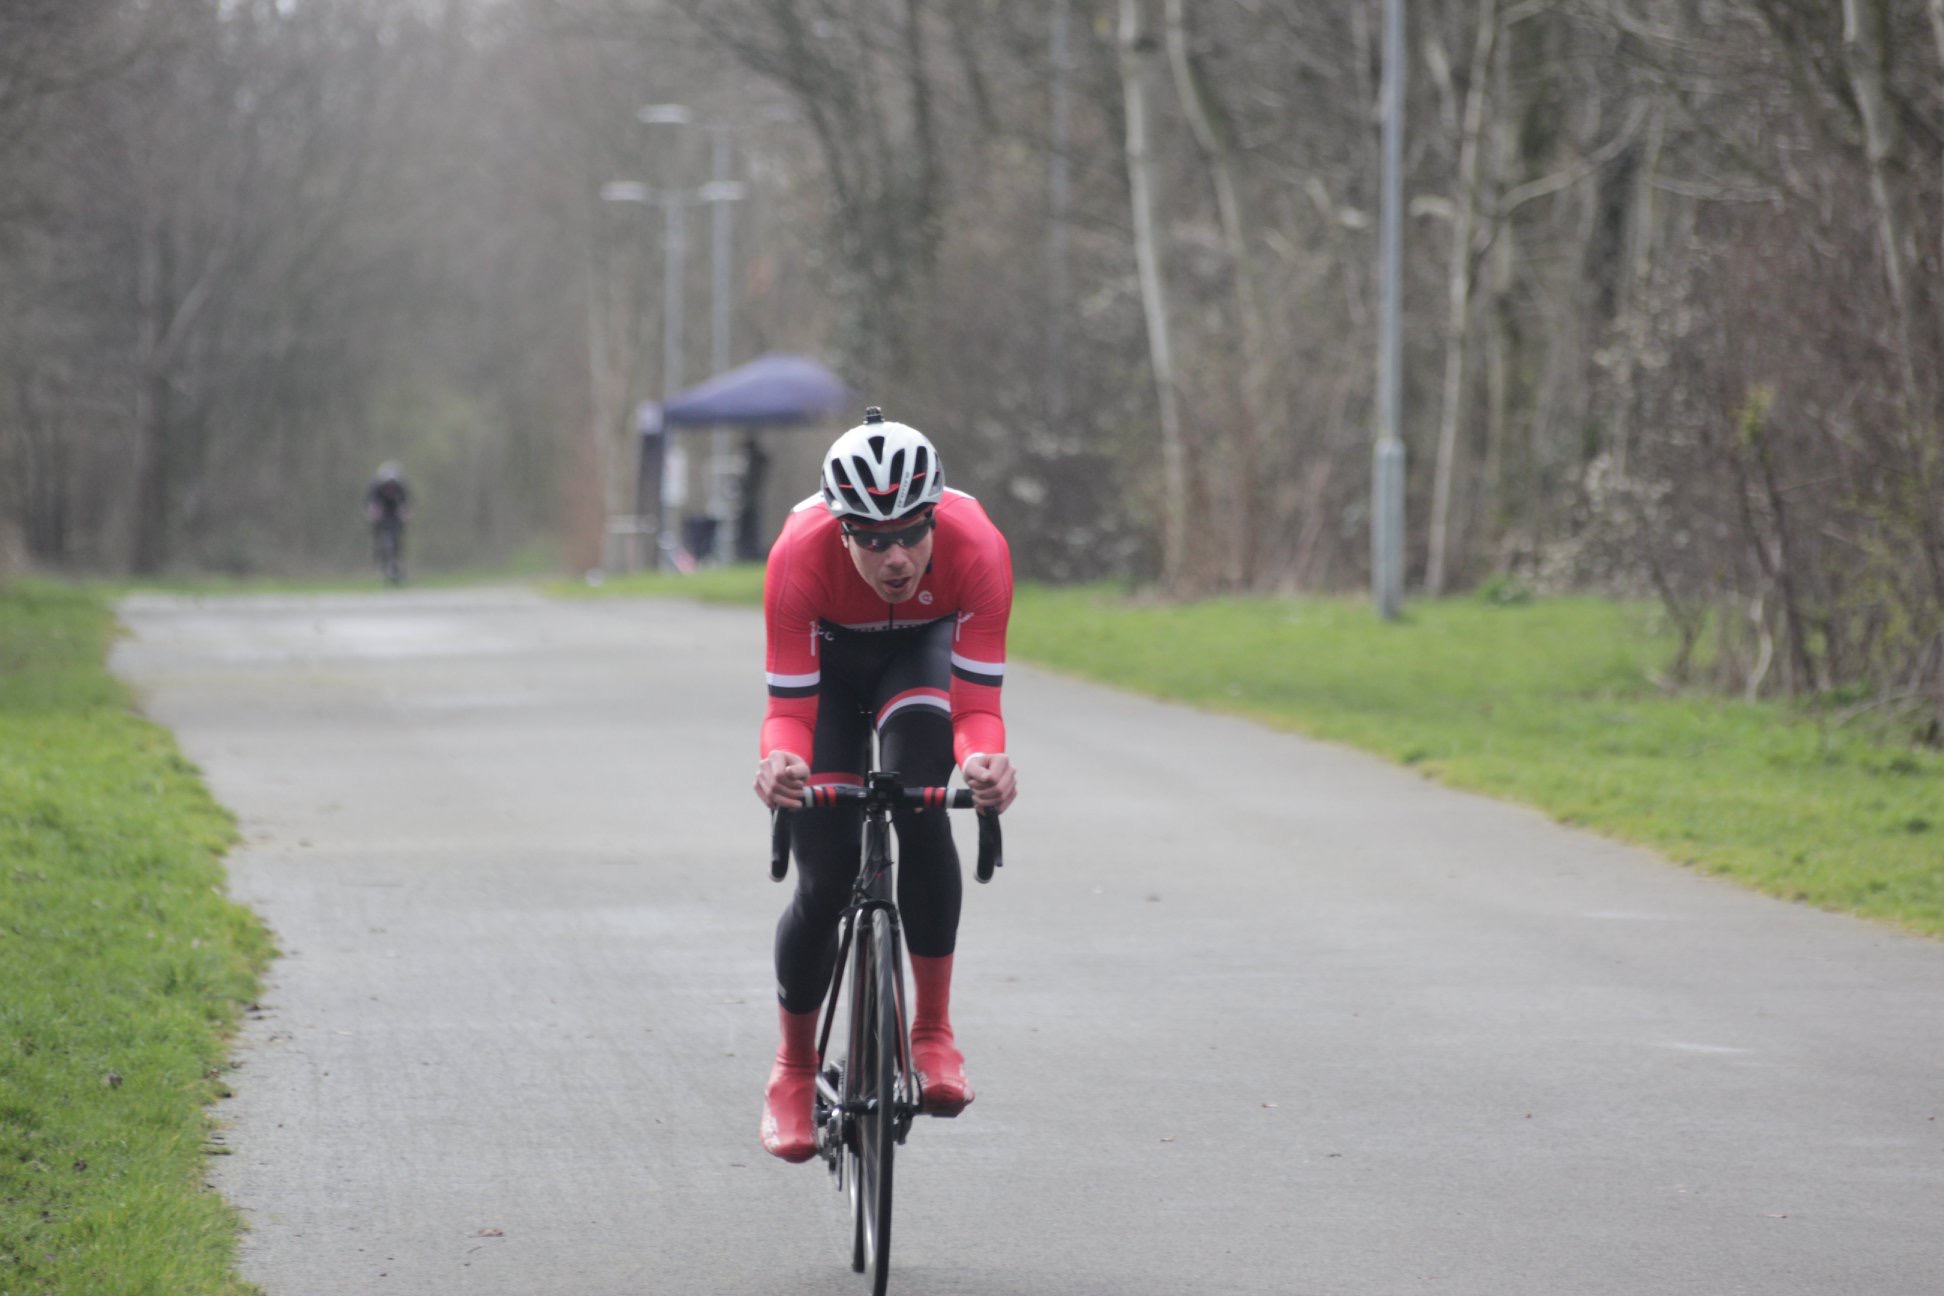
I took part in my first bunch race last Saturday. It has been a great opportunity for me to understand the applications of myWindsock.com for planning and analysing mass start races.
One especially cool thing from racing on a circuit is that I am collecting loads of aero data. Each time I cross the same point on the circuit myWindsock.com caclulates my CdA (Aero Efficiency). So this is what I thought I’d show you here. Then you can do the same analysis for your own races. How well do you shelter in the bunch? Find out by analysing your race on myWindsock like this.
My Race’s Aero Analysis
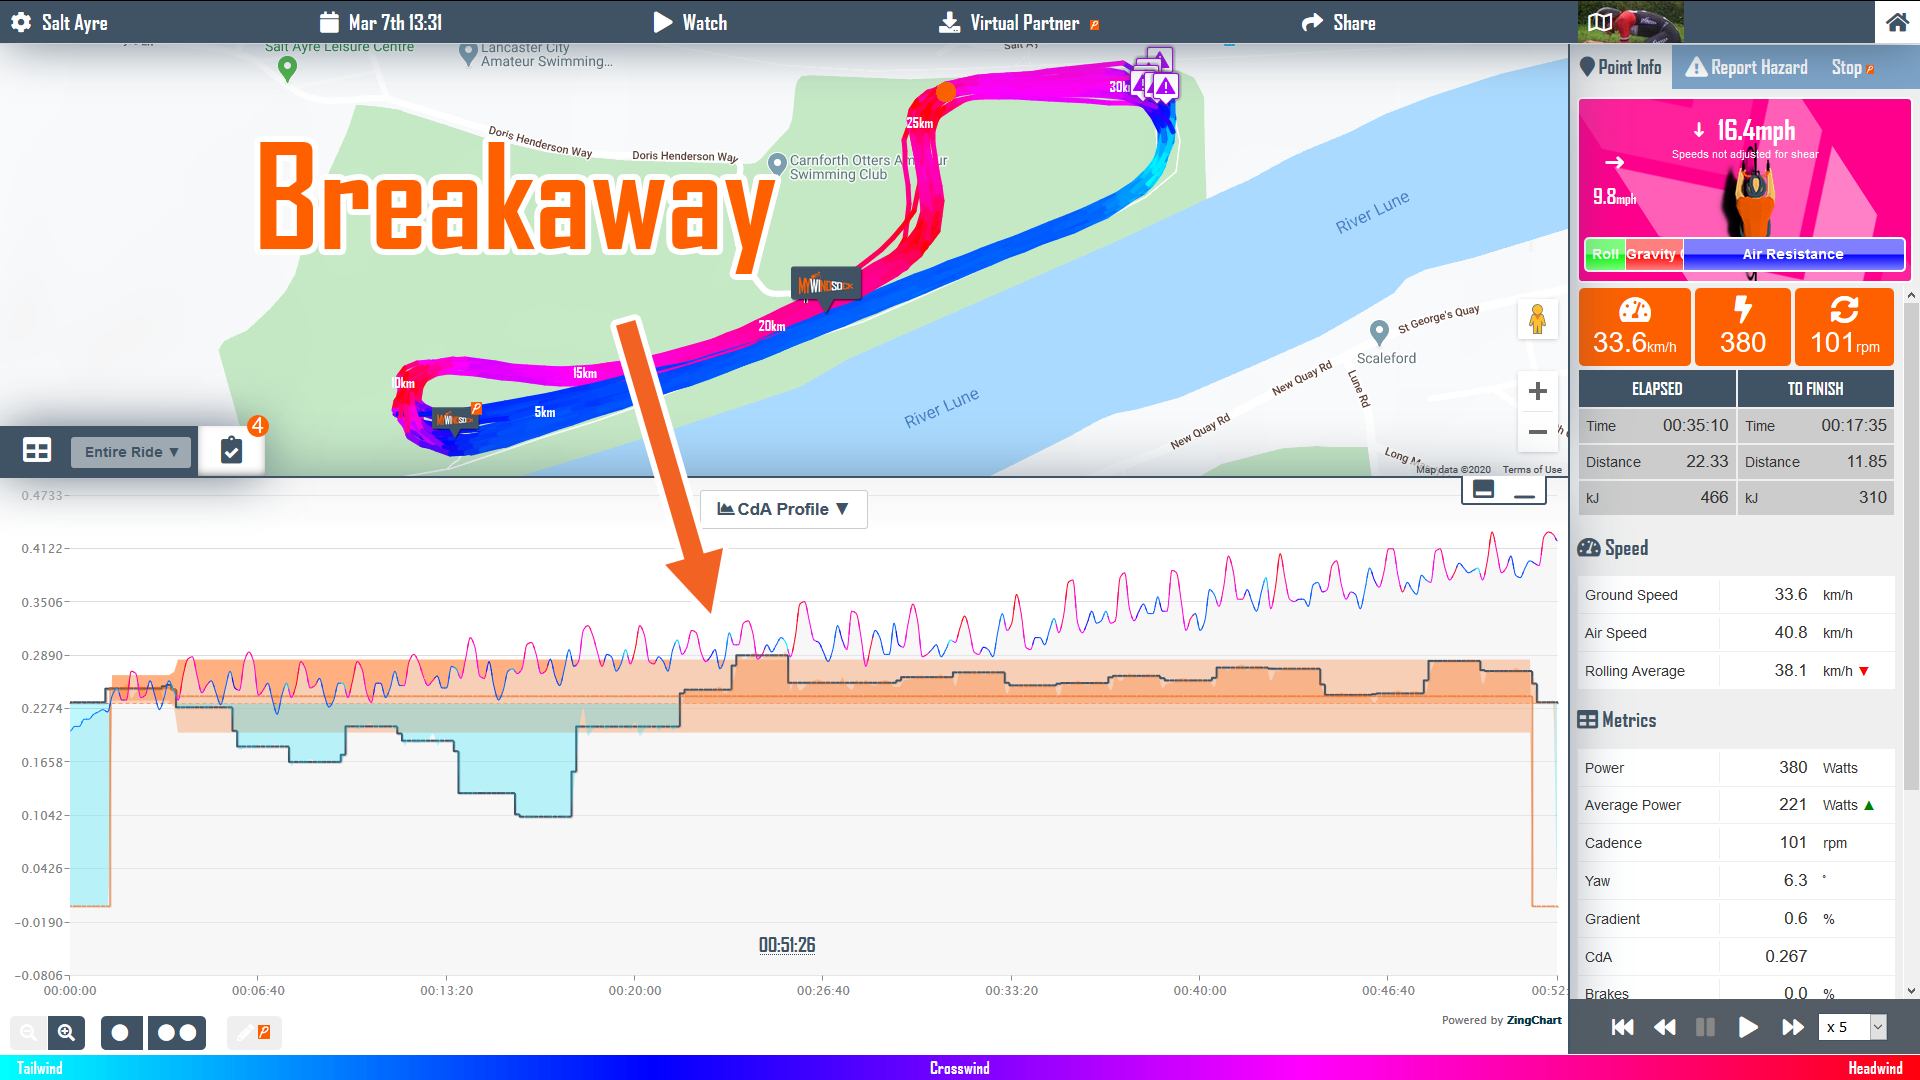
Have a look at my CdA profile for the race…
Blue section I am in the bunch more aero than the ride average.
You can see the Blue section is where I was in the bunch. Hey look! good for me with practice I became more efficient using the bunch for shelter from the wind. I can see this because the Stepped line representing each lap’s CdA gets lower and lower. The blue represents me being more aero than my average CdA for the whole activity.
Evidently by my CdA I didn’t spend all my time on the front 😉
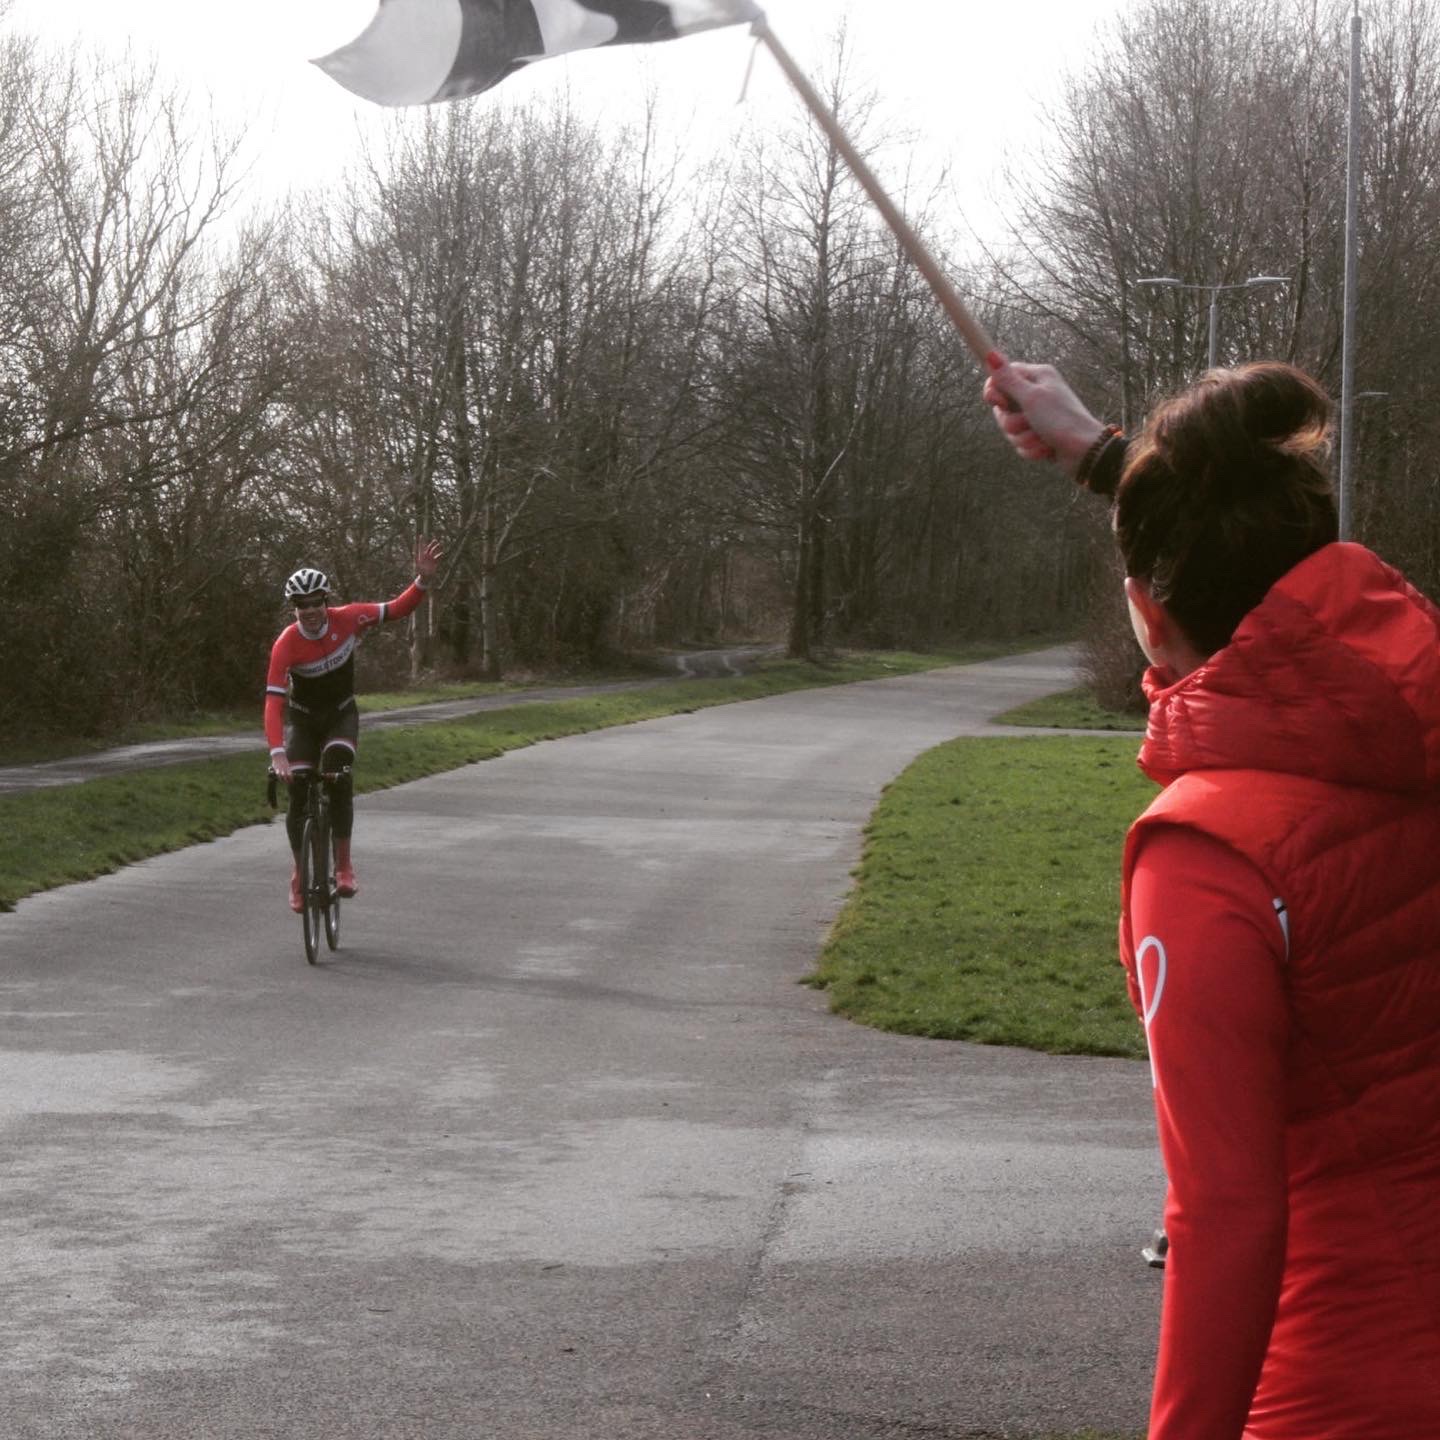
The Breakaway
After 20 minutes I decided to go for a breakaway and except for a couple of laps to start with, it was solo effort to the finish. You can see this on the above graph, I stop being in the Blue and my CdA is up in the shaded orange section, I am now less aero than my average CdA. Each step in the line represents my CdA for a lap. I am happy that I was pretty consistent at keeping my Aero Position.
My solo break. My CdA is super consistent! All those years of time trials.
Overall Aero Stats
So how did my aerodynamics change from the Bunch to my Solo Break. Using the conditions on the day I have also used myWindsock to estimate Watts to lap the Salt Ayre course at 25mph.
CdA
Watts @ 25mph
Full Race
0.238
315
In the Bunch
0.188
265
Break Away (Solo)
0.264
350
Crossing the line.
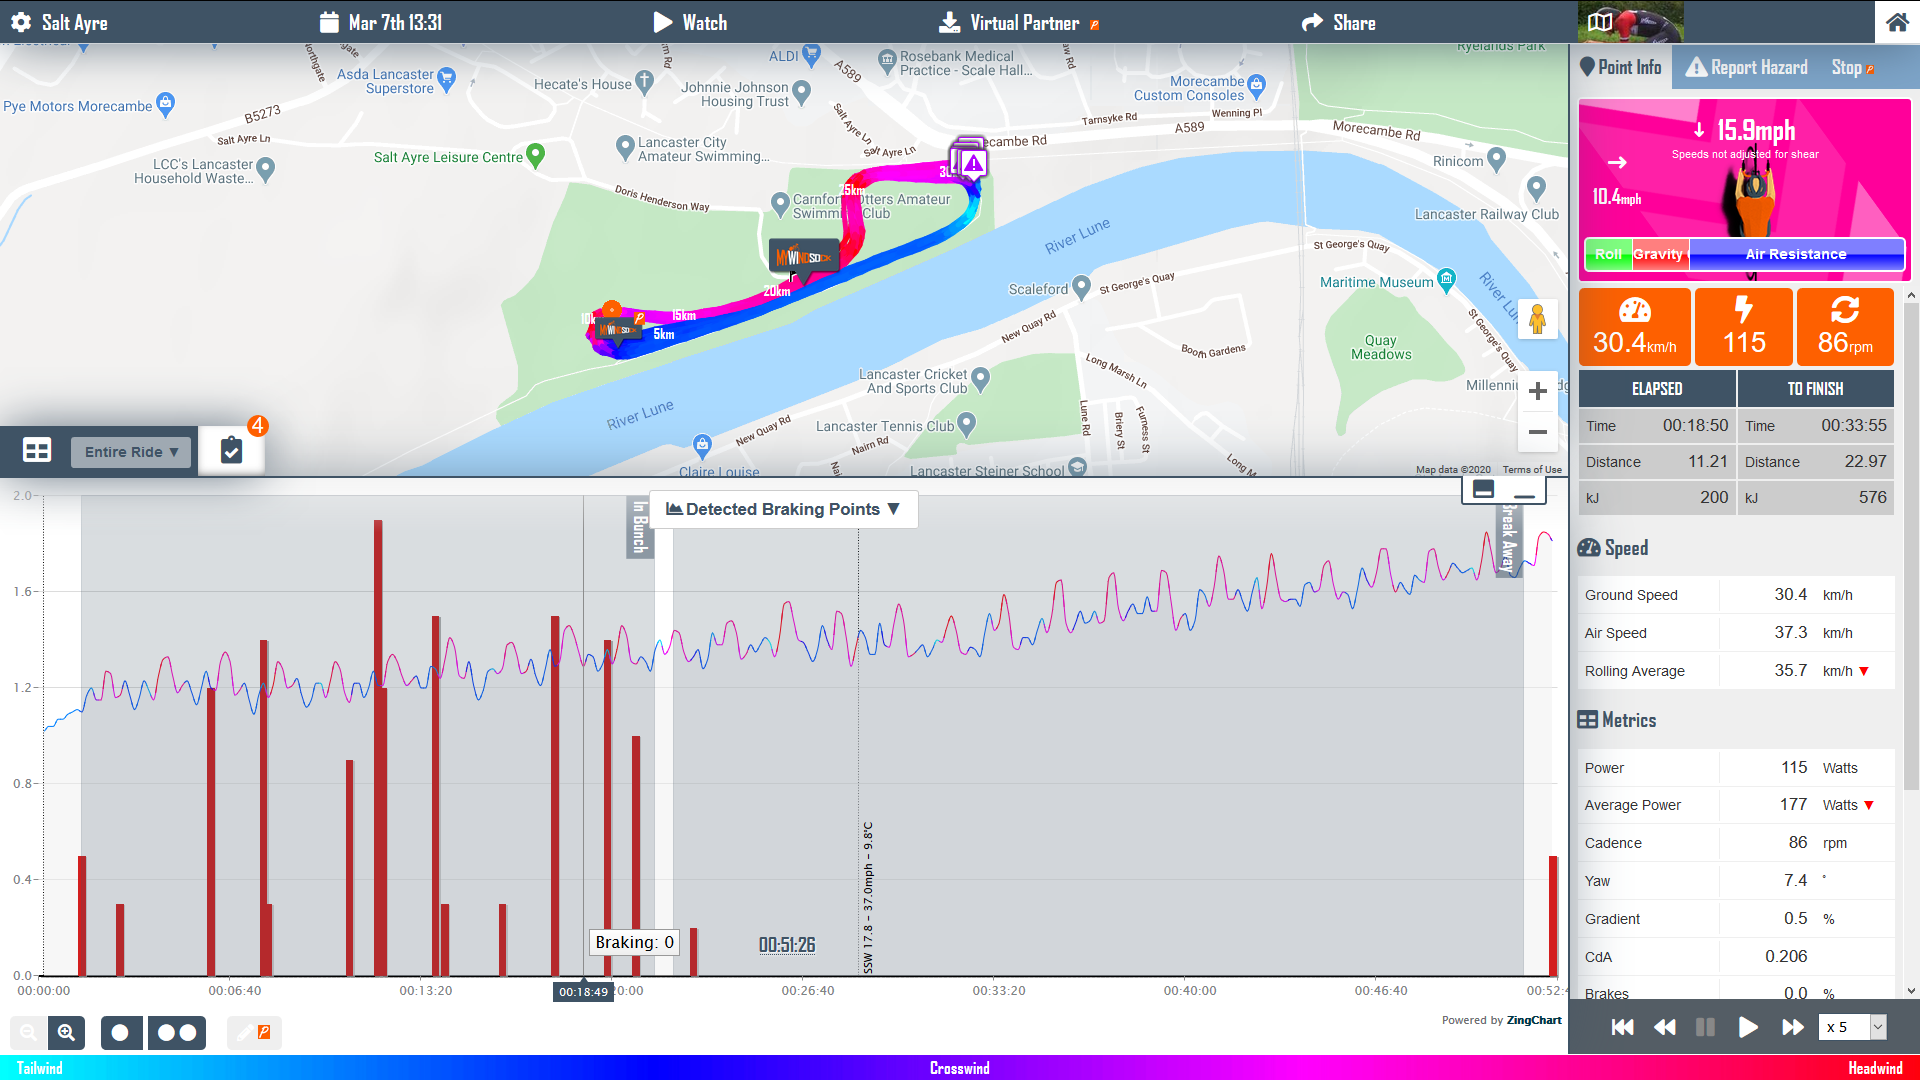
One more thing… Braking Analysis
In the below picture you will see the myWindsock.com Detected Braking graph. Interestingly I only used the brakes when in those first 20 minutes when in the bunch. Braking is taking away your energy. By attempting to reduce the amount of braking by being less reactive when riding in the bunch may be away to further conserve energy. This is just a thought.
The red bars are braking instances. I only touched the brakes when in the bunch.
Analyse your rides and races
It’s easy to access your ride’s CdA and analyse with myWindsock. You can connect Strava to myWindsock.com and view all your Activities and Segment efforts immediately. Or simply upload your ride file to myWindsock.com Get started here.
If you have a GPX file or Strava Segment Link for any of the following courses please can you send to me. I’ll then add them to the Cycling Time Trials Map.
a10/c
a25/3
A50/2
AS/9
b12/3
BS20
C10/29
CS/19
d24hr
D30/1
D310/10
F2/50
FHC/2
GH/44
H10/3
HCC178C
J9/22
k52/50km
L156
MH22
O19
P845/25
P884A/30
PHC91
q12
R15/5
RH/12X
rs/20
RS/24
S/Long Hill
S130/10
S1R/10
s6/15
T107
thc7
UH60B
V210
V251
WE10/01
WE16/01
WE25/02
WE50/01
wm30/01
ww01/01
ww17/02
If you have a GPX file or Strava Segment Link for any of the following courses please can you send to me. I’ll then add them to the Cycling Time Trials Map.
Check out the all new myWindsock.com Planner! All of your week’s, in fact next 10 day’s, weather for your planned routes. Go to your myWindsock.com account now and start adding your regular routes.
No need to add your routes each week, simply set a route to repeat however you wish. For example my club training ride is on Saturday so I have the route we use repeat each Saturday. It’ll always be there!
I’m off into the hills. I am reusing the route I did last Wednesday so I pick that from the Strava Activity list and click the ‘Use as route’ button to get today’s myWindsock.com weather forecast.
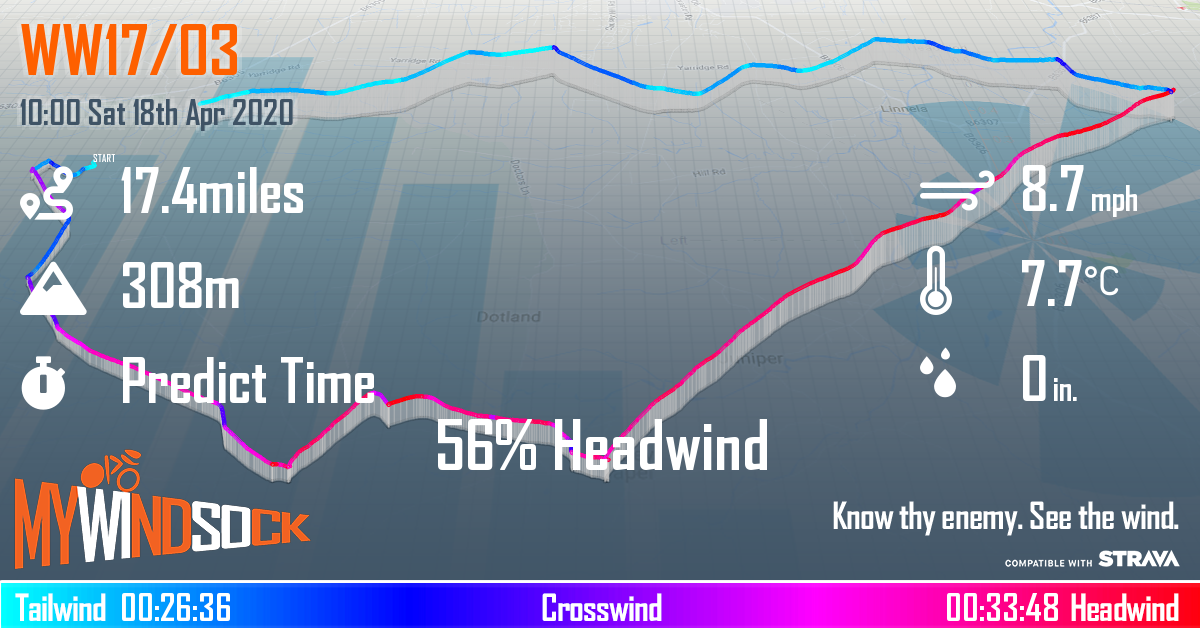
wWatts shows you the impact of the weather conditions as a percentage of your power output. In my ride today I have two very different headwinds. The first is for 20 minutes, it is flat and fast. The headwind absorbs 20% of my energy. Later on my route, another headwind is while I’m out in the hills. Overcoming gravity reduces the impact of the weather, absorbing less of my energy at 13% wWatts.
wWatts is a Premium metric. It enables you to quantify the weather conditions as a percentage of you power output on all of your Strava Activities and Segment efforts. It’s a great time to upgrade to premium with the discount code ‘winter20’ and so that you save 25%, you then pay only £14.99/year.
After a couple of tough days on the bike I want the easiest of rides today. The ‘Reverse Route’ function lets me see how my choice of direction around my training loop will affect the weather conditions I will encounter.
Today I can experience either 15 or 25 minutes of continuous headwind, just by my choice of clockwise or anti-clockwise of my training loop!
Go to Options (top left) > Course > Course Direction
No need to plot a route again! Kind of. Well today’s upgrade reuses your past Strava Activities to generate a route forecast.
If you are like me and you tend to repeat similar routes then this is for you. Simply click on the ‘Use as Route’ button on any Activity in your Strava Activity list and this will show the current forecast for that Activity’s route.
A myWindsock.com forecast is the unltimate in pre-ride reconnaissaince. Answer the big cycling questions. Where and for how long are the headwinds? What are the climbs and how long are they in today’s conditions? Where will the rain start, or stop?
For fun, why not filter the Strava Segments along the route for tailwind only and have a cheeky KOM hunt.


 UK Time Trial Events