Here at myWindsock we care about two things – predicting how the weather will impact your speed on the bike and riding fast time trials. That’s it. Today we have three tips for you that will help you, backed with some myWindsock science, ride a faster TT without simply pedalling harder.
Hold your position
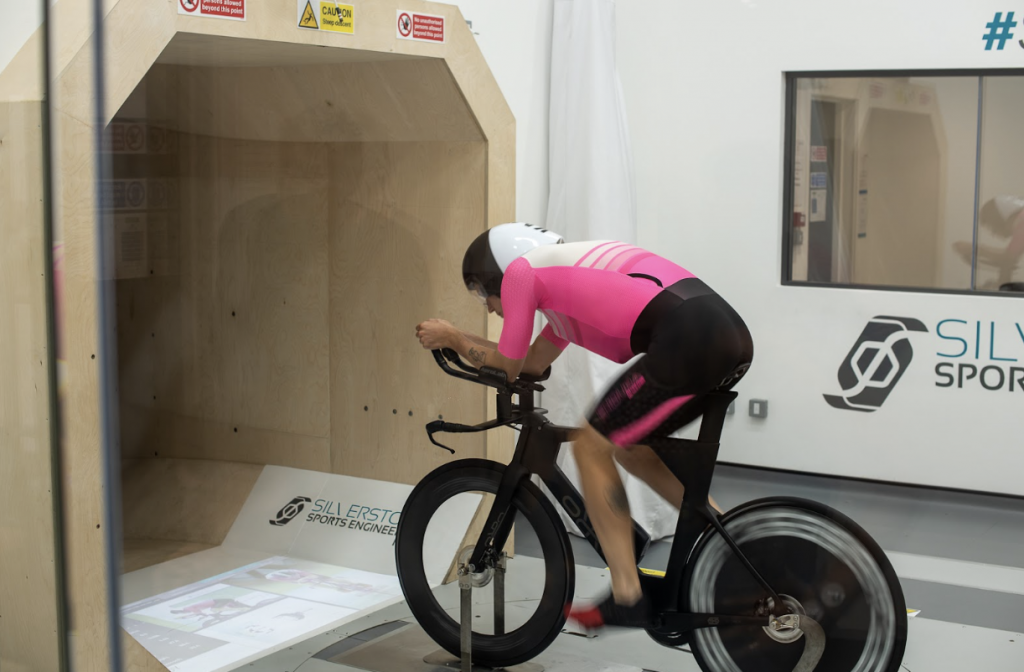
Staying in the aero bars during a time trial sounds like a trivial piece of advice but it’s something that was recently demonstrated by Red Bull Bora riders at the 2025 Tour de France – riding uphill in the aero bars during the mountain time trial to some pretty good success. Being more aerodynamic is typically faster even when speeds are pretty low.
How much difference does it make?
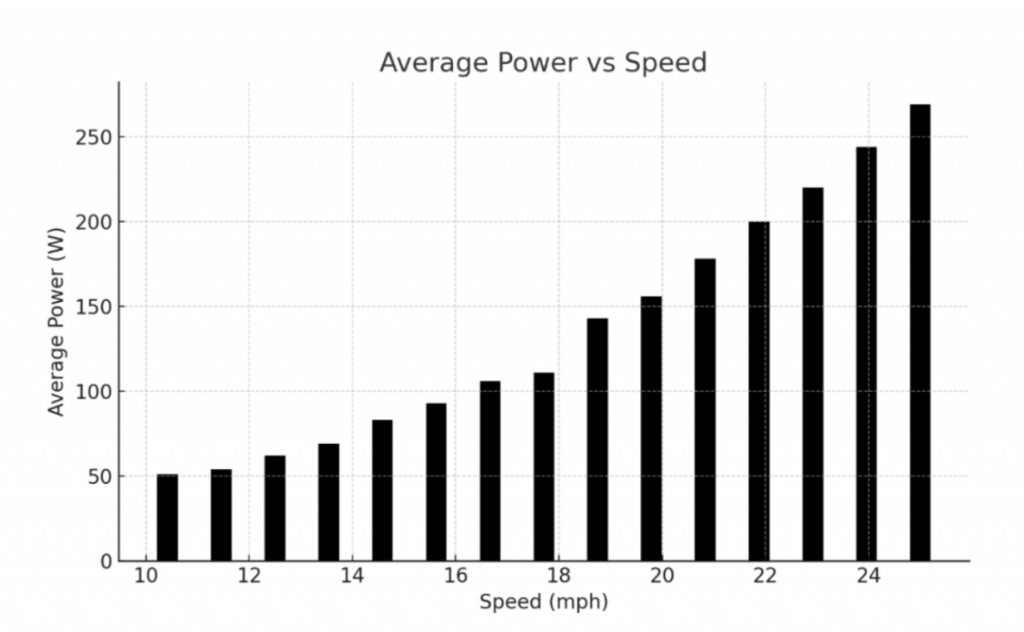
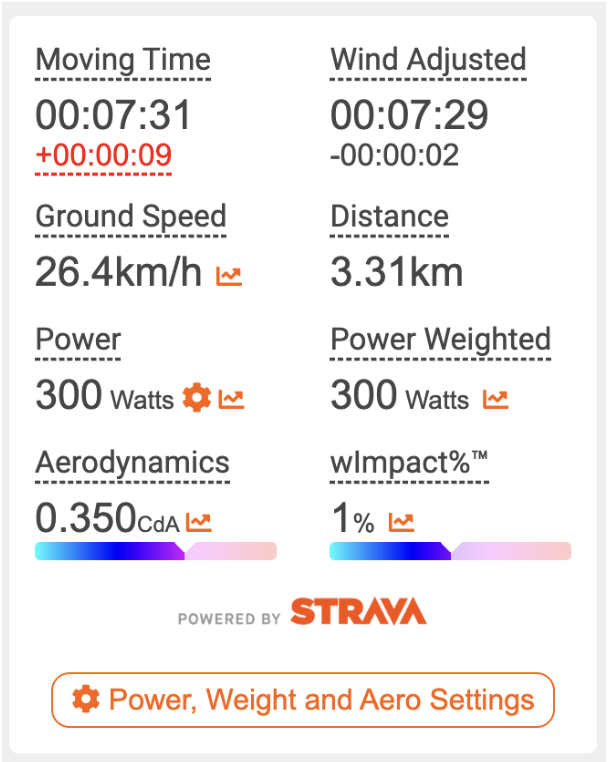
For this we’ll take the sort of segment you might find in a TT in the UK, a 3.3km drag of around 3%. For a 70kg rider on an 8kg bike with a typical “sat up” cda of 0.35 doing 300W this gives us a ground speed of 26.4km/h and time on the segment of 7:31.
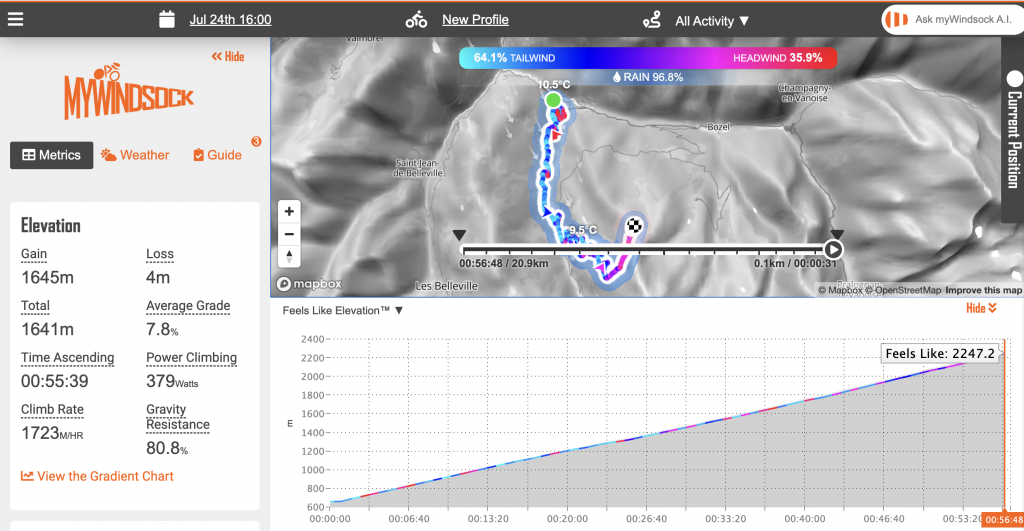
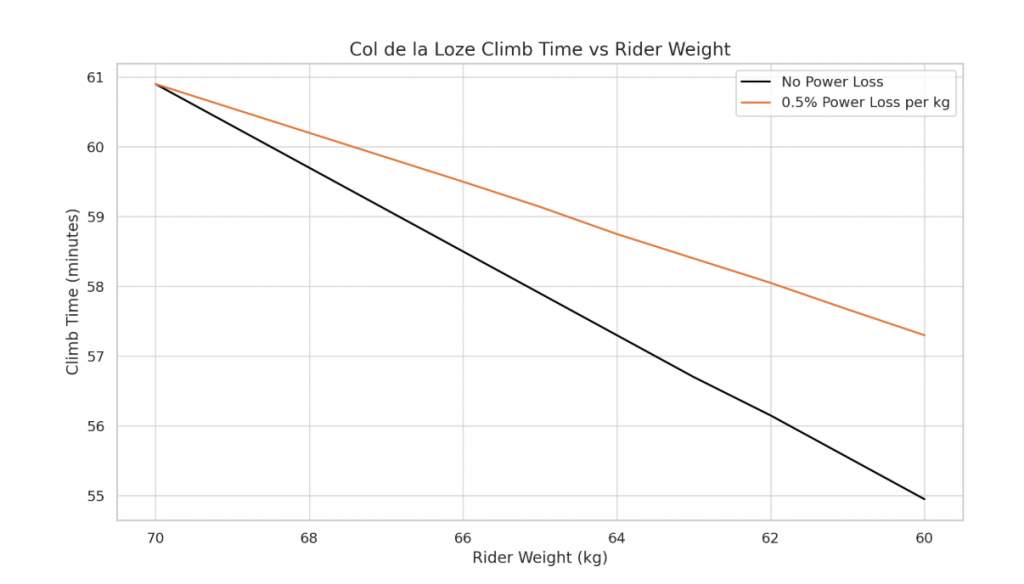
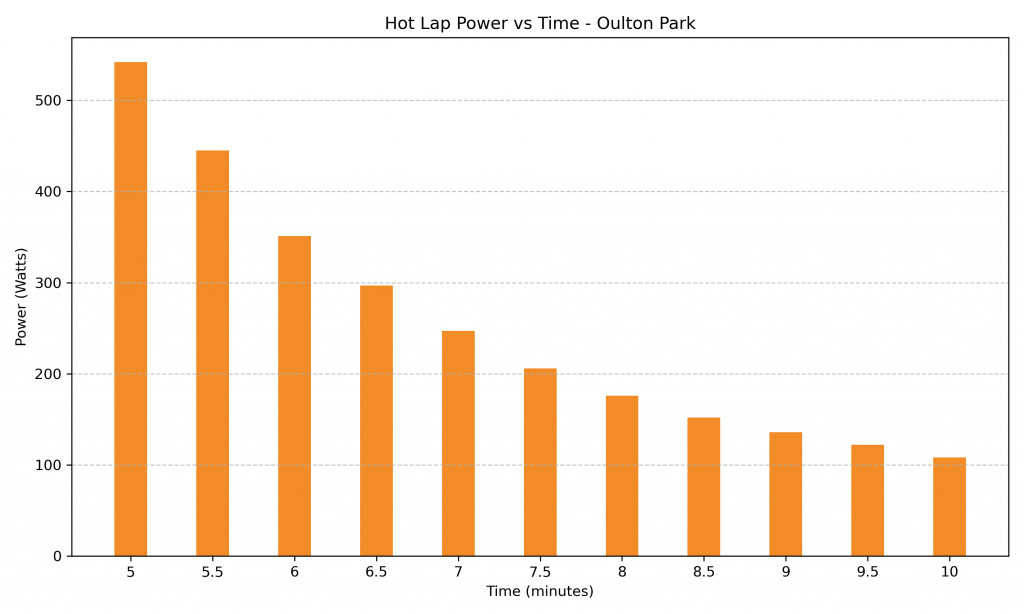
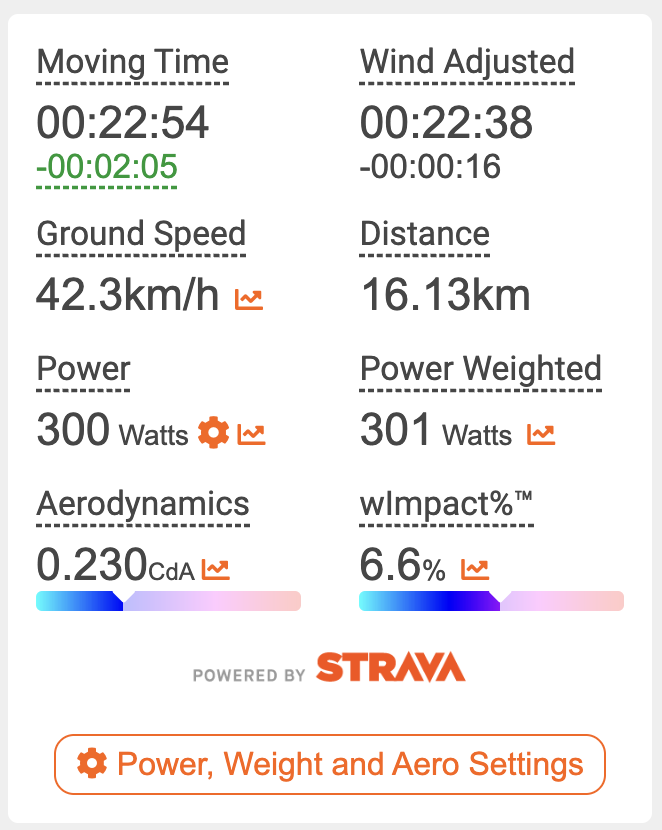
What happens if we put that same rider in the TT bars and drop their cda to 0.23? Good position discipline comes down to one thing, training. Ride your TT bike a lot, on hard days and easy days – if your time trialing is your primary goal then it shouldn’t even matter if you can do less power, as you’re training the muscles you’re going to use on race day. One of our favourite sessions is to go and ride up the longest climb you can find in the TT bars at a low cadence to really practice recruiting all of those TT muscles. Let’s take a look at what happens on that climb if the rider stayed in the bars…

Pacing
The old adage of riding fast is about minimising the amount of time you’re riding slowly for is as true now as it ever was. Efficient pacing is a game of energy investment – put more energy in when the resistive forces are lower and you’ll get more seconds back for your power investment.
How much difference does it make?
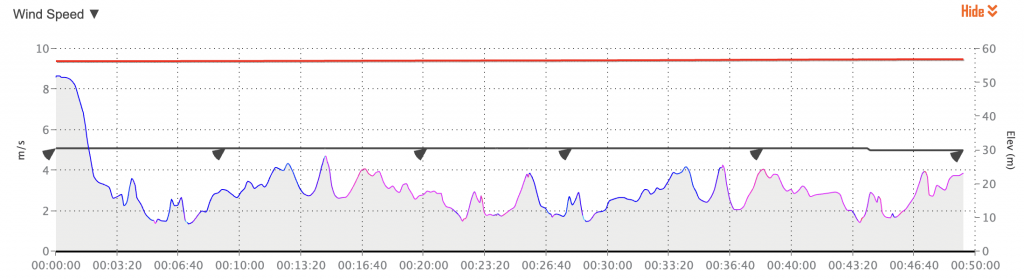
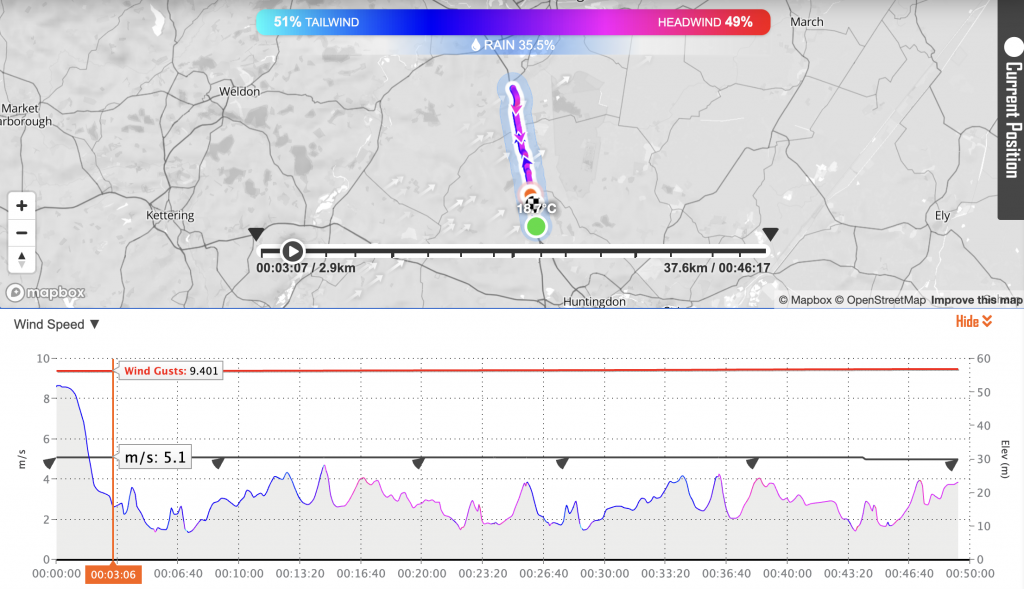
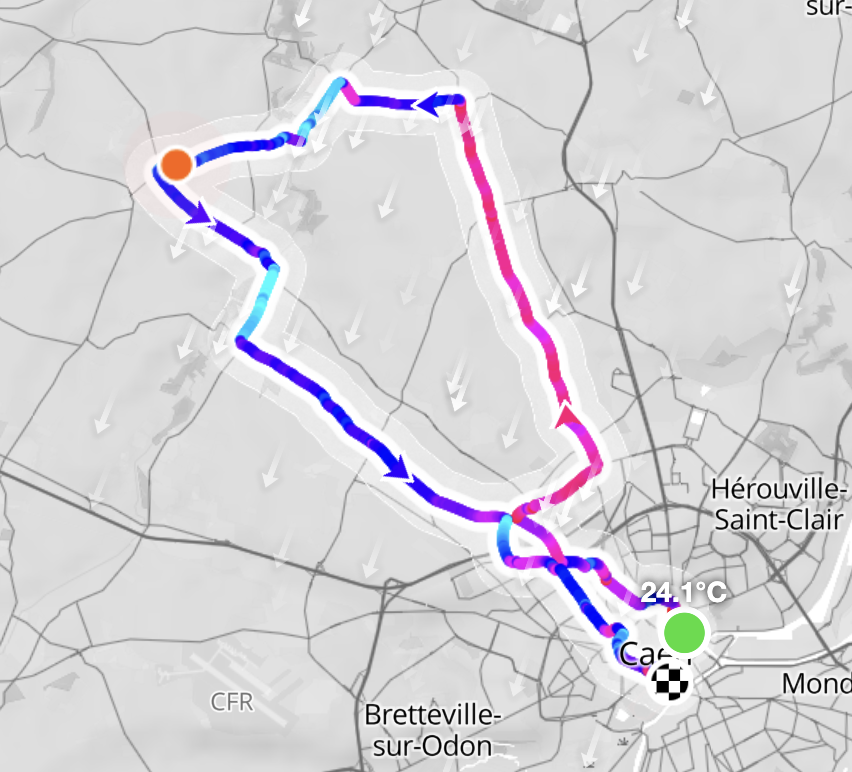
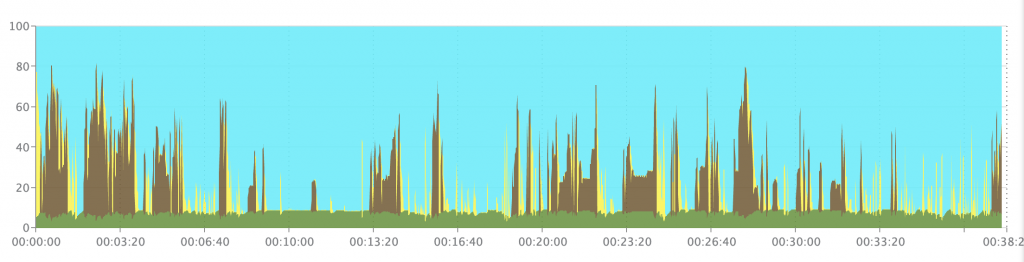
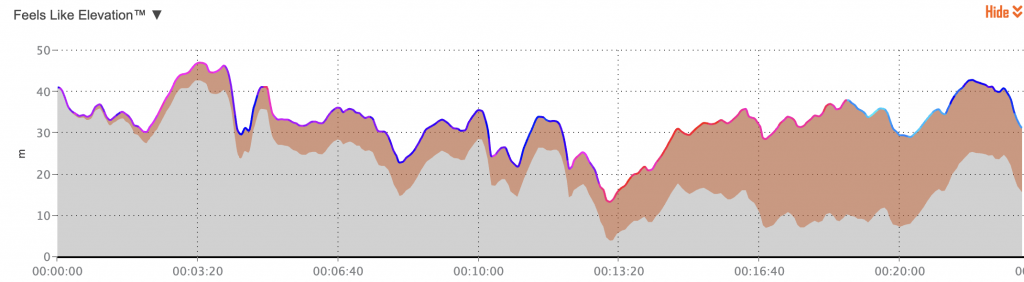
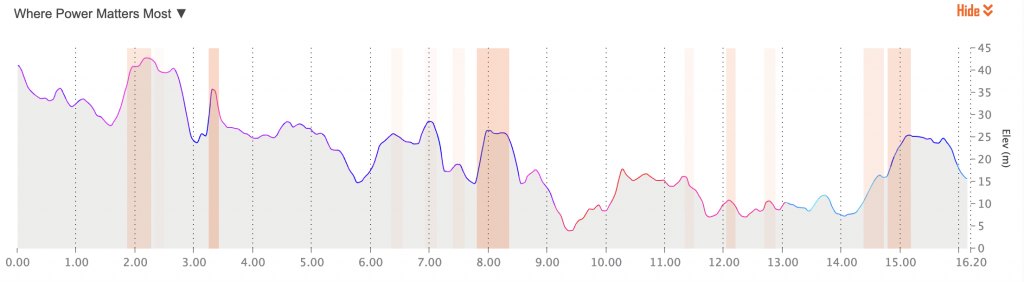
For this example we’ll use the world famous (well, moderately well known in Hampshire) P164 time trial course. It’s a rolling 10 in the New Forest with 130m of climbing over 16.1km.
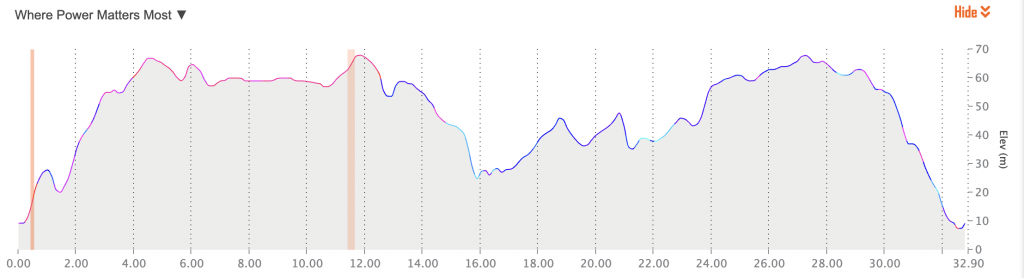
This course doesn’t suit a smooth power output as we used in the example above, as you can see by the elevation profile…
Let’s input a series of pacing rules, that yields the same normalised power but distributing our power slightly differently. myWindsock settings allow us to do this and we’ll impose a series of pacing rules (like “if speed > 60kph, power goes to 0W”).
How to do it?
Make use of the “Where Power Matters Most” graph on your event myWindsock forecast and avoid just doing a flat, smooth power.
Tyres, chains and gears
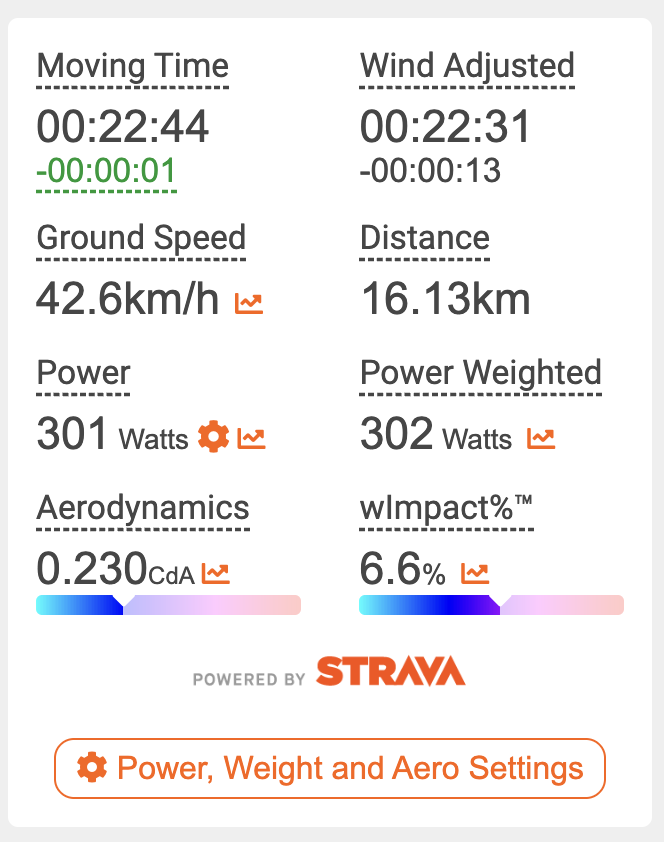
A clean bike is a fast bike, and a bike with a waxed chain and ceramic bearings is a slightly faster bike on top of that. This final tip is often marginal, but time trials often come down to small margins and that’s half the fun. Let’s delve into the myWindsock advanced settings and see how it impacts our TT on the P164 remembering our well paced effort yielded a time of 22:44, what happens if we fully optimise our tyres and chain?

That’s it then, riding a fast TT is simple – good pacing, good position discipline and spend money. The most efficient pound per second save expenditure you can make is a myWindsock subscription. With this, you can test your pacing and equipment strategy on a given course to help you plan race day down to the second.