Ben Norbury is four times Manchester & District Middle Distance and Best All Rounder Time Trial Champion from 2016-2019. During this time he developed software to eliminate uncertainty of the weather conditions out of his pre-race preparation.
Massive upgrades to report! The new Strava Segment Filter which help you locate key Strava Segments; customise Watts for Segment efforts on Routes; layout improvements for larger screens; and we now auto offset your Wind Lines for improved clarity. Here are the latest updates in more detail.
Segment Filter
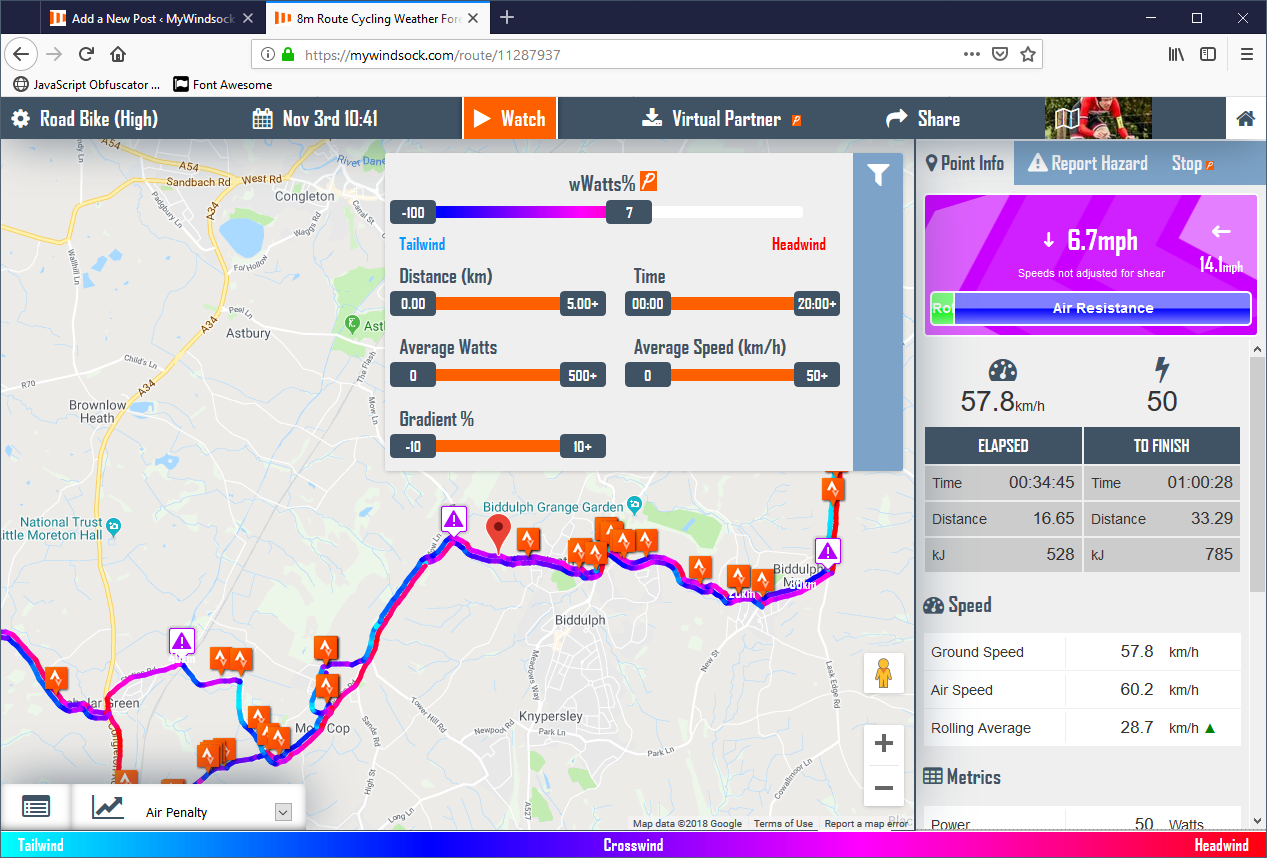
This is a huge upgrade that we are really excited about using. Find the Strava Segments you are most interested in with the new Segment Filter. Available on Routes and Activities, you can now filter Segments based on their calculated..
wWatts% – Premium members can find the most favourable or least favourable segments.
Distance
Time to Complete Segment
Average Watts
Average Speed
Gradient
myWindsock Segment Filter helps you find the most interesting Strava Segments.
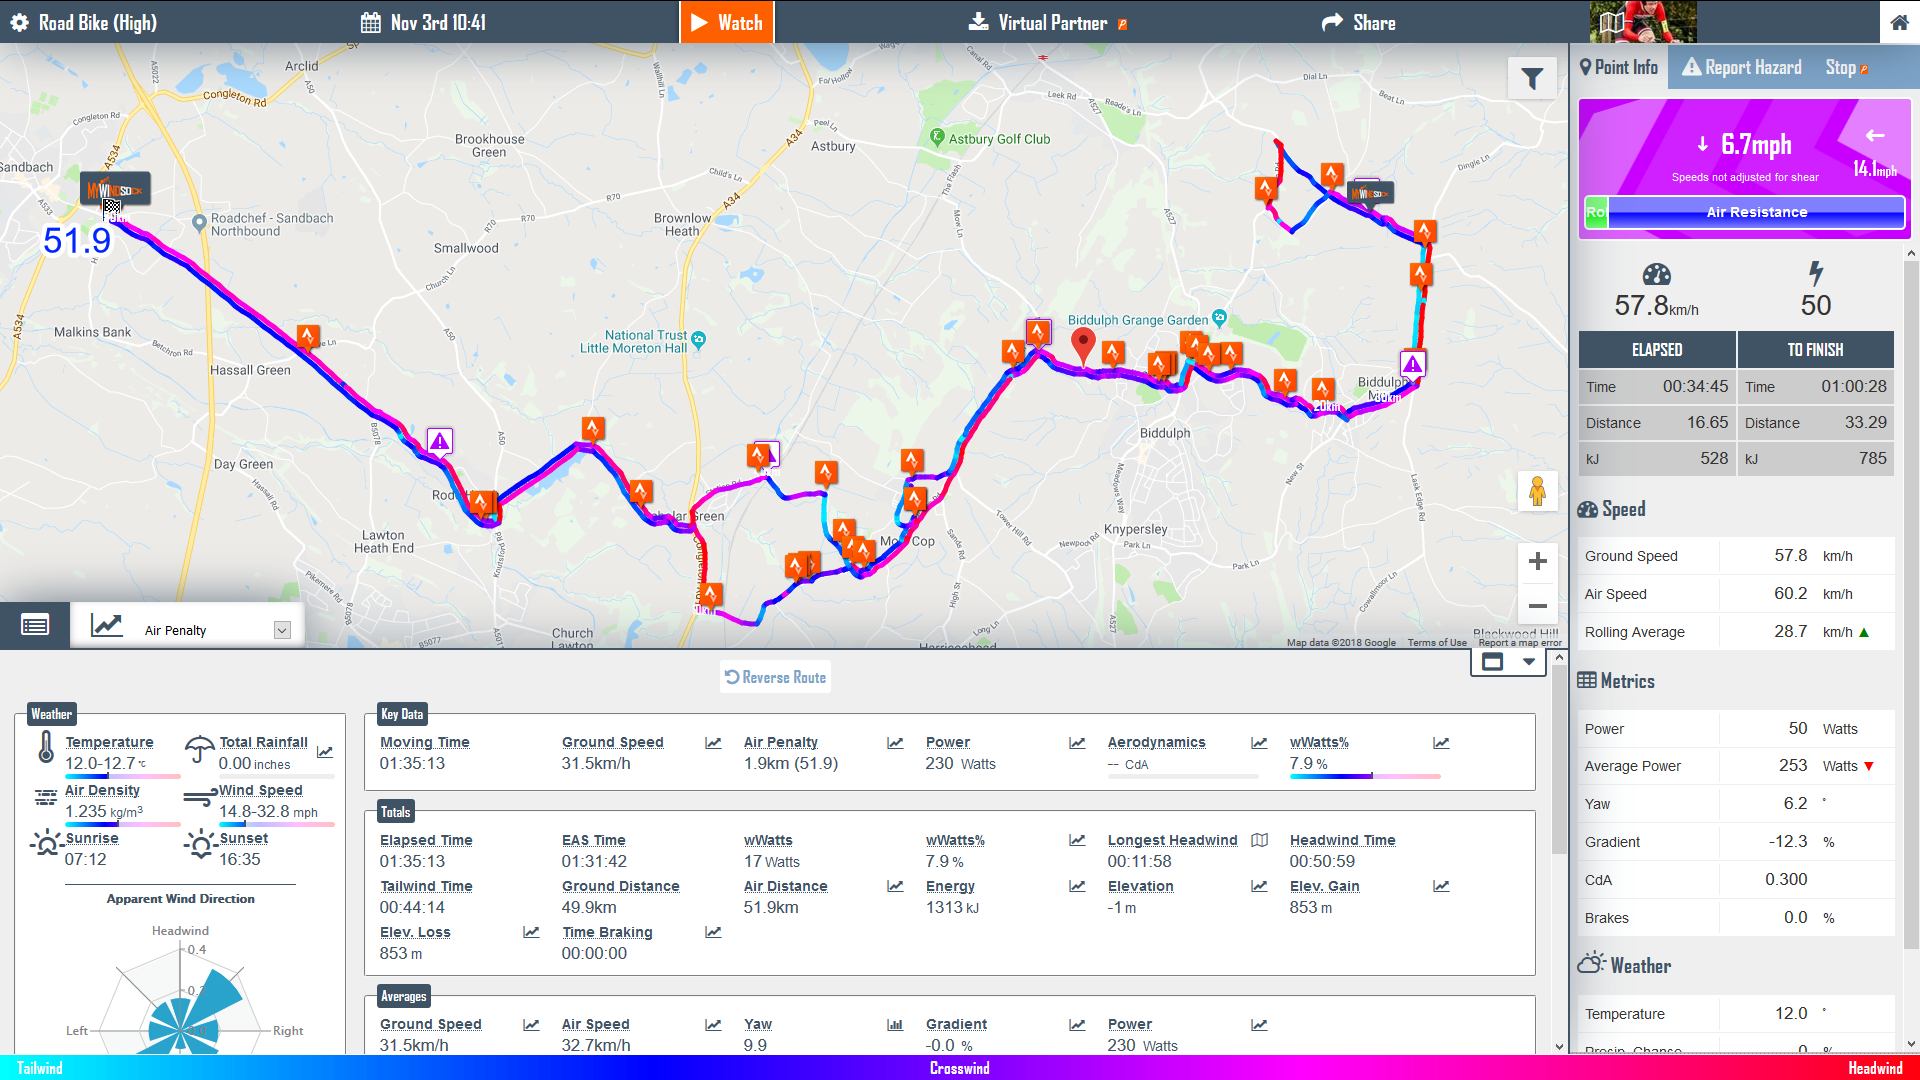
High resolution format
Things were getting a little over crowded with the Point Popup covering the charts, map and data. This isn’t necessary for larger screen sizes so for Tablets, Laptops and other devices with larger screen areas. So on these devices you will now notice that the Point Popup is a Point Sidebar and now lives next to the Map and Data areas.
Point Popup is now a Point Sidebar for larger screens.
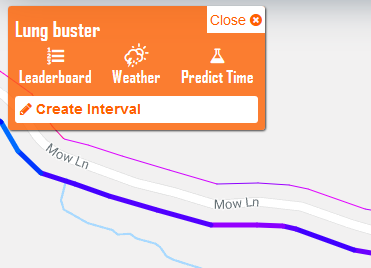
Customise Watts and CdA for Strava Segments Efforts
We’ve made it easier to create a custom power plan for your next Route. There is now a Create Interval button when you select a Strava Segment on your Route. Click ‘Create Interval’ to set the Watts and CdA for your Segment effort. Set your target power for your planned Segment efforts for improved pre ride reconnaissance.
Easily customise power by clicking Create Interval on any Strava Segment.
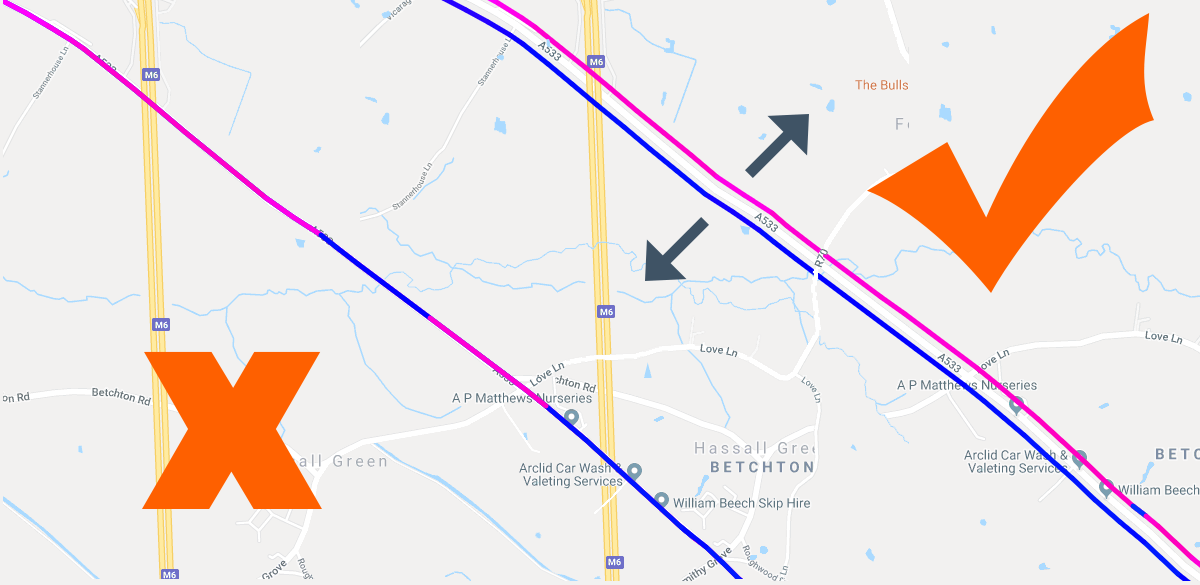
Auto offset of Wind Lines
Your Strava Routes and Activities now have a small offset applied to the Wind Lines. This is to help distinguish the Wind Line colours on roads that you ride in both directions.
Wind Lines are now automatically offset to improve visibility.
Bonus upgrade: Course settings are retained from session to session
We were getting frustrated at having to reset our course settings every time we viewed a course forecast. So they are now saved. If you set Offset, Wind Shear or any other course setting you do not have to set it again on your next visit.
We have been improving how we display Segment information to you on your Strava Activities and Routes. Now clicking on a Segment will reveal the segment myWindsock WindLine and summary information. Charts are also zoomed in to the selected Strava Segment.
View Segments directly on Activities and Routes.
Watch your segment effort
Clicking the Watch button will step you through your effort displaying the prevaillng wind, power, speed and lots more data.
We hope you like this upgrade. We have lots more coming soon!
More features this week. Sit back and relax while viewing the twists and turns of your forecast with Point Player; report and bewarned of hazards on your routes with the Community hazard system and more.
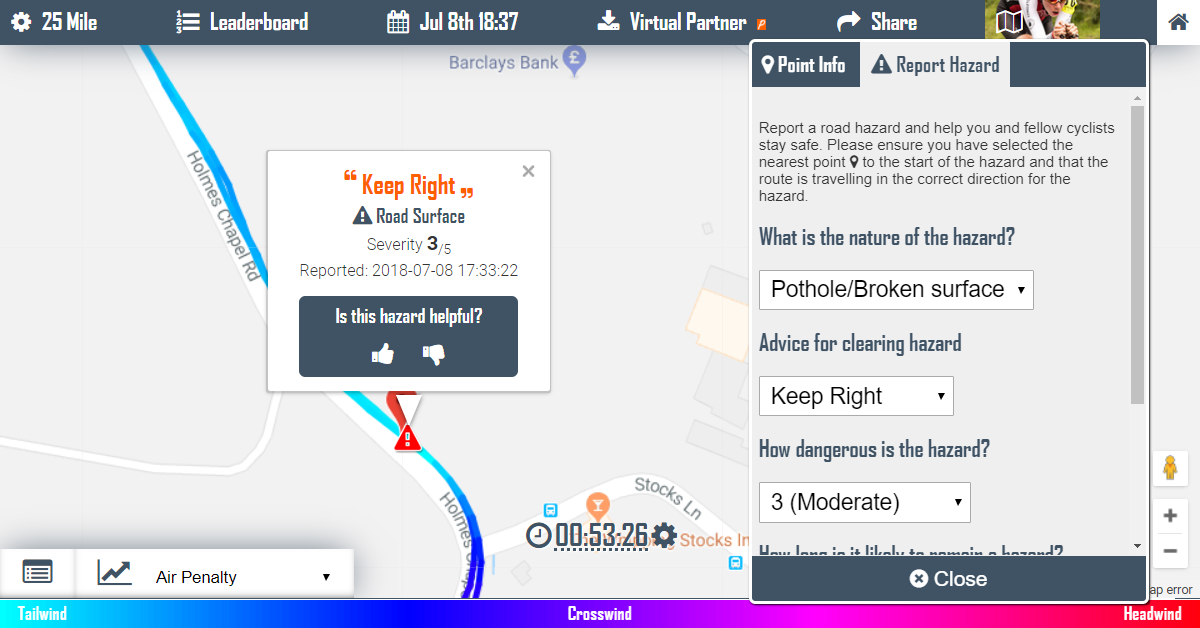
Community Hazard system – this is a big update that we hope you will find useful. It is still being refined so please let us know your thoughts about this new feature either on Facebook or contact us. The idea is that we can share hazards such as potholes on the roads that we ride. Click on any point on your course to reveal the Point Info popup and click the Point Hazard tab to make your Hazard report. You can up vote and down vote hazards by others which will help keep the relevance of hazards high.
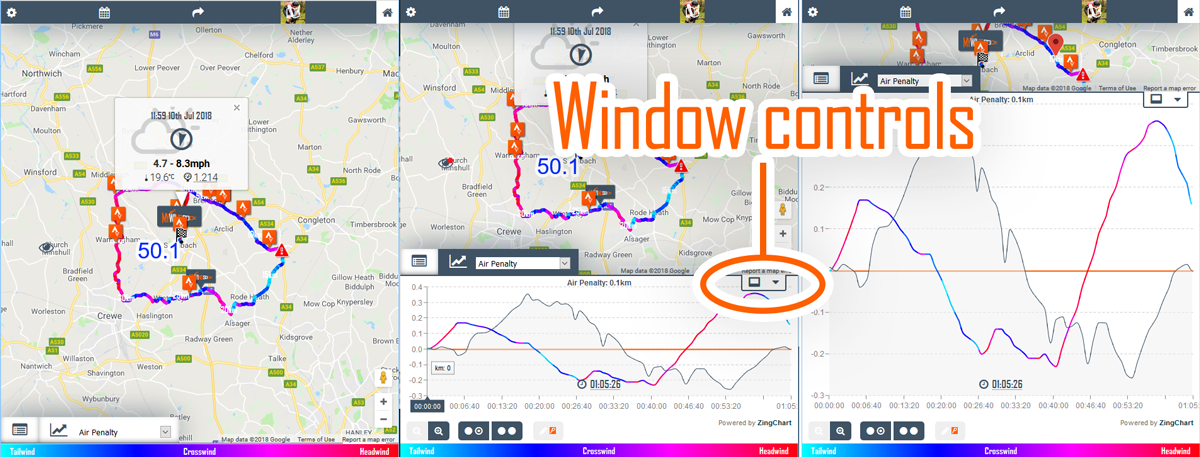
Charts and Data location – On all devices including mobile, desktop and tablet the lower panel which shows charts and overview data, has new options. It has always been possible on desktop to resize the panel however you now have the option on all devices to completely hide show at 1/3rd and 2/3rds height.
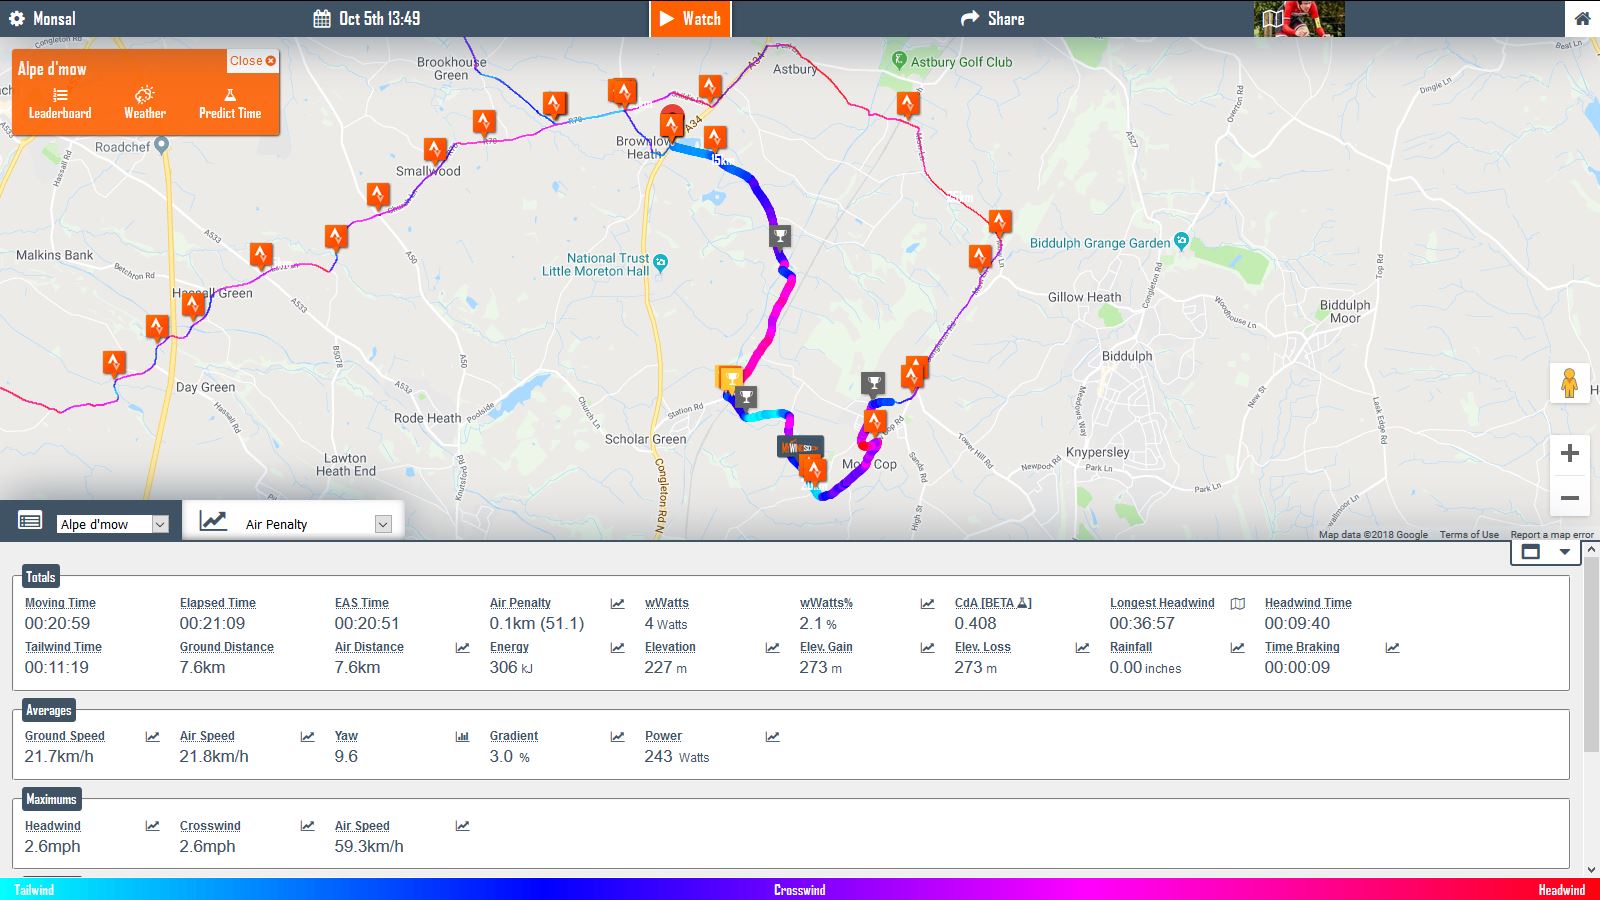
Point Player – It is now possible to sit back and view the twists and turns of your forecast, viewing how your ride develops point by point. This is a Premium feature.
I have some big leaps in functionality for you this week. Including the new Point Info popup that gives you a point by point view of the forecasted conditions and your past performances. Plus a new Chart showing when and how much you braked, plus the option to remove braking points from your CdA calculation.
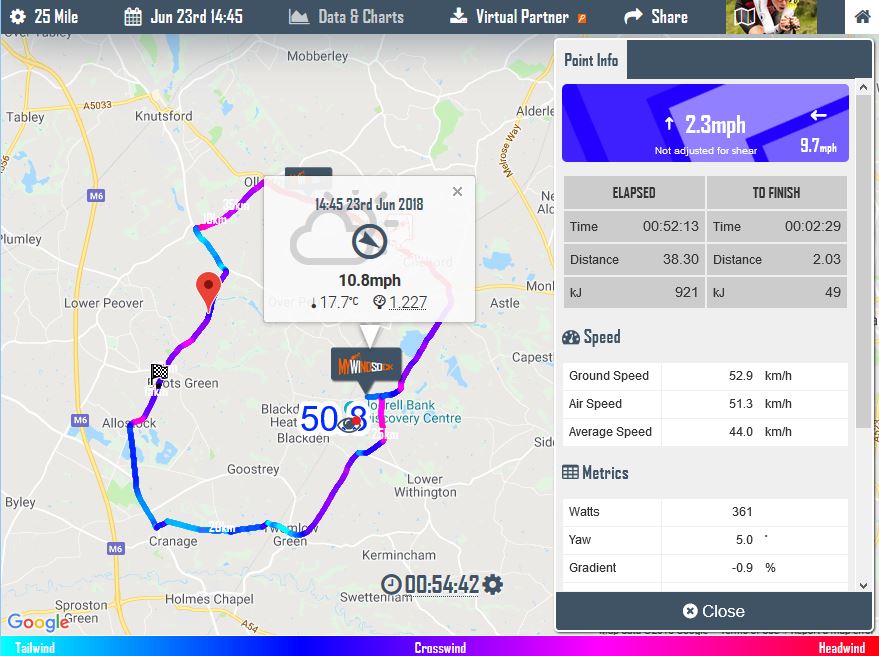
New Point Info Popup – Tapping/clicking any part of your course will activate the Point Info popup. This gives you lots of information for the specific point on the course that you have clicked. Once activate you can move your cursor around the course and view how the conditions and metrics change. The ‘Wind Window’ demonstrates the prevailing wind direction.
Remove Braking from Loops Mode CdA Calculation. I have enabled this option as default as I believe in most cases it will give the closest approximation of CdA for general riding including time trialing and other forms of racing. I also believe this will actually lead to the retirement of Dirty Mode as an option. I recommend for field testing that the option is deselected as it is useful to isolate your loops that have braking within them so as to provide a clear picture of good loops vs bad loops.
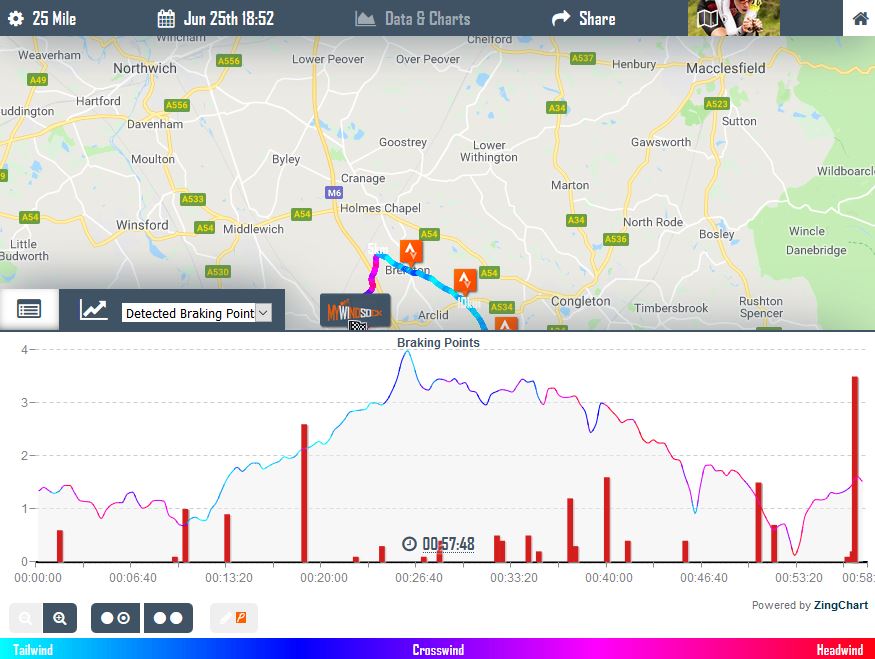
New ‘Detected Braking Points’ Chart. The process of identifying and removing braking from CdA testing has revealed new data that could be useful. Useful if not only to view the success of the Loop mode identifying your known braking points.
Braking Points added to CdA Profile chart. This will help you view which of your loops are possibly affected by braking.
Map Marker Linked with Charts. Moving your cursor around the chart will also show a marker on the map and update the Point Info popup if activated.
Crosshairs on Charts. Charts have greater visual precision with crosshairs coupling time and data.
New ‘Rolling Average Power’ chart. Shows how your average power is progressing during your ride. Usage is similar to that of the Rolling Average Speed.
Leaderboard Bug Fix. Fixed a bug with the Leaderboard Wind Rose where an error would be triggered if Wind Rose hadn’t completed loading when Leaderboard Tabs clicked.
When you return from your aero field test it is important that you can have confidence in your results. Not all field tests will go well, it’s disappointing, but better to acknowledge a bad test than make poor choices.
Aero field testing is available to all Premium members with power meter data by simply viewing their Strava Activity Weather or uploading a TCX file. Learn more about Premium.
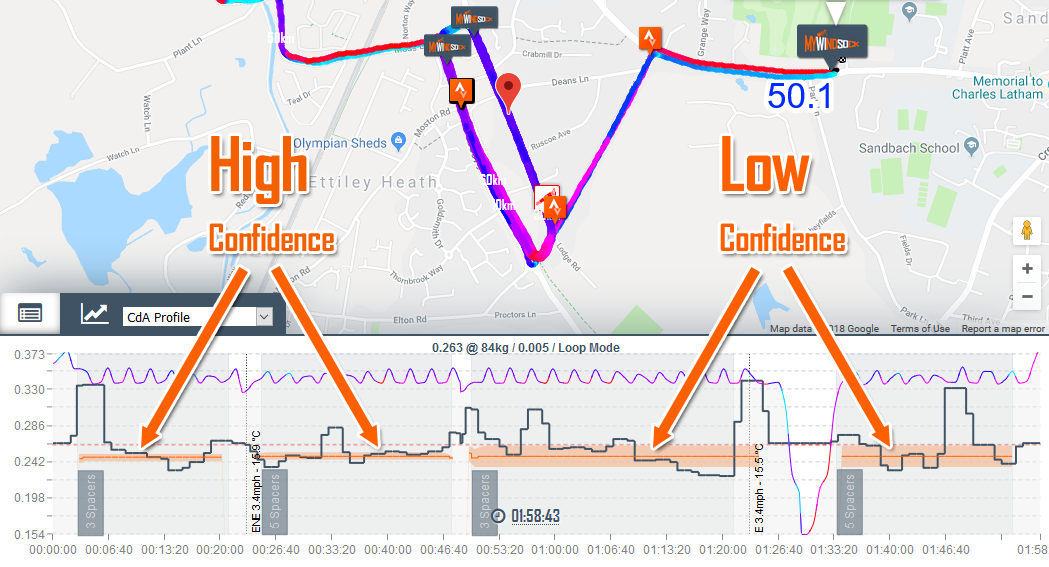
A new feature of the CdA Profile chart helps you to ascertain how confident you should be in your test result. This is a ‘Test Range’ and is best understood by the following example that happened in my most recent test.
First two test have a low range and therefore higher confidence.
In the above image you can see that I alternated between two positions. The first two runs went reasonably well and the Orange Test Range around the Test Average is very narrow. I had enough good consistent loops and the bad loops were detected well by the filter. This is a test with ‘High Confidence’.
Then the aero field test falls apart. I hit rush hour traffic. The further two test runs have a much higher range. The variability between runs is so large that the actual test CdA is very difficult to determine. Basically the CdA of these runs could fall anywhere inbetween the orange range. It wouldn’t be wise to base a decision on these last two runs.
Top 5 reasons you have a high test range
So why did it go wrong? These are common reasons for a poor test due to a high Test Range.
Traffic at turns – Leaving your position or using the brakes on a large number of your loops will cause a high Test Range. Choose quieter times of day or ensure a greater quantity of good loops vs bad. Ensure when you do use your brakes you use them sufficiently enough to greatly impact the loop CdA otherwise it may not be filtered and make it’s way into the test range, take the opportunity to sit up and relax before the next loop.
Traffic passing – Your CdA is affected by traffic in both directions. On coming traffic will increase your CdA whilst traffic passing you in the same direction will decrease your CdA. Choose times of day that have the lowest or most consistent level of traffic. If you suspect a bad loop due to traffic brake to a stop to demonstrate to the loop filter that it is a bad loop.
Gear changes – Changing gear will change your drive train efficiency. If you do have to change gear (find another loop) make sure you always change at the same location. Do not change loop to loop and test to test. Pick a gear, make a note of it, check that you’re in it and leave it.
Insufficient test loops – If you have a really good test loop, a velodrome for example, you can get away with a hand full of loops per test. If however you aren’t that lucky more loops are required. Remember using a short loop will isolate problems and speed up your test. If you are getting lots of scrappy loops do more loops or admit defeat and abandon for another time.
Position discipline – Make sure you are paying attention to your position. Doing some loops relaxed and some loops focused will lead to a wide range. Small changes to position are too subtle to be weeded out by the loop filtering process and will therefore produce a large Test Range.
A follow up to point 5 above. If you suspect position discipline is the reason for your high Test Range, is it a workable position for a time trial? Of course if the range is still below that of your alternative test position then yes. However it could be an indication that additional training and conditioning would be required to achieve the position.
Aero field testing is available to all Premium members with power meter data by simply viewing their Strava Activity Weather or uploading a TCX file. Learn more about Premium.
This is a common one and usually simply resolved or explained. These are the possibilities
You are using ‘Loop’ mode.
‘Loop’ mode requires minimal braking to be a true calculation of your CdA. For general riding ‘Dirty’ mode is more suitable as this attempts to filter out braking and anomalies.
Your Performance Profile has errors in it. As part of the CdA calculation weight and rolling resistance are important. If these parameters are far from their true values your CdA will be incorrection. Check that you have entered in your combined weight with bike, clothing etc. CdA calculations are especially sensitivie to incorrect weight inputs for hilly rides.
You dragged your brakes down hills. This is very difficult to separate from non braking data as there isn’t a large enough difference to create outliers to filter. Especially when there are long descents.
Your brakes were dragging on the rim.
You didn’t calibrate your power meter or it received a bad auto calibration during your ride.
You were wearing unusually baggy clothing such as a rain coat.
No CdA displayed for my ride
If you don’t upload power data to Strava we can not calculate your CdA. If you want to protect your power data. Try uploading the TCX file directly to myWindsock.
Ensure your are still in Analytics mode. Go to > Mode
Some of my test Loops are missing
When doing field testing ensure you have the highest position recording setting on your bike computer. For Garmin devices this is ‘GPS + GLONASS’.
Experiment with the detection sensitivity. Lowering the Loop Tolerance will detect more loops but be increasingly less accurate.
> Aero > Loop Tolerance
My CdA is very different from my previous rides
If weight, rolling resistance or drive train loss parameters are changed your CdA will also be different. Keep an Aero test profile that keeps this values the same to help compare CdA from ride to ride.
Incorrectly calibrated power meter.
Only a small section of my out and back Time Trial has been measured.
Expand the minimum loop distance to capture a greater proportion of your time trial. > Aero > Minimum Loop Distance
Discover your CdA, how aerodynamic you are, from past races. myWindsock can analyse all of your Strava Activities, Segment Efforts or uploaded TCX file from your power meter data. To use the features described you will require Premium membership and power meter, learn more about Premium.
IMPORTANT: Please ensure you disable Auto Pause on your GPS device when field testing.
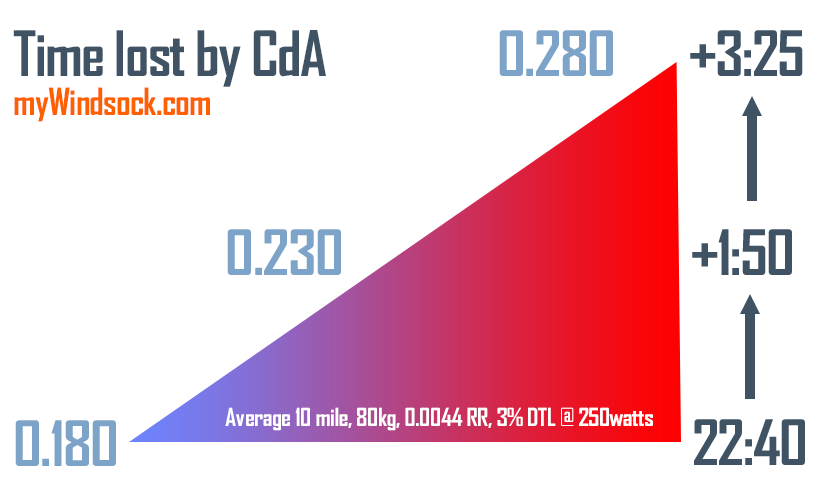
What your CdA is and why it’s important
Knowing your CdA is useful to help you improve and squeeze out as much speed from your power. In most cases the most important determinant of performance in time trials is not Watts/Kg it is Watts/CdA. Here are a few ways you can use this number to improve your future time trial performances.
Improve your position – small changes to your position can make large changes to your CdA. Make purposeful changes and record how your CdA changes for better or worse.
A measurement of position discipline – when the adrenaline is pumping and you’re cranking the pedals as hard as possible it is easy to loose focus on position. Post race you can discover how disciplined you were at maintaining your position during the race. It is another performance measurement very much like your wattage.
A more accurate time prediction – Entering a measured CdA into the Performance profile for your next race will dramatically improve the time prediction myWindsock generates. This means charts such as Rolling Average Speed will be of greater accuracy for your next race.
Short video tutorial
This video shows how to extract the CdA of a the time trial from the ride file or Strava Activity and how to ensure your CdA is comparable to other time trial CdA measurements. Most of this is covered in the video however below the video I have included some further explanation and tips.
Loading up your time trial
To analyse your time trial there are two methods of upload to myWindsock.
Through your connected Strava account, simply click on the Activity from the Strava Connect menu.
Or from the course Strava Segment myWindsock forecast go to > Leaderboard Weather > My Efforts and select the effort. This requires power data to be included in your Strava upload.
If you prefer to keep your ride data private you can upload directly to myWindsock from the homepage using the ‘ GPX/TCX’ button.
Creating an Aero Test profile [Optional]
This is a recommendation and not required, but will ensure your CdA is not affected by changes to your Profile settings. It is easy to forget the settings previously used for Weight, Rolling Resistance and Drivetrain Loss when calculating previous race CdAs. To keep it simple it is recommended to keep a profile for just CdA calculations.
This assumes that race to race you haven’t changed these actual values and they remain static in the real world. If you have altered tyres, gained/lost weight, changed the location of your power meter or the course has a significantly different road surfice, you may need to factor these changes in the CdA calculation.
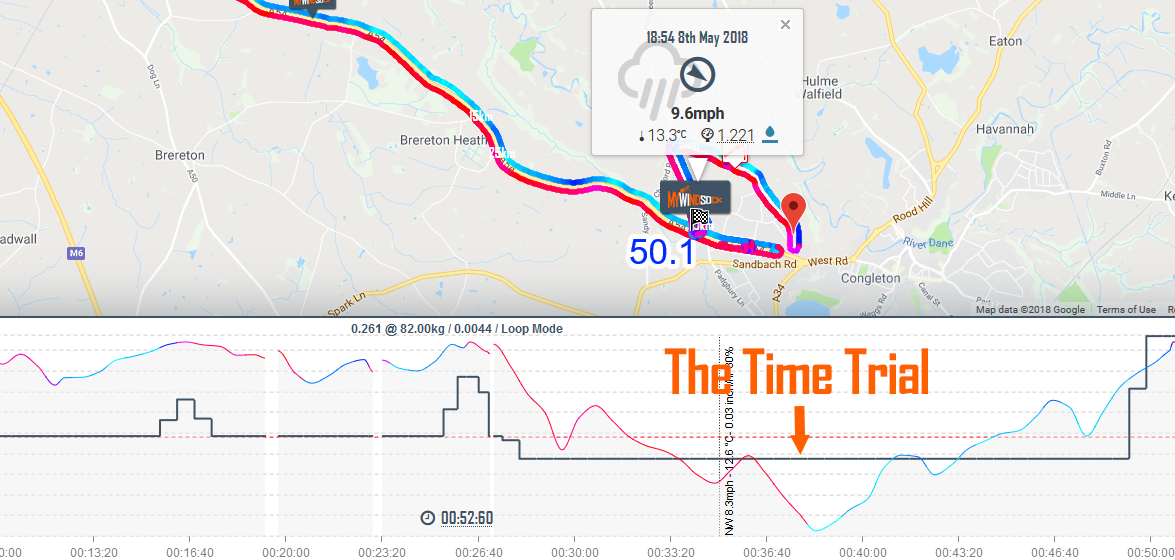
Viewing the CdA of the Time Trial
The average CdA for your ride may include your warm up and cool down CdA. To extract the the time trial CdA you will need to access the ‘CdA Profile’ chart. Locate the line in the chart that represents your time trial. If your activity includes wam up and cool down your time trial is likely to look like the below. The point to point CdA of an out and back course is usually easy to spot.
The CdA for your time trial
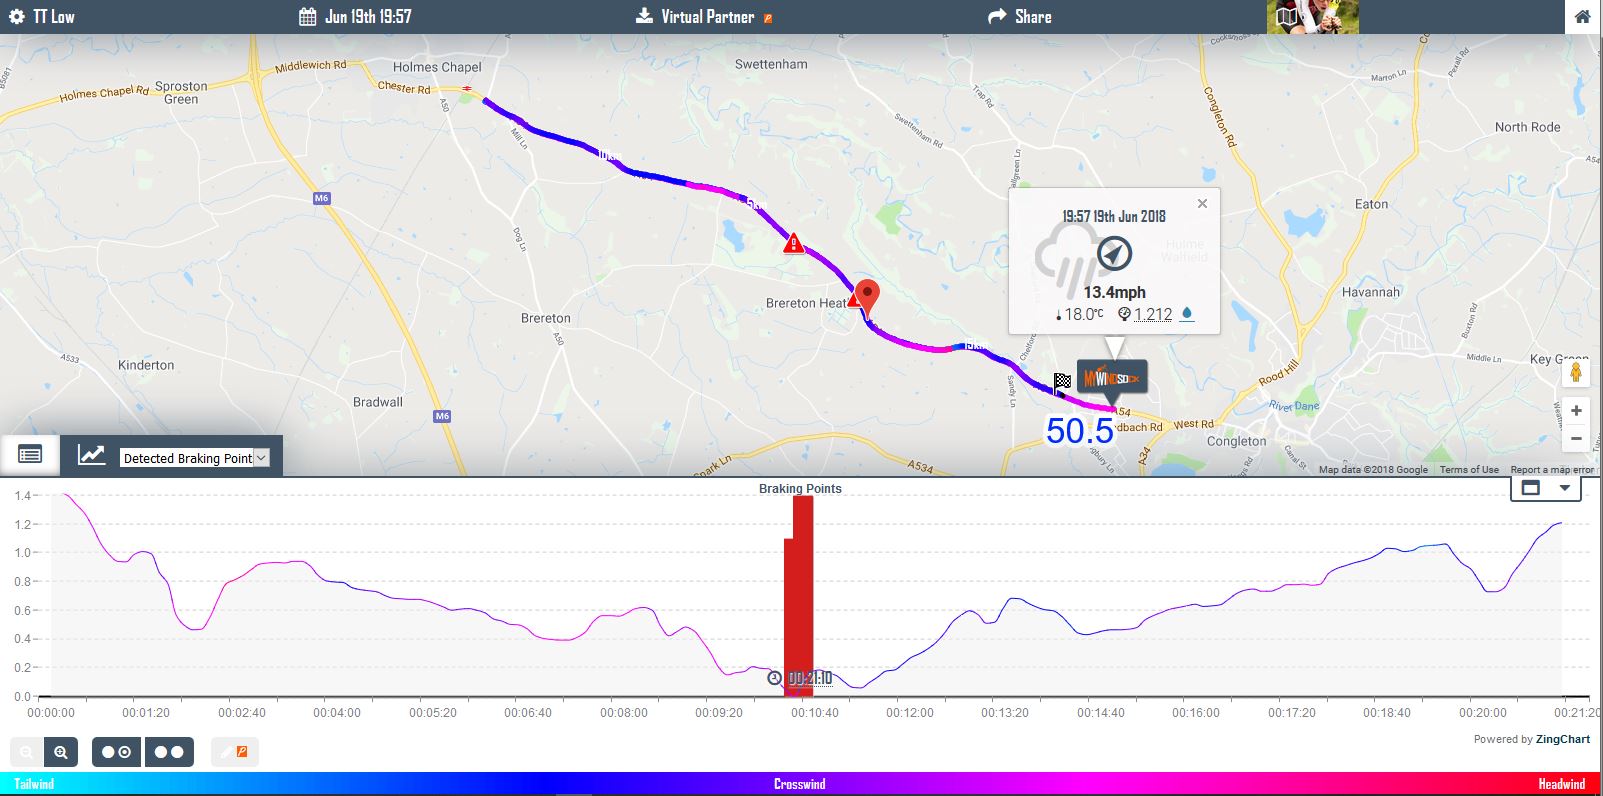
“I used my brakes, is that a problem?”
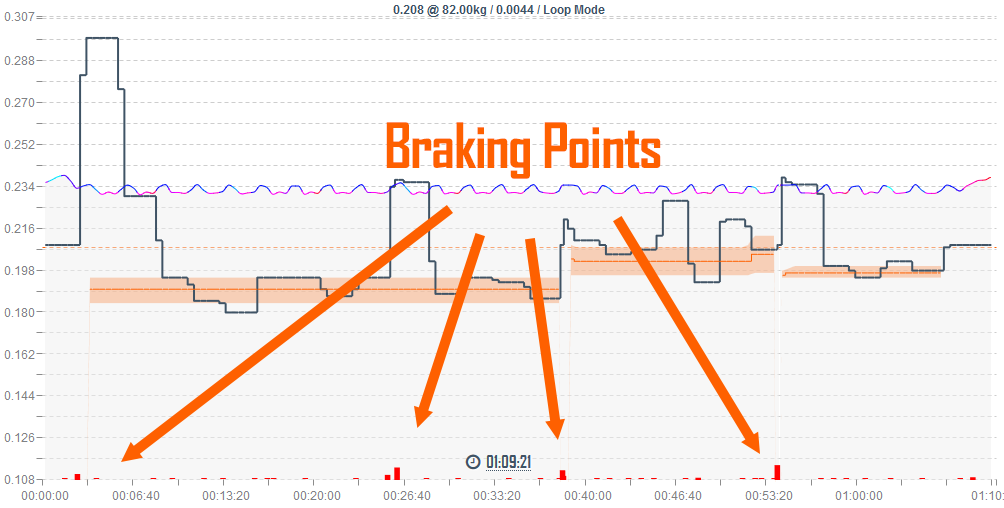
Braking will affect CdA calculations, however myWindsock can detect when you brake and remove these moments of braking from your CdA calculation. View the chart ‘Detected Braking Points’, this chart shows where on you ride you braked. Using this information we can remove the brake elements from your CdA calculation. This dramatically improves the accuracy of your CdA calculation.
Detected Braking Points in an Out and Back time trial.
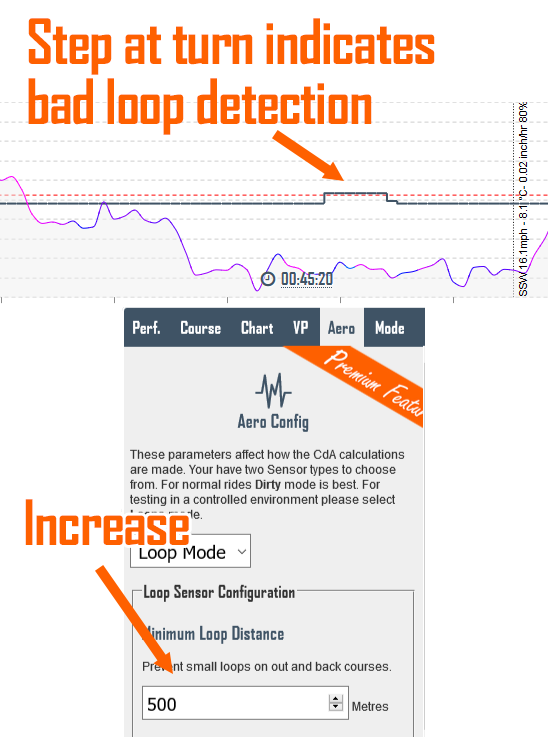
My CdA line has a step at the turn
The best CdA is calculated from a route in which you pass the same point of road twice. This can either be in the same direction ‘A loop’ or in opposite direction ‘out and back’. If your time trial course is slightly longer in one direction, so the start is up the road from the finish, this bit will not be as accurate and is probably shown on a different line. This uses elevation information rather than the more accurate loop. Look to the line that covers most of the time trial from two identical points on the course.
If at ‘the turn’ you have a different CdA experiment with increasing the Minimum Loop Distance. This will ensure a loop detection for more of your time trial.
Increasing minimum detectable loop will remove step for better CdA calculation
Go to > Settings > Aero Firstly increase the Minimum Loop Distance to a bigger distance but less than the distance of the two points on the course that you cover twice in the time trial. If this doesn’t resolve a better CdA line reduce the Loop Tolerance by a point.
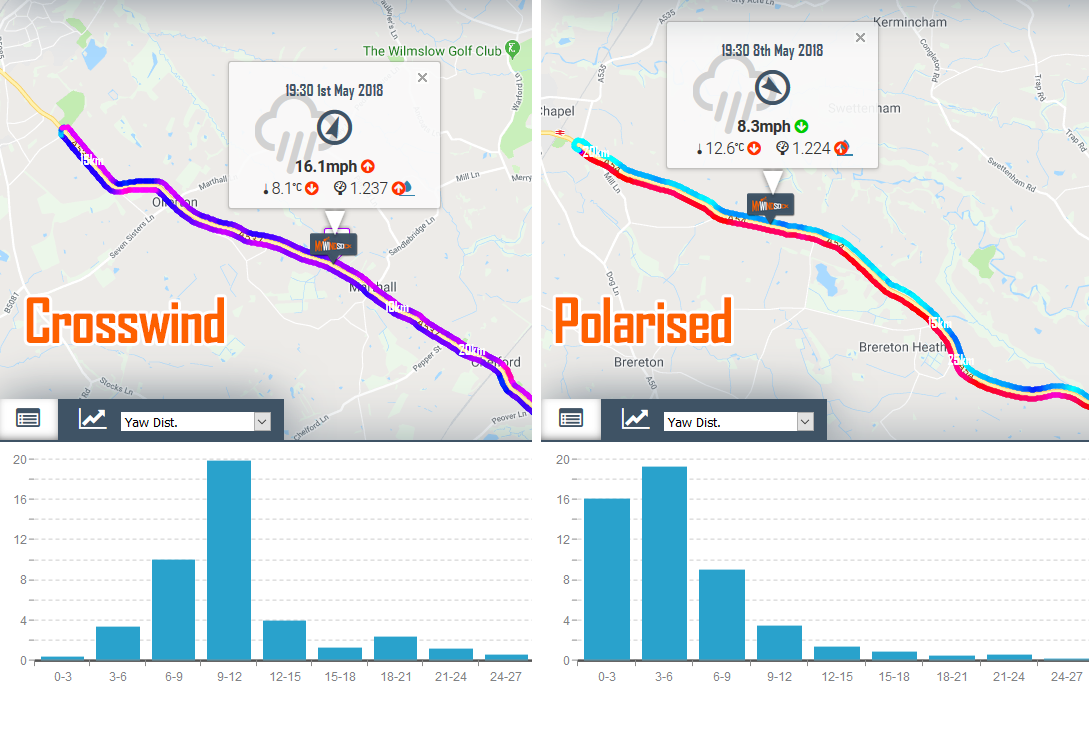
A quick note on Yaw angles
A difference in wind direction and wind speed can produce a different CdA calculation. The greater the wind speed difference the larger the difference of CdA will be for the same position. Your position’s CdA will be better or worse for various Yaw ranges.
Bike speed, wind speed and it’s direction relative to the bike alters the yaw angles and effectiveness of your aerodynamics.
Yaw is determined by your speed and the wind speed and direction. The best description I’ve heard for explaining yaw is to think of the angle that a balloon held on a string would make to the bike if you were to hold it whilst moving. In a crosswind as you increase your speed the angle of the string to the bike reduces.
So in extraordinary weather you may expect to see a very different calculation of CdA. It is therefore best to discount these days.
To use the features described you will require Premium membership and a power meter, learn more about Premium.
A very quick overview of aero testing with your Premium account. To use Loops Mode for field testing from your activity go to > Aero and then change the mode to ‘Loops’.
Find each stage of the Santos Tour Down Under preloaded for easy access. Each stage has a full forecast giving you a powerful insight into the action.
What to look for
Echelons. Purple wind lines when the winds are strong offer the potential for echelons to be formed.
The heat. 30 plus degrees centigrade temperatures will affect some riders more than others.
Headwinds. Headwinds will always favour the Peloton. The aerodynamic advantage is too great when the winds are strong for breaks to succeed. Smaller riders are more likely to suffer greater during headwind sections than the larger riders.
Tailwinds. A tailwind may provide the launch platform for a winning break. The reduced wind speed reduces the aerodynamic advantage that the peloton has.
View the weather for each Santos Tour Down Under stage here.