Now that we have the basics set up for an accurate time trial forecast, we covered this in part 1, we are now ready to assess the forecast.
Key weather map features for Cycling Time Trials
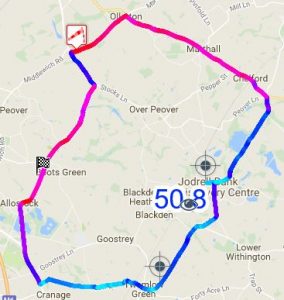
- Weather overview: Every forecast has a weather overview at the start and along the route where changes to the weather are detected. Within the overview box the following details are displayed: Wind Direction, Wind Speed, Temperature and Air Density.

Weather Overviews are displayed along the course where weather changes are detected. - Wind Lines: The colourful Wind Lines illuminate the apparent wind direction along the course. Light blue indicates a tailwind, dark blue and purple crosswind and deep red a headwind. Use the colours to instantly see where the wind will assist or hamper your progress. Tip: You may consider increasing your effort into the red sections to limit your time exposed to the slower conditions.
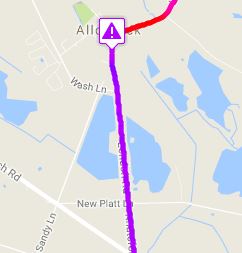
- Crosswind Warnings: When running deep section front wheels knowing where the crosswinds are and how severe the wind speed will be is useful. When warnings are displayed a shallower rim width may be preferable.

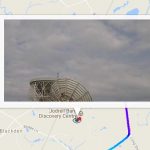
Crosswind warning markers show where the crosswinds are at there strongest. - Eye on the Ground: On the day of your time trial the Eye on the Ground shows a recent image from locations near the course.

Eye on the Ground In our next post we find out how to use key charts to get the best time possible in the conditions.

 UK Time Trial Events


