‘Feels like’ Elevation allows you to mentally prepare for the event you have coming up. A huge part of racing is being prepared and knowing the course you are going to be riding.
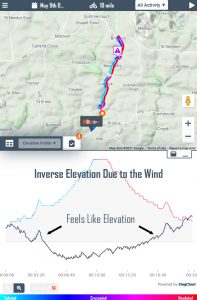
With this graph and metric you will get a perspective on the effect the wind will have. This will give you a better and clearer image on how to pace yourself during a race so you don’t burn yourself out. Our graph allows you to visualise the wind, like you would the summit of a hill. Have a look at this event The S6/10 Tri-Logic Event time trial.
This course is up hill on the way out to the turn and downhill on the return. However with the added tailwind on the up hill and headwind on the downhill, on this particular day, the course would feel flipped. The uphill with the assisted tailwind would require less effort and power and would actually feel like you were going downhill.
The headwind is very harsh and strong on this particular day and would make the downhill would ‘Feel Like’ an uphill effort. Find out more about ‘Feels Like’ Elevation graph and metrics.
We have all the UK Time Trials ready for forecasting each week. Discover the ‘Feels Like’ elevation for your next race in our Time Trial Events section.

 UK Time Trial Events


