Discovering how your weather compared to others in the top 10 of a Segment, reveals the truth about your effort.
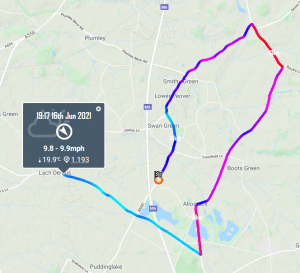
It was my first time out on the JC19 course held by Weaver Valley. It’s a challenging course, mostly due to the Cheshire pot holes putting the word ‘trial’ in ‘time trial’. The result landed me a top 5 on the course’s Strava Segment. That was a suprise! I didn’t feel it had gone paticularly well. So my question this evening is, were my conditions this evening better than the rest of the top 10? Were my efforts flattered by the time trial course’s weather conditions?

One of the first features of myWindsock was to compare segment weather. The technology has come along way from simply stating wind speed and direction. wImpact% now shows the percentage of energy required to match the conditions of a windless day. So a wImpact% of 5% simply states that you would require an additional 5% more power to achieve the same time on a weather neutral day. [Learn more about Weather Impact]
So how about tonight’s effort that landed me a top 5 on the Leaderboard. Did I have a lower wImpact% than the rest? meaning my conditions were better. Time to checkout the Leaderboard Weather [Find out here how to do this Leaderboard Weather].

Well a weather impact of wImpact% of 0.8% is very good and as we can see it’s the best conditons of any in the top 5. So I think I can say I chose a pretty good day to go along to Weaver Valley Club 10 to try out the course. Next time out I think I’ll be a little more settled on the bike. My CdA measured 0.010 greater than my most recent events [Find your Ride’s CdA] and my power was a bit low. So it’ll be good to go back and have another trip around the Weaver Valley 10 mile.

 UK Time Trial Events


