


There are lots of options to configure your forecasts. Here are the Chart options you can set.
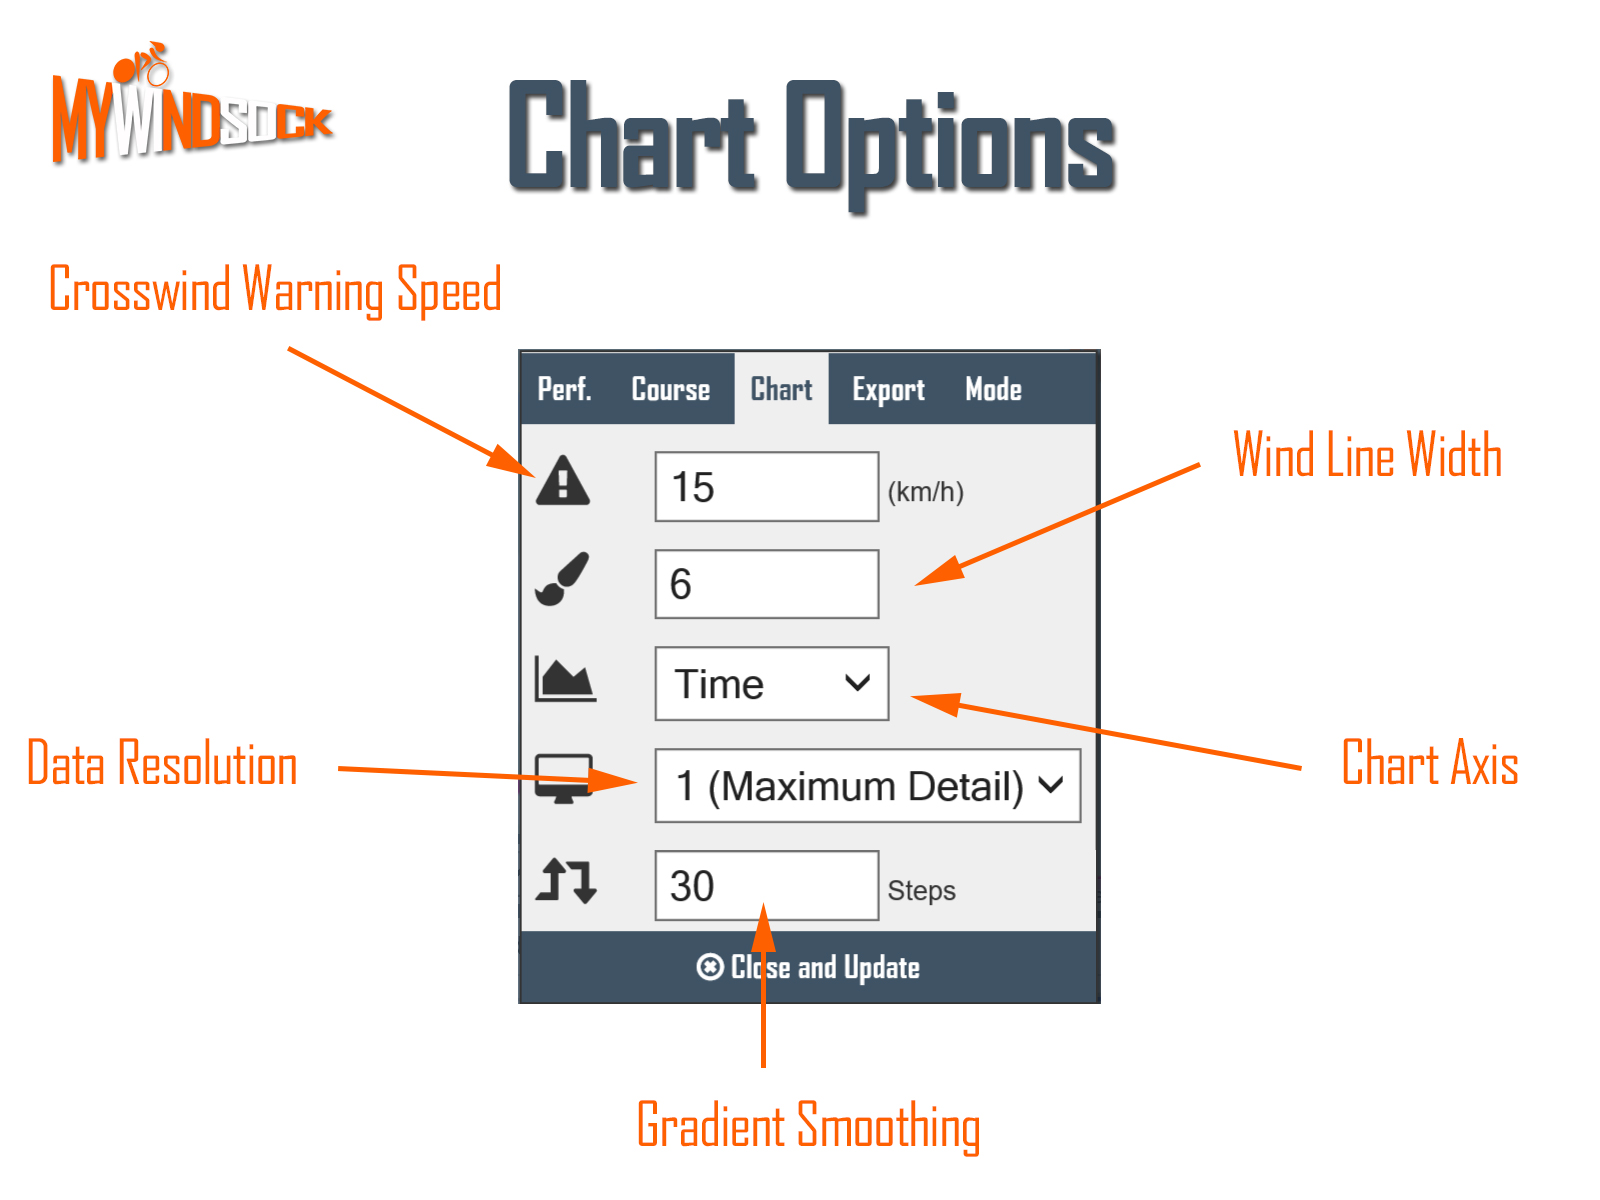
Crosswind Warning Speed
When we detect a crosswind that exceeds the speed set here the map will display a warning triangle. Alter the speed to change at what speed your map will trigger the warning.
Wind Line Width
Some routes can cope with large Wind Lines as they do not have close passes with other Wind Lines. However if your route includes a section in which the Wind Lines are intersecting reducing the width can make understanding the map easier.
Chart Axis
Two options to choose from ‘Time’ and ‘Distance’. ‘Time’ will plot your charts with the X or Horizontal axis as the elapsed time of your forecasted performance. ‘Distance’ changes the axis to the distance covered.
Data Resolution
Large courses can be slow to load. This is particularly an issue on small devices such as mobile phones. To assist we can reduce the resolution, the number of points, we plot on the map and charts.
Gradient Smoothing
Elevation data can be sporadic causing seemingly large changes in elevation. The Gradient Smoothing averages the gradient change over a number of Steps. Our default of 30 is often the best number of steps for most courses however for mountain biking routes you may need to reduce the Steps for a more accurate profile.