For GCN, we were asked to look at the 2.36s Winning Margin, between Andrew Feather and Tom Bell. Check the GCN tech show out. Below the video, we I’ll show you how you can do similar experiments.
How you can discover stats like these with myWindsock
A myWindsock Virtual Athlete, rides the course just like you. However, they ride at any power, any aero, at any weight and never get tired. Just like you, they have to battle the weather and terrain. Virtual Athletes collect insightful data as they ride, meaning we can give you an exceptional level of detail about your activities.
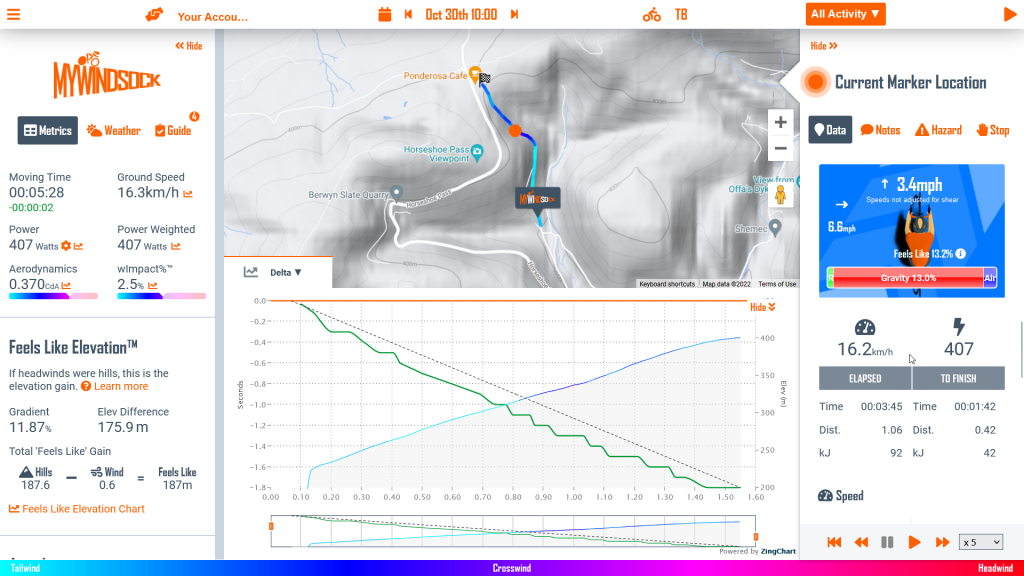
Once you have customised your Virtual Athlete, you can now make changes to see how that impacts the time. In this example we have increased the Virtual Athlete’s Power by a couple of Watts. Not only can we see how much time has been gained, we can also see where on the course the time was gained. Notice how this isn’t a linear line, time is gained at differing rates.

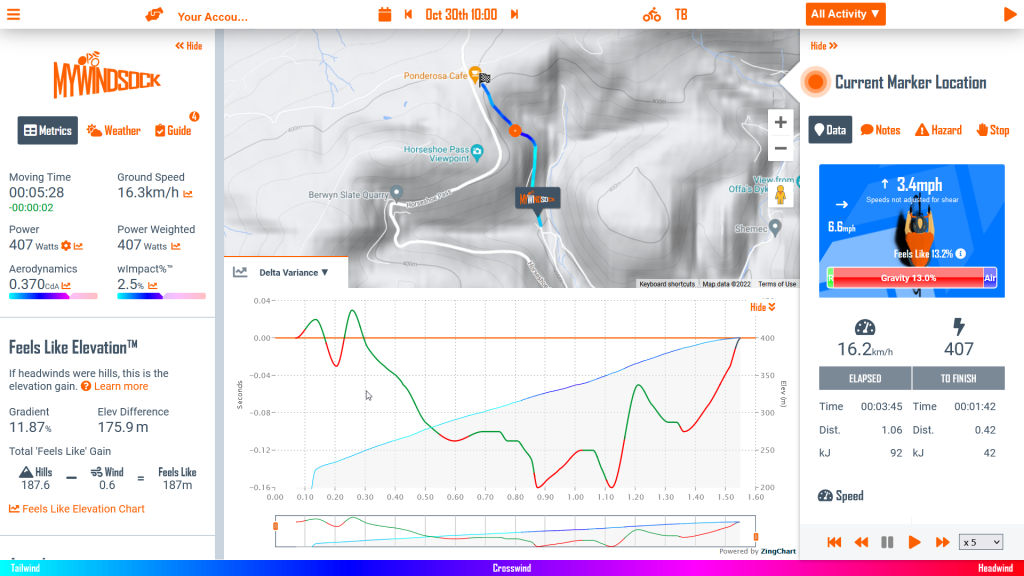
If you want to get super optimised, we can see where this extra power had the greatest impact on time. The Delta Variance shows this to us by colouring the line green. We’d prioritise these green sections when formulating a power plan.

Why not Predict what your National Hill Climb Time would have been, view forecast.
More about the National Hill Climb
>> National Hill Climb: The Winning Margin
>> National Hill Climb 2022 Weather Forecast

 UK Time Trial Events


