The 2026 edition of the men’s and woman’s MSR is taking place this weekend and while everyone is wondering who will win the direction of the wind has caught our eye here at myWindsock HQ. Of course, we pay more attention to this sort of thing than the cycling journalists typically do who are often caught up checking the form book from previous races at this point in time.
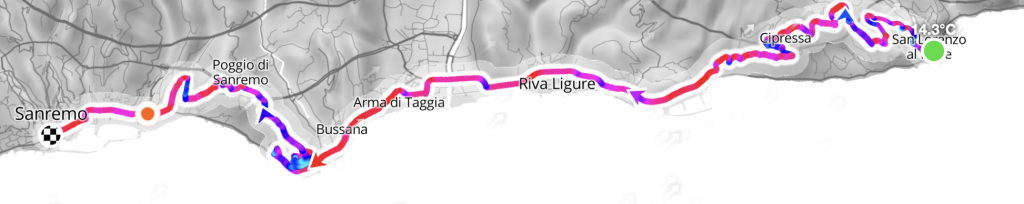
The nice thing about forecasting this race is that you can ignore everything up until the final 27km, when it all kicks off. In the past couple of editions of the men’s race, UAE have gone to the front into the foot of the Cipressa and launched an attack. As mentioned on the GCN race preview, the last 27km of the race was ridden at around 47kph last year by Ganna who ended up finishing second after UAE split the race on the Poggio.
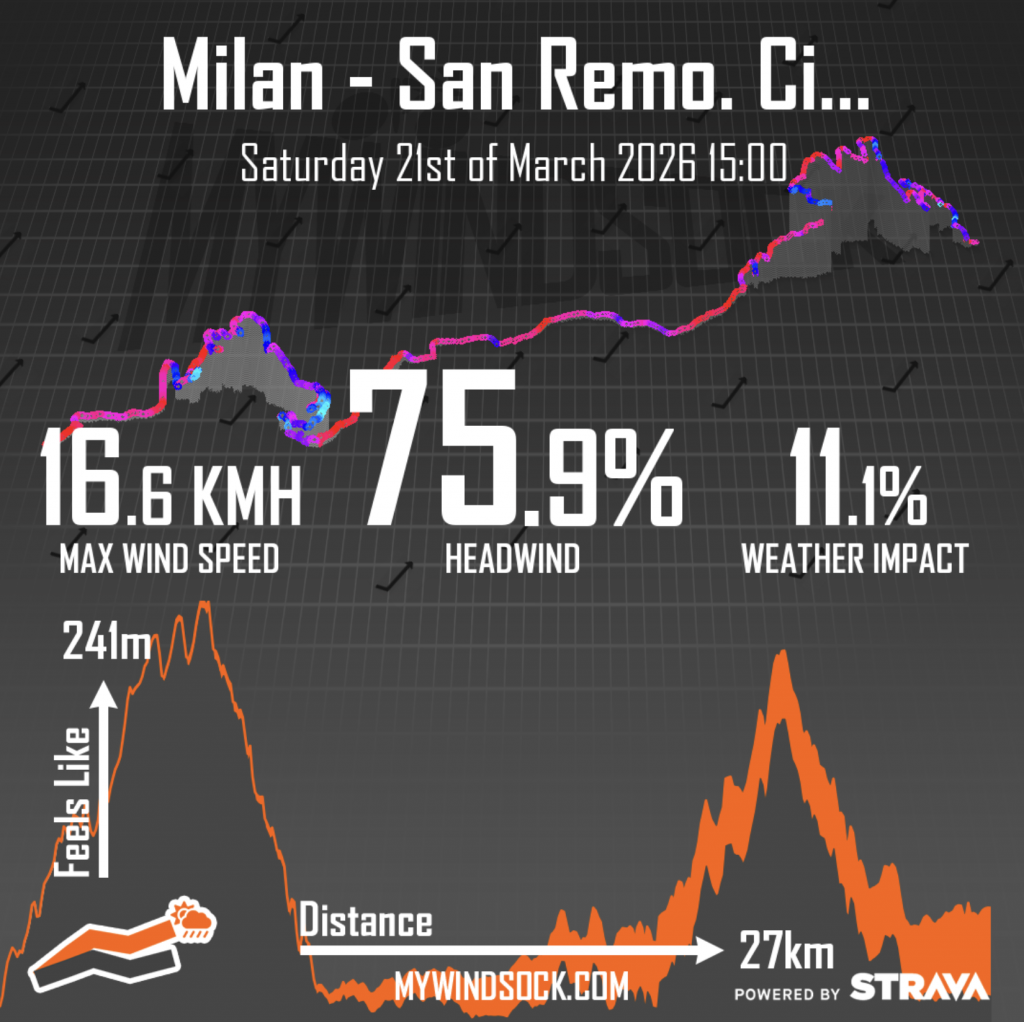
As things stand, the wind forecast for the final 27km is a strong headwind.
The forecast for the pair of climbs does not suit an early attack going, or sticking if it does go. A headwind changes the aerodynamic calculus for any attacking rider. If a rider attacks with a tailwind and gets clear of the peloton they benefit from the fact that the bunch behind them must now chase through the same air the attacker is moving through, meaning the peloton’s size advantage in sharing the workload is somewhat offset.
A rider doing 50kph into a 20kph headwind, however, is fighting 70kph of effective airspeed, meaning aerodynamic drag, which is proportional to the square of that figure, becomes enormous. The peloton behind, sharing the load between dozens of riders. Headwind solo attacks rarely work – even Pogacar can’t defy physics.
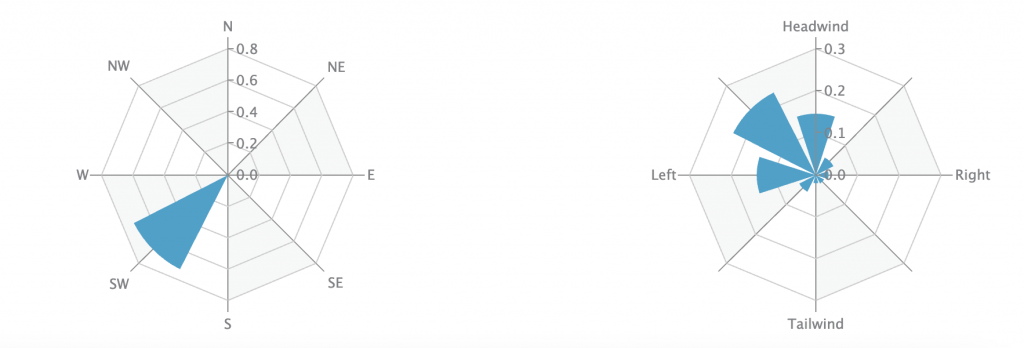
This is the wind forecast at the time of writing.
The wind speed forecasted at the final 27km of this race is around 15kph, with gusts around 20kph. This is not particularly strong if you’re stood still, however for a solo rider it turns a 45kph solo raid into the equivalent of 60kph in still air.
The wind forecast for the final 27km of Milan – San Remo can be seen here. If you want to see specific sectors like the Poggio or Cipressa climbs individually, you can “star” the segments on Strava and see them straight in your myWindsock account.
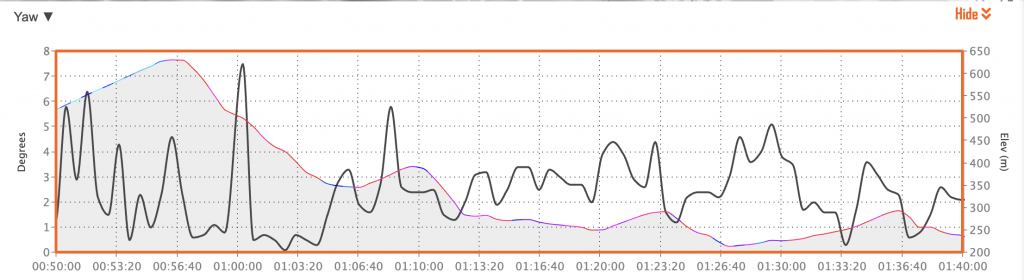
As you ride, both wind speed and wind direction shift relative to you, meaning one of the key factors in aerodynamics—the yaw angle—rarely stays consistent for long. Despite this, manufacturers often claim they have optimised their designs for particular yaw angle ranges. Some even argue that certain tube and rim shapes can behave like sails, helping to push the bike forward when the wind strikes from the right angle. Data from myWindsock shows us that over most rides, races or training, that yaw angle changes constantly. We thought we’d write a blog that tells you what Yaw angle is and how it can impact your aerodynamics.
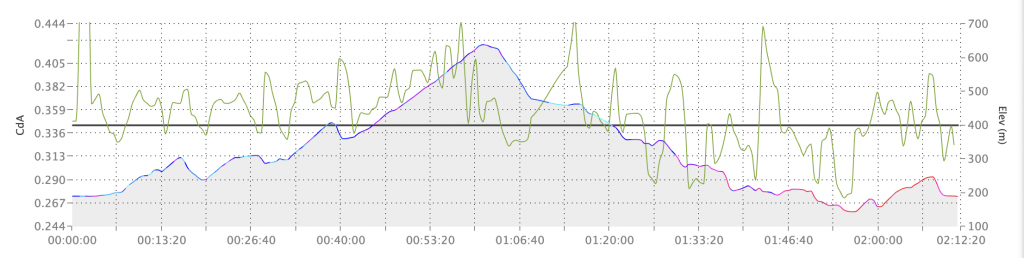
Data from a recent ride uploaded to myWindsock shows how we detect yaw angle changing over the course of a ride, it’s extremely variable for typical cycling speeds. Local topology and directional changes both play a role in the yaw angle experienced by a rider.
What is Yaw Angle?
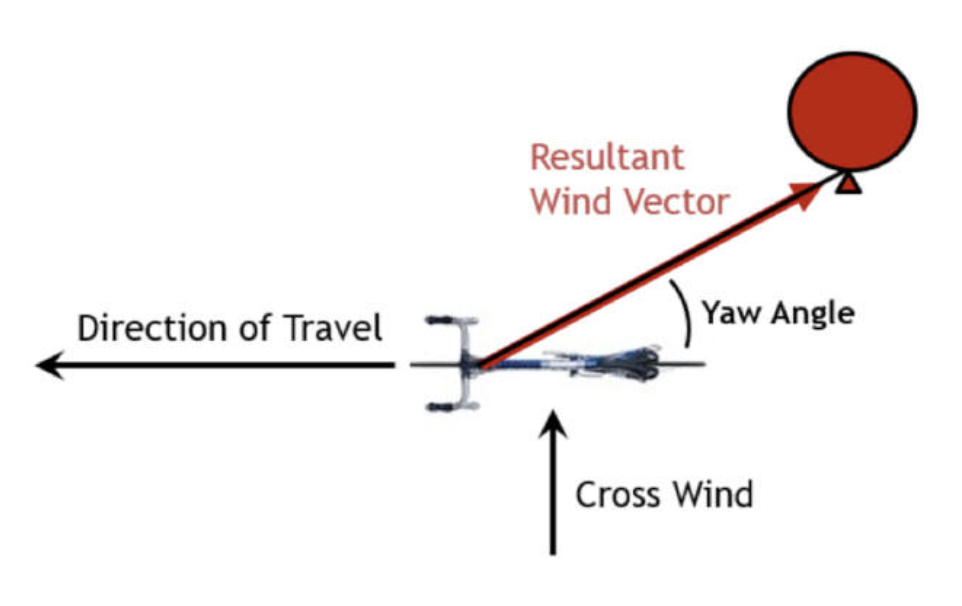
In cycling aerodynamics, yaw angle is the angle between the rider’s direction of travel and the apparent wind (the vector sum of the rider’s forward speed and the true wind). A yaw angle of 0° means the wind hits the rider directly head-on, while higher positive or negative yaw angles occur when crosswinds shift the apparent wind sideways relative to the bike’s path. That is to say “what direction does it feel like the wind is coming from relative to my direction of motion?”.
This diagram shows that yaw angle is the “average direction” of the wind felt.
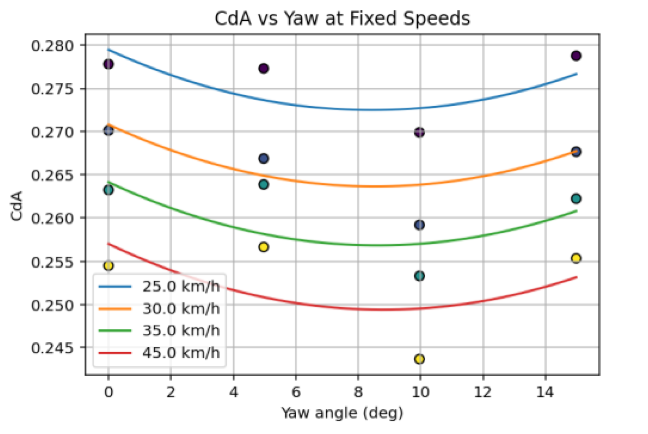
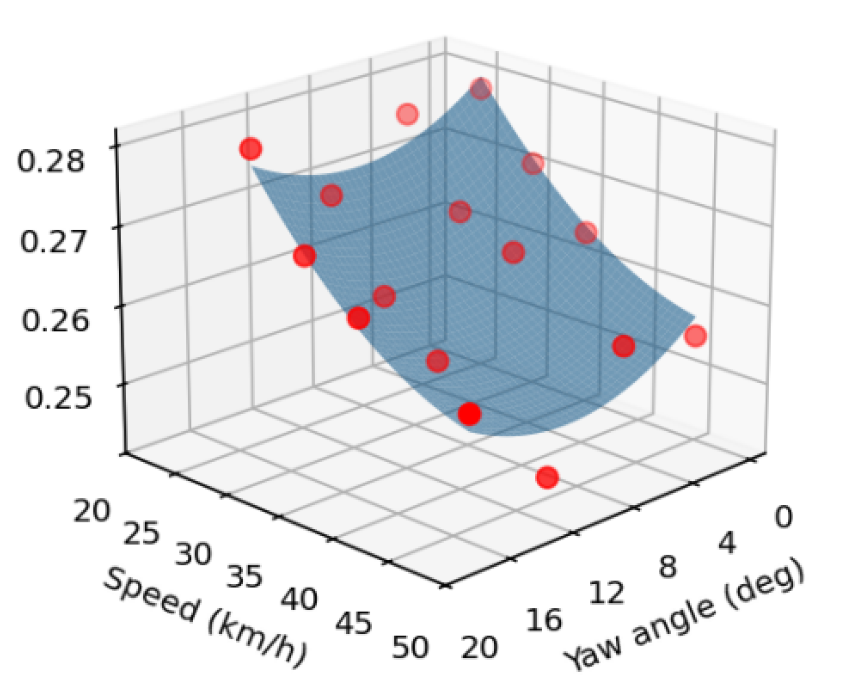
In this blog we wrote a little about the idea of “yaw dependent” cda, that is to say that your aerodynamic properties are dependent on the angle the wind comes from.
This graph shows CdA (the measure of how aerodynamic you are) as a function of yaw angle taken from wind tunnel data. It shows that, at different speeds, yaw angle can highly impact CdA.
How does all this impact my forecasts?
It’s early TT season as we write this and while this is a difficult time to get new PBs, it’s a great time of year for data gathering. One useful piece of information you can gain from this time of year is how the wind can impact your cda and while obtaining granular yaw dependent cda is tricky, but not impossible, with myWindsock you can very easily get an idea of whether you’re particularly “un-aerodynamic” on windy days.
This will help improve the accuracy of your forecasts which will allow you to preserve your biggest performances for days when a PB is more likely.
It’s no secret that here at myWindsock we love a TT and with 5 time trials on the first Sunday of March this year it’s fair to say we are well and truly back. Early season Time Trials aren’t all about PB times though, as there’s a lot of factors that can make them a bit trickier – even if you have great legs from a perfect winter of training. It can be cold, the air feels thick and the wind can blow! This blog will discuss how these conditions can impact your ride.
The Temperature
It’s no secret that it can be cold in March. In a TT, being very cold can blunt your ability to sustain high power as the cold shifts you away from the “sweet spot” of muscle and core temperature. Peripheral vasoconstriction reduces skin blood flow to preserve core heat, while muscle temperature drops, slowing contractile speed and nerve conduction. This makes each pedal stroke feel heavier so the same perceived effort can yield less power, especially during surges or on rises.
Cold can also increase breathing discomfort and stiffness, and if you start the TT even slightly chilled, you often spend the opening minutes “paying back” heat debt rather than settling into an efficient rhythm. In real-world pro cycling, a pilot study reported that cold conditions (with wind-chill–adjusted temperature around ~8°C) were associated with meaningful changes in power, speed, cadence, heart rate, and core temperature, suggesting performance can be limited when conditions and airflow overcool riders.
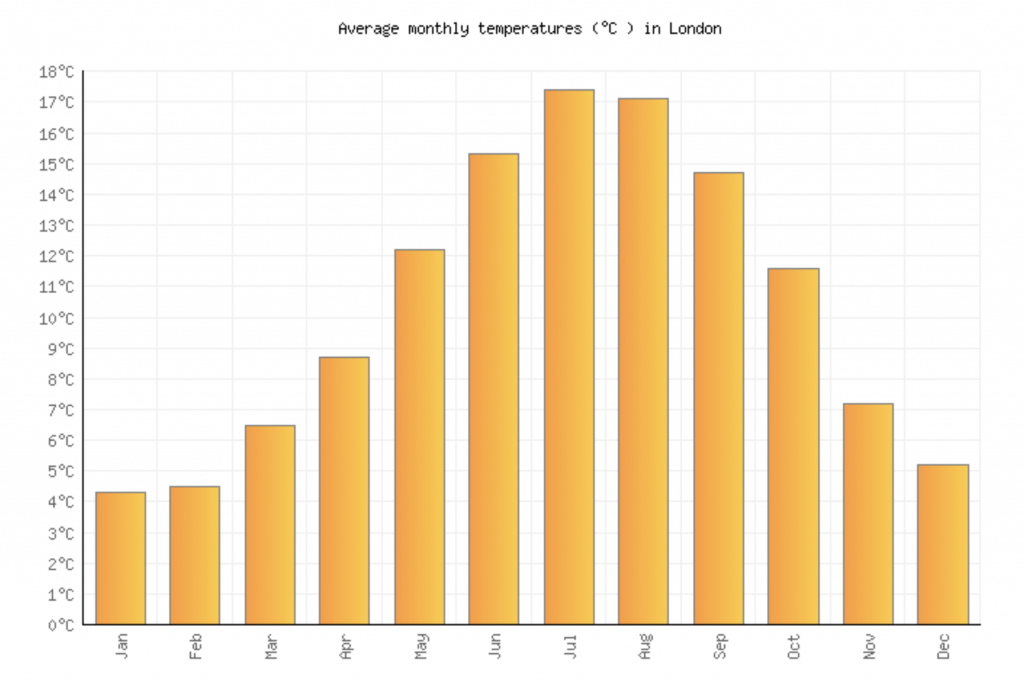
This graph shows Met Office data for the average peak temperature in London for each month over the past decade. London is warmer than most other parts of the UK and this is only the peak daily temperature. As such, it’s likely to be colder than this during your time trial!
It is possible to mitigate the cold and this is mostly about starting warm and staying warm without overheating. Do a longer, more progressive warm-up where logistics allow it and minimise the gap between your warm-up and the start. Getting your layers right is important too, a breathable base layer can add a little warmth and keeping your hands and feet warm can reduce the impact of the cold significantly.
The Wind
In my experience, the early season TTs are often the ones most likely to get cancelled for wind and 4 out of my 5 worst all time wImpacts on rides have been in the UK in March.
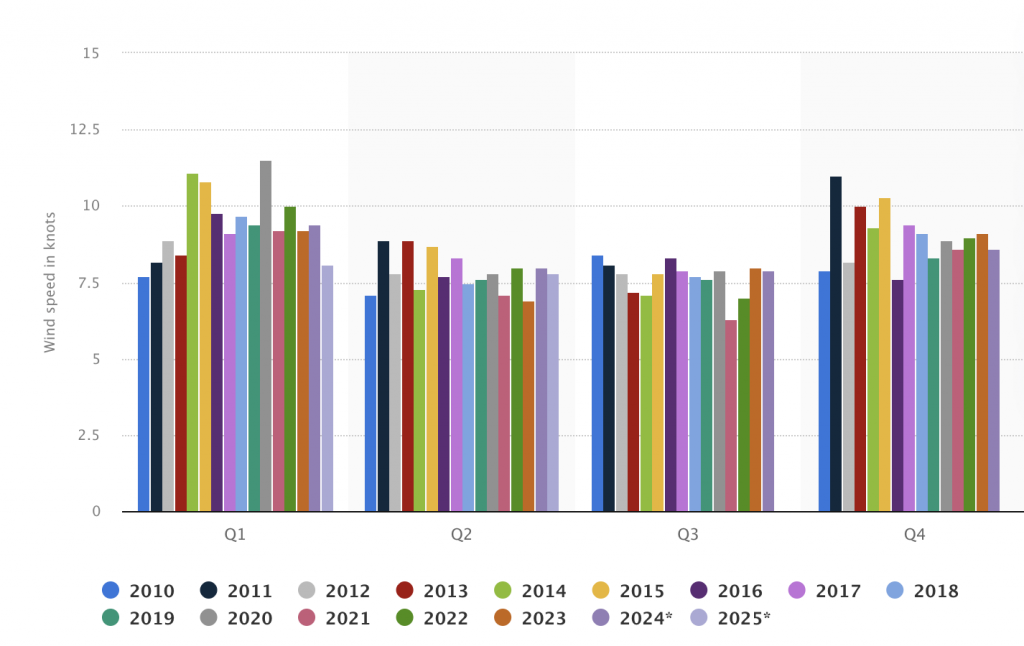
This plot shows wind speed by quarter in the UK, and we can see that Q1 (January to March) is often the windiest. This graph is from the website, Statista.
We all know that riding with a headwind makes you slower, and a tailwind makes you faster but something that goes under-appreciated is how important bike handling can be in the wind. Getting comfortable handling your TT bike can save you valuable seconds during short TTs.
The Air Pressure
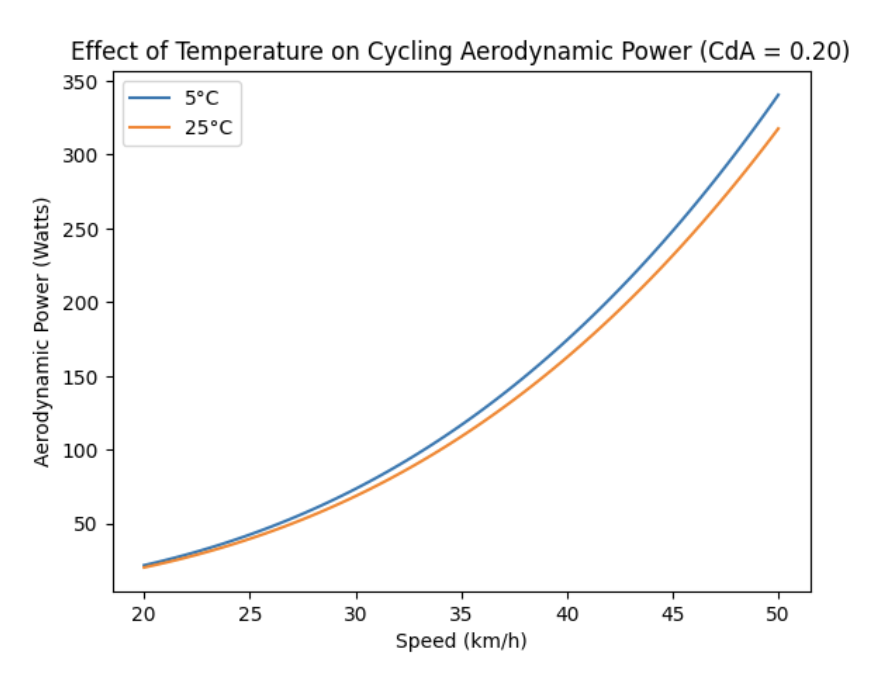
Cold air is more dense. When air cools down, its molecules lose energy and move more slowly. As they slow down, they don’t spread out as much and instead pack closer together. Imagine a room full of people: if everyone is moving around quickly, they spread out and bump into each other less; if they’re moving slowly, they tend to cluster more tightly. In the atmosphere, this means that at lower temperatures the same volume of air contains more molecules, making it heavier and more dense than warm air.
We can see that the impact for slower riders is much less than faster riders. As you get over 35kph the difference becomes pronounced. Drag force increases with the square of velocity and is directly proportional to air density so as the speed increases, the absolute difference between a cold day and a warm day increases too.
Early season time trials are rarely straightforward. Between colder temperatures, denser air and gusty winds, March can test more than just your FTP. While you can’t control the weather on race day, you can control how you prepare for it. Turning up properly warmed up, dressing smartly, pacing with the conditions in mind and being confident handling your bike in the wind can make a meaningful difference. The riders who perform well in these events aren’t always the ones chasing PBs, they’re the ones who manage the conditions best.
Last week, we published a blog all about how myWindsock calculates your cda from the data that you collect while you’re out on your bike. If you’re a consumer of cycling media, like us, or find yourself having a chat to your mate who has been in the wind tunnel recently, you might have noticed people saying “my cda is [insert number]”. This can be a little confusing, because although you get “average cda” when you look at a ride in myWindsock, you see that your cda graph looks something like this…
The value for cda can vary a lot during the course of a bike ride.
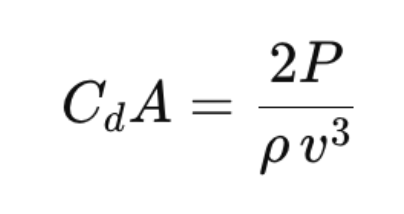
During the blog on how myWindsock calculates your cda, we looked a little into the origins of where this formula comes from…
In this expression, P is power that’s measured at your power meter, the Greek letter rho is air density and v is the rider’s air speed.
All of these variables in this equation, are themselves functions of something else. Power is a function of time (unless you do an exactly evenly paced ride of course, then it’s constant). Air density is a function of altitude and weather and speed is a function of many things but changes during the course of the ride too. All of these variables are known at each point on the ride and cause cda to be different at each point in time.
It’s currently the case that you can use the myWindsock advanced settings when making a forecast to enter a speed or gradient dependent cda – something that may reflect you sitting up out of the TT bars over climbs and getting back into position on the flatter segments. This will change soon, but more on that in the future.
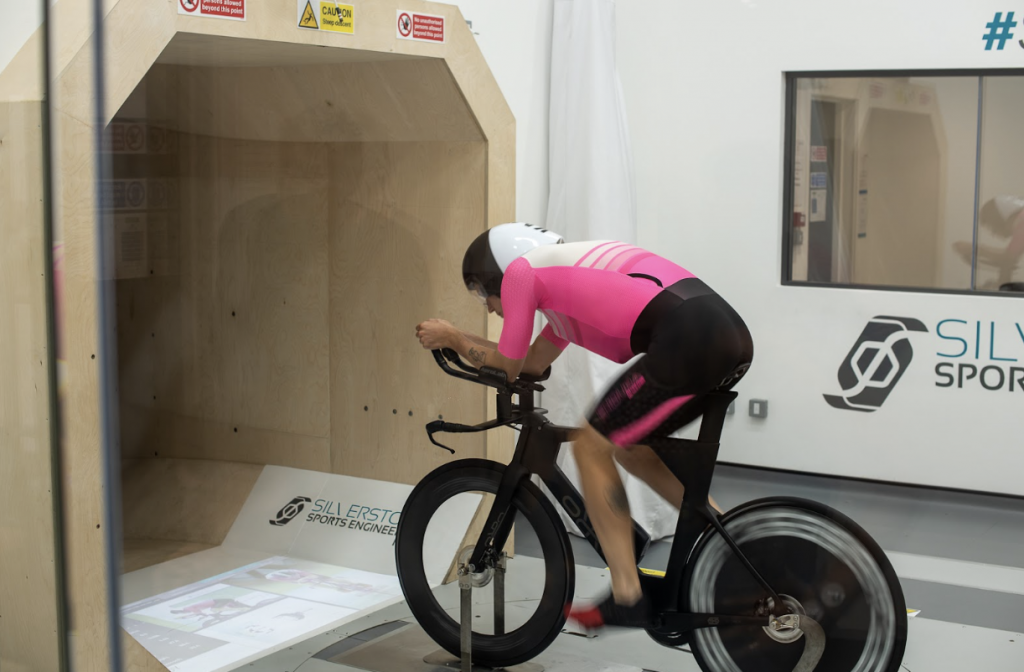
During a recent trip to the wind tunnel, we observed a rider’s cda was heavily dependent on both wind speed and yaw angle together.
The key thing to remember is that your cda is not a fixed number, but a parameter which constantly changes and has many dependencies feeding into it. The best time trialists and triathlon cyclists have a sixth sense for minimising it at all times. Narrowing their shoulders, shrugging their heads and staying in the TT bars even during slower parts of the course.
Physics was not everyone’s cup of tea from their school days, however we thought the myWindsock website needed a place which did explain some of the basics of cycling aerodynamics to give our curious users a place to begin to look under the hood. This blog will give you enough of an idea to understand how myWindsock makes predictions but without overwhelming detail (or giving away too much of the magic).
As such, we need to skip some steps to communicate the basic point without losing people with unnecessary formalities. This will possibly irritate readers with advanced degrees in Aero Engineering and I suggest they stop reading immediately.
Imagine you’re riding a bike at constant speed through the air.
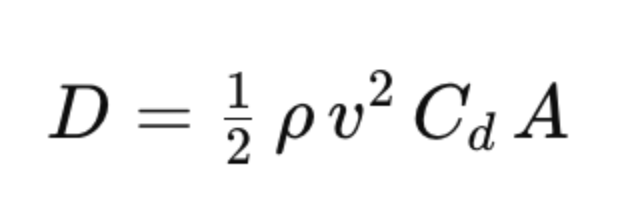
We’ll start with the drag equation, skipping on the details of how we get from physics first principles to it. We can calculate the drag force (the number of Newtons a cyclist is pulled back by) with this formula, which will look very simple or very confusing, depending on when you last did maths and how much you enjoyed it at the time.
In English, this says that Drag (D) is equal to air density (the Greek letter rho) multiplied by velocity squared (v, multiplied by itself) multiplied by the product of drag coefficient (Cd) and frontal area (A). In even simpler terms, you calculate the drag on a cyclist by multiplying a bunch of numbers together – some of which are to do with the cyclist and others to do with the environment.
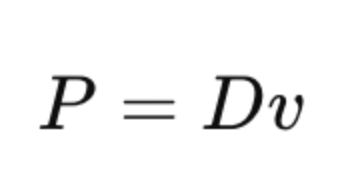
We can also calculate the power needed to ride at this constant speed using the following equation. This is useful to us because we are able to measure power much more easily than we are able to measure drag while we’re out on the road.
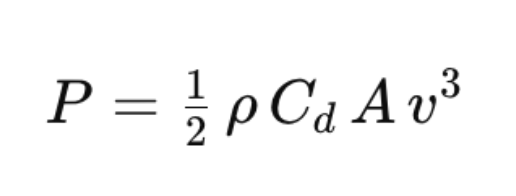
Using some algebra (sorry) which you’re welcome to try at home, we can combine these two equations and obtain the following result…
This tells us how we can calculate the aerodynamic drag required to ride at the constant speed we mentioned earlier. As a cyclist, you may know what power you’re riding at because you’ve got a powermeter on your bike. You are unlikely to know your CdA. As such, we can re-write the equation with stuff we “know” (reasonably estimate or measure to sufficient accuracy) on one side of the equals and the stuff we don’t know (or that’s much harder to estimate) on the other side of it.
Time for a quick disclaimer, the power on our powermeter here displays all the power we are using to overcome all resistive forces, but we’re only talking about aero power here so we are going to have to make some slightly wild, but fine for illustrative purposes, assumptions. Let’s try and plug in some numbers.
Right now, where I am, the air density is 1.19 kilograms per metre cubed (which means, if you were to somehow weigh a cube of air that’s one metre by one metre by one metre it would weigh 1.19kg) and we’ll imagine I’m doing 30kph on my bike with my power meter reading 220W on a road and we’ll assume forces that aren’t related to air resistance make up 20% of our power output. As such, the amount of power we are using against the air is 176W. If we plug all of those numbers into the expression above it gives us an estimate for our CdA of 0.517.
This isn’t a complete description of how myWindsock calculates CdA, nor is it a rigorous explanation of the equation of motion of a cyclist but it gives you a fairly solid introduction into the mathematics of cycling…at least at a constant speed on a flat road.
Two minutes doesn’t sound like much—until you’re halfway up the climb at National Champs and every pedal stroke fills your legs with that burning feeling. Mastering your pacing for a two-minute effort can be the difference between flying over the top or blowing up halfway.
Recent research on 800-metre runners, the ultimate two-minute specialists (ish), offers surprisingly direct lessons for hill climbers. Studies reveal exactly how elite athletes distribute effort, manage energy, and stay fast when the body is screaming to slow down.
This weekend, riders head to the National Hill Climb Championships, where the race will be won in approximately (just over) 2 minutes. Here’s how you train for and pace it…
Build a Bigger Engine (VO₂ Peak Still Rules)
Watanabe’s team found that even in a race lasting only around two minutes, athletes with higher VO₂ peak ran faster. In other words, you can’t fake endurance, even in short, explosive events. The aerobic system kicks in within seconds, not minutes, and it supports sustained output once the initial surge fades. It’s not really a revelation that having a higher VO2 max helps during a short endurance event – but the extent to which it matters does surprise a lot of people. It’s NOT a sprinter’s race!
Hill-climb takeaway: To prepare, include workouts that stress your aerobic ceiling:
3–5 × 2 min uphill at 90–95% max heart rate, with full recoveries.
Longer tempo climbs (4–6 min) at controlled effort to raise aerobic power.
A strong VO₂ peak means you’ll hit the climb harder and last longer before the legs “flood with” lactate.
Train to “clear lactate”
The same study identified lactate removal ability (γ₂) as a crucial determinant of performance. Those who could clear or reuse lactate faster maintained speed better through the second half of the effort. On a climb, that’s the rider or runner who keeps pushing while everyone else fades.
Hill-climb takeaway: Train your body to tolerate and clear lactate:
Do repeated short hill sprints (30–45 s) with 30–60 s easy recoveries.
Add “float” intervals—alternate hard 45 s pushes and moderate 45 s efforts without full rest.
These sessions teach your muscles to recycle lactate as fuel instead of letting it shut you down.
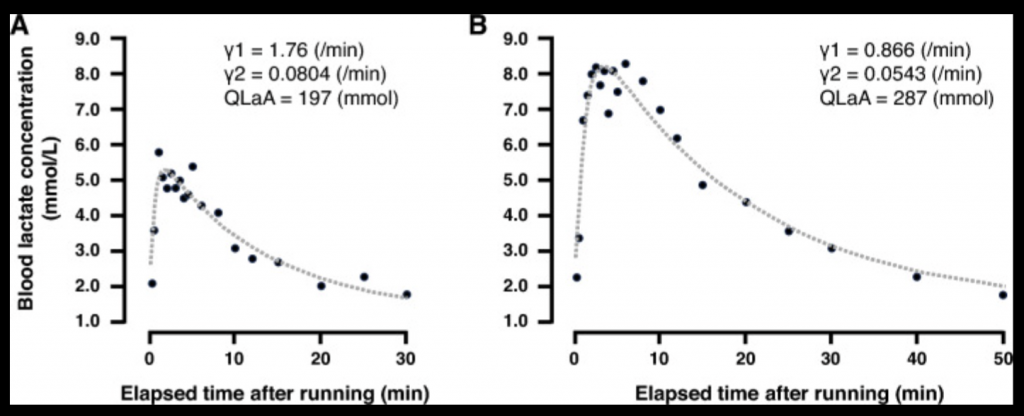
These graphs show how blood lactate levels changed after a 30-second sprint at 24 km/h for two runners — one with the fastest 800 m time (1:49, shown in A) and one with the slowest (2:07, shown in B). The dotted lines show the best-fit curves used to measure how quickly lactate was exchanged (γ1), how fast it was removed (γ2), and how much lactate built up during the sprint (QLaA). You can see how much faster the fastest runner (A) was able to clear lactate – note the difference in scale on the x axis.
Fast Start, Smooth Fade
Hanley’s analysis of world-class 800 m races shows that almost every top performance follows a fast-start, controlled-fade pattern: an aggressive opening to hit top power early, followed by a gradual deceleration. The secret isn’t a final sprint—it’s slowing down less than everyone else.
Hill-climb takeaway:
Launch confidently to get up to race power quickly.
Settle into a sustainable rhythm within 20–30 s.
Focus on holding form as fatigue builds—shoulders relaxed, breathing deep, cadence steady.
A small fade is inevitable; the goal is to make it gradual, not catastrophic.
The Art of the Final 30 Seconds
In the last stretch, you’re no longer chasing speed—you’re fighting to keep it. This is where aerobic strength and lactate clearance combine with mental control. Keep your upper body calm, eyes fixed just ahead, and drive through the burn.
Remember: perfect pacing isn’t even pacing. It’s knowing exactly how much burn you can handle and stretching that line to the summit.
It’s the night before the big dance – and athletes in Kona are currently having their penultimate night’s sleep before the women’s Ironman World Championships in Kona and we’re of the opinion that course records will probably fall. Historical precedent tells us that it’s the first year where it’s within the realms of possibility that the winner of the women’s race in Kona this year will be faster than the male winner from 2014!
Here at myWindsock, we’re focussed on the weather forecast and the bike course. Will a bike course record go? We think it could.
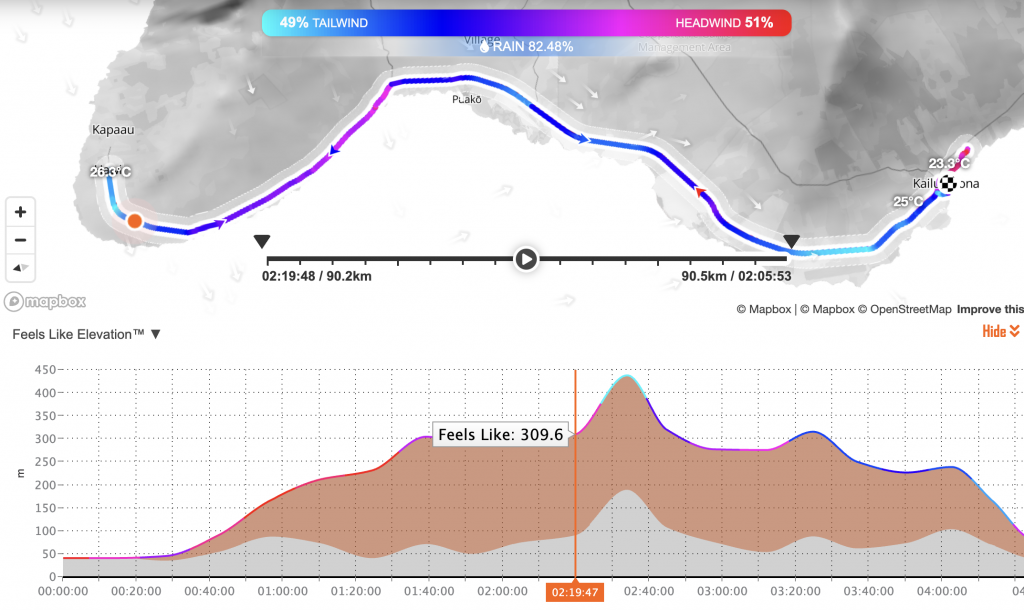
A lot has been made of the weather forecast in the triathlon media this year at Kona, it’s going to be pretty windy with the average wind speed picking up to around 30kph in the back half of the bike course and the famous crosswinds on the Hawi descents are looking like they’ll make an appearance.
Even though the wind on course is pretty high, the wImpact on the day is between 0 and 1.5% – this is pretty low and means athletes will only be a maximum of 1.5% slower when compared to a completely neutral day. In 2018 conditions were similar when the bike course record was broken by Daniella Ryf.
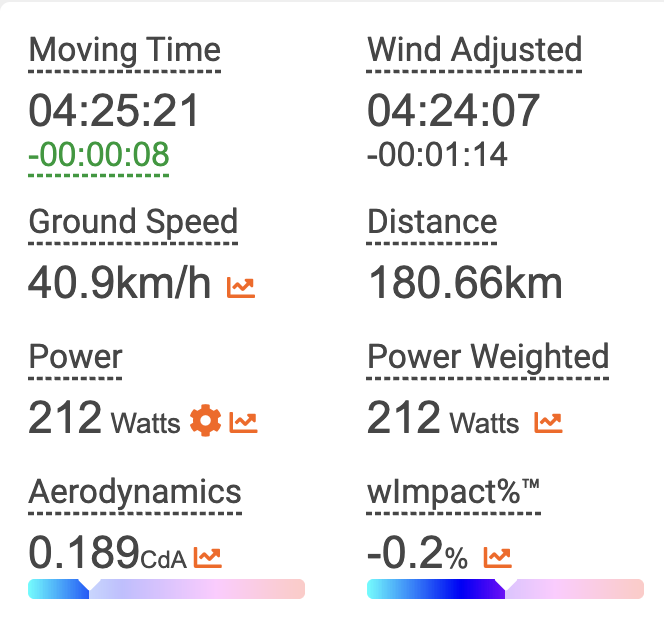
Using a system mass of 72kg (that’s bike and rider) and reported rolling resistance and drivetrain losses values that represent the best of the best – a rider with a cda of around 0.19 will need between 210W and 215W to break the course record. This will be a power to weight of around 3.5W/kg.
Equipment advances and a favourable weather forecast have made it likely that the bike course record will fall.
It’s become less fashionable a term recently, on account of its horrific overuse, but marginal gains is the idea that if you make incremental improvements to your setup or training that it will add up to something significant. It was popularised in the early 2010s by Team Sky (now INEOS) back when they used to win stuff.
Recently, I’ve been on a bit of a buying spree for my TT bike and have been thoughtfully shopping – aiming to prioritise by Watts saved per pound spent, but while doing this I realised that the thing that matters really is time saved per pound spent.
The marginal gains we will test in today’s simulation will be…
Switching from GP5000 to GP5000 TT, both with latex inner tubes
Independent tests of this set up have shown an improvement of around 1-4W per tyre.
Removing the front derailleur and switching to one chainring
This could save, again, between 1 and 4W in aerodynamic savings.
Adding an aero OSPW system
This has a claimed saving of 2.4W relative to a dura ace set up.
Using a super slippery waxed chain
Wattshop claim their ‘Cratus’ waxed chain can save 3-5W compared to a standard clean chain.
Very moderate weight savings
Using a combination of factors, I’ve also managed to shave 650g off my set up and body weight.
Marginal gains can include aero overshoes that go to knee height and other such accessories banned by the UCI on the grounds of fashion decency.
Before we get started here, it’s worth noting that all of these claims are probably wrong in the context of this specific simulation with this specific setup. However, that’s not really the point of this blog. It’s actually to answer the question of “We know you can accumulate meaningful savings but how much of a difference does it actually make?”
The first step we’ll do is run each saving individually and then finally, we’ll put them all together and see the time difference between the standard set up plus all the marginal gains.
It’s worth noting that aerodynamic savings scale with speed whereas rolling and drive train resistance savings remain more stable (they’re not actually constant, but for the simplicity of our model approximating them as constant yields acceptable results).
We will assume that, for the sake of simplicity, saving 1W is the equivalent of riding 1W harder – this is not actually true (as 1W saved at 30kph might be 3W or something at 50kph) so, if anything, this is likely to underestimate the time savings from our marginal gains – especially the aero ones. That said, it makes the simulation much simpler to carry out – so we will make the assumption none the less.
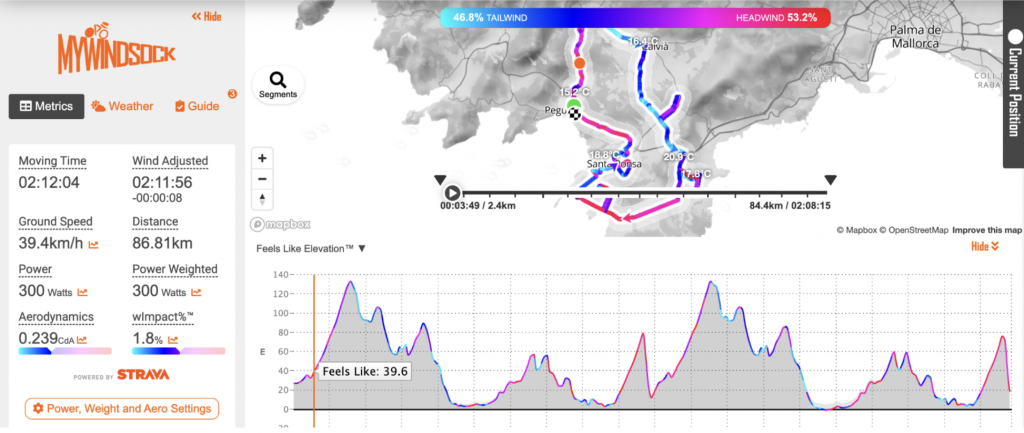
The final assumption we’ll make here is that our rider is riding at a constant power of 300W – this is not realistic, or optimal, but makes it easier to isolate changes so we’ll do this for illustrative purposes. At the end, we’ll have a perfectly paced simulation – centred around 300W.
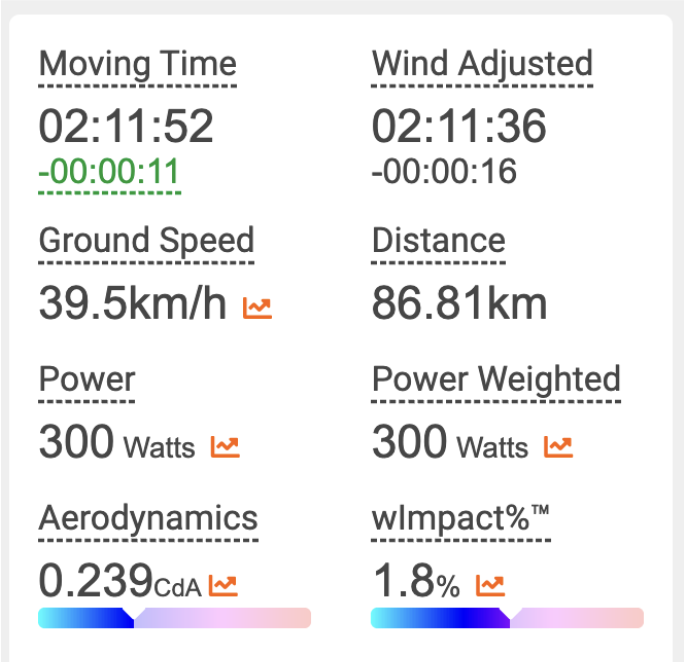
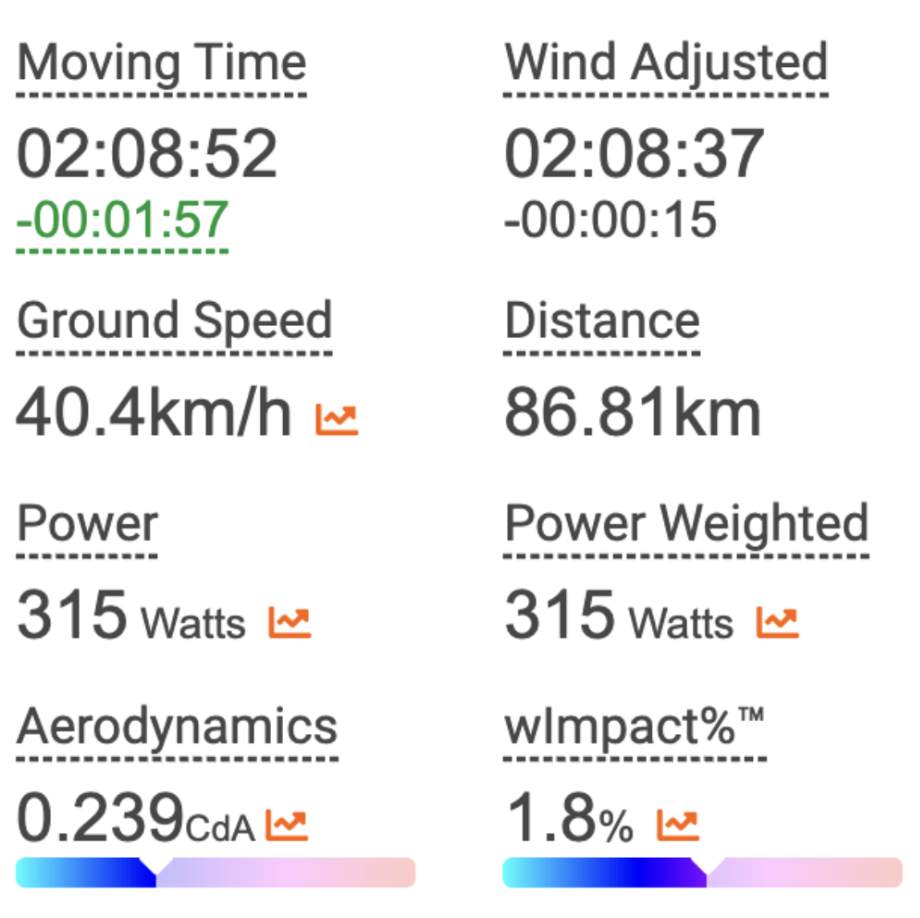
Standard Set Up
Using our standard set up on the almost 87km bike course from Challenge Peguera Mallorca we can see that our rider is able to achieve an average speed of 39.4kph. This was completed with a standard 2X12 drivetrain with a new-ish, clean but standard chain, Continental GP5000 tyres and such. Pretty close to the standard, out the bike shop, set-up.
After each run, we’ll reset the simulation to the original conditions so when you see a time saving, it’s with respect to our baseline set up.
Weight Savings
As we’ve saved 650g – that’s about 0.7% of our total system mass, we might see a gain in speed as a result of this, considering it’s a pretty punchy circuit. Let’s run the simulation taking 650g off our set up and see what happens.
We can see here that we’ve saved a total of 11 seconds and had a speed increase of 0.1kph, based on the amount of money and effort that weight loss required I’m not certain it was worth the bother…
Waxing our chain
Let’s see if the Wattshop waxed chain, with a saving of 3-5W (we will use 4W) can save us a decent amount of time…
A Wattshop chain typically costs about £70, so we’re paying £1.40 per second saved. Let’s take a look at the OSPW.
Oversize Pulley Wheel
A saving of 26 seconds is decent, but when we remember that the OSPW costs around £400, we’re looking at about £15.38 per second saved which isn’t the best value for money, however it’s a decent saving if money is no object.
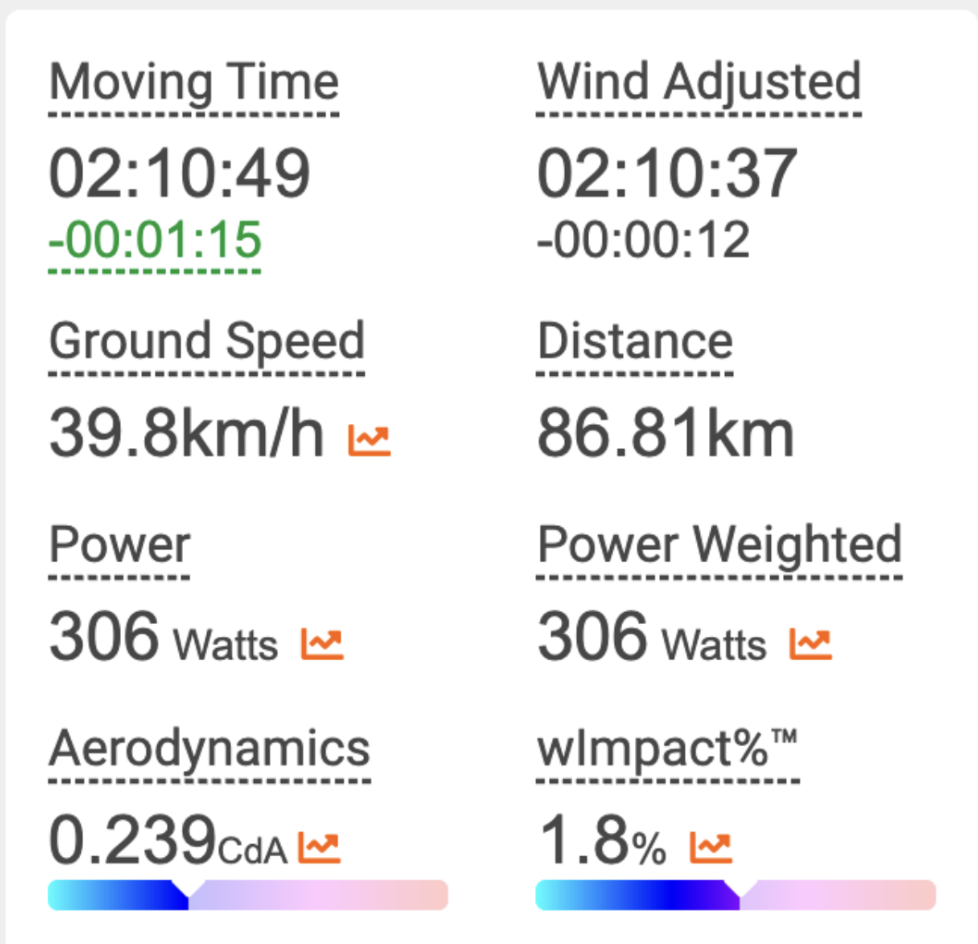
Going “one-by”
Typically, the 1X chainring’s aero savings are dependent on yaw angle but savings between 1 and 4W are common. As such, we’ll see a saving of around 35s here.
Fresh Tyres
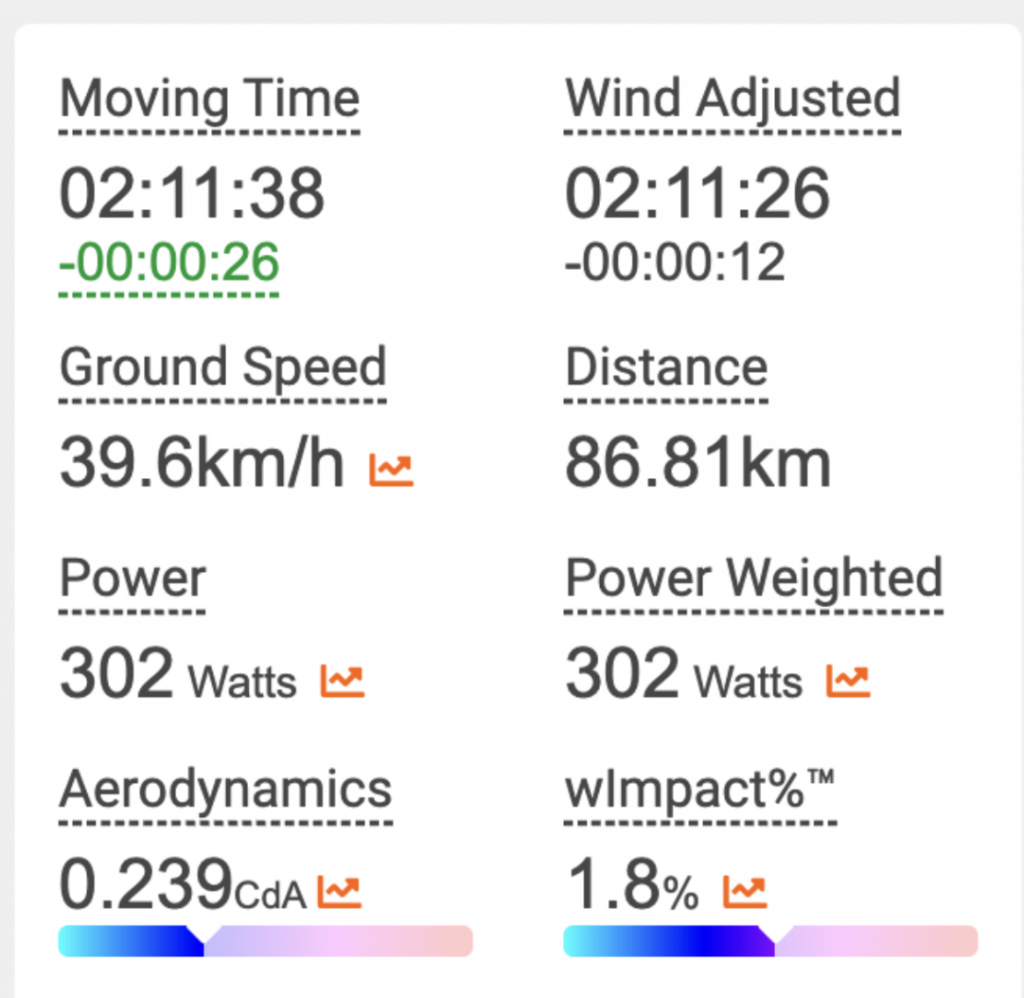
This is actually one of the most interesting examples of non-obvious speed improvements. Independent testing has shown the difference to be about 3W per tyre – so a total saving of 6W. Running a simulation with a 6W boost in power we see this…
A massive 75s off our original bike split, I bought a pair for £120 which is a price of £1.60 per second saved.
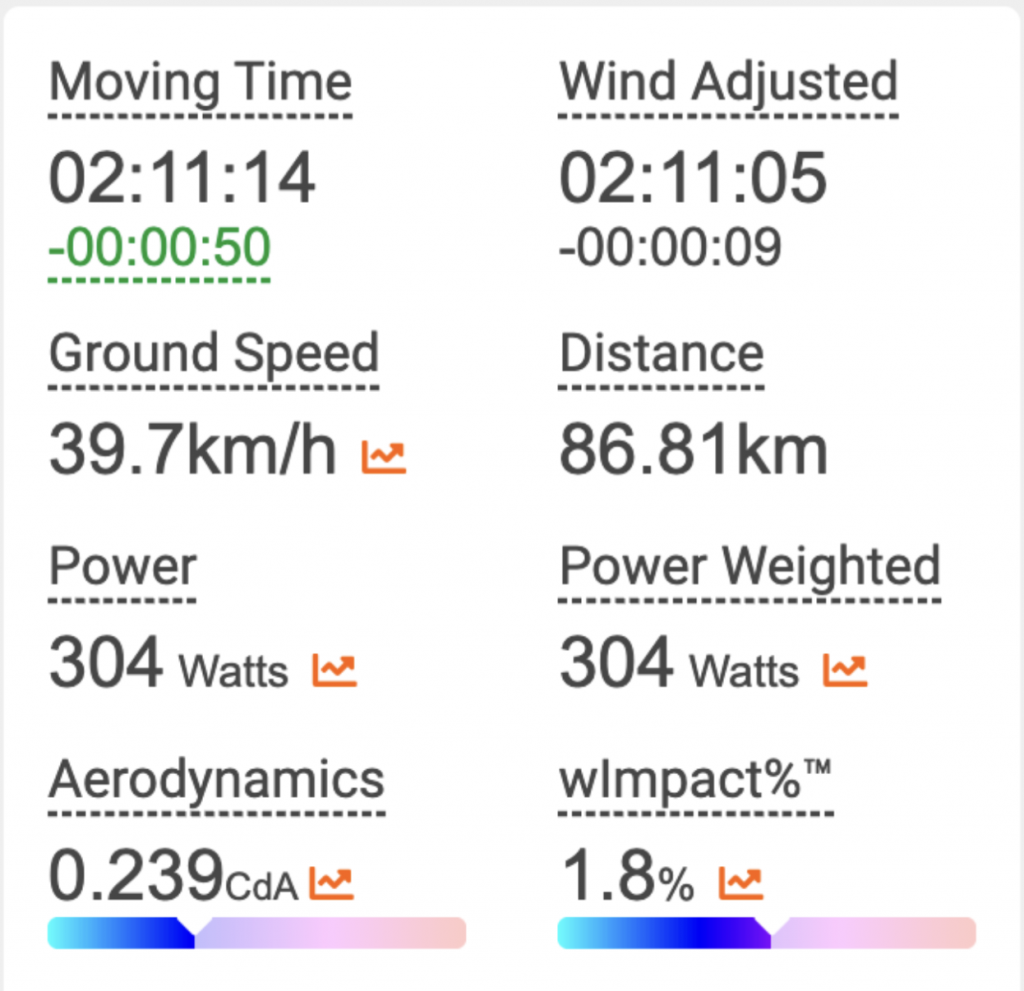
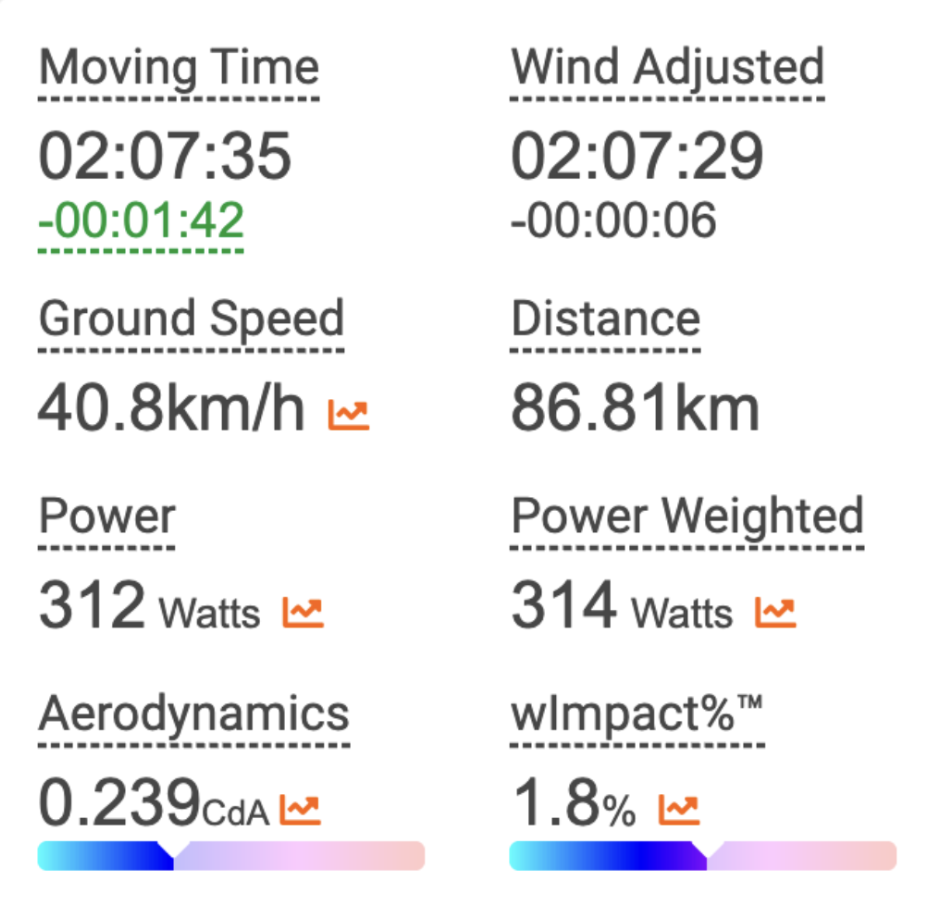
All together
In total, these savings add up to 15W (plus our 650g) saving.
When we put all of that together we find a total saving of almost 2 minutes adding 1kph to our initial average speed.
Marginal gains AND perfect pacing…
That’s not the end of it though, we all know that riding a course (especially one that’s hilly) with a flat power is not the fastest way to do it.
You can optimise your pacing for a £20 a year myWindsock subscription, which costs you 19.6p/second saved.
As much as it pains us to say (not at all, we love it), marginal gains really do add up, without getting any fitter at all we’ve just saved ourselves almost 4.5 minutes simply by throwing money at the issue and pacing properly.
IRONMAN 70.3 World Championships 2025 course preview
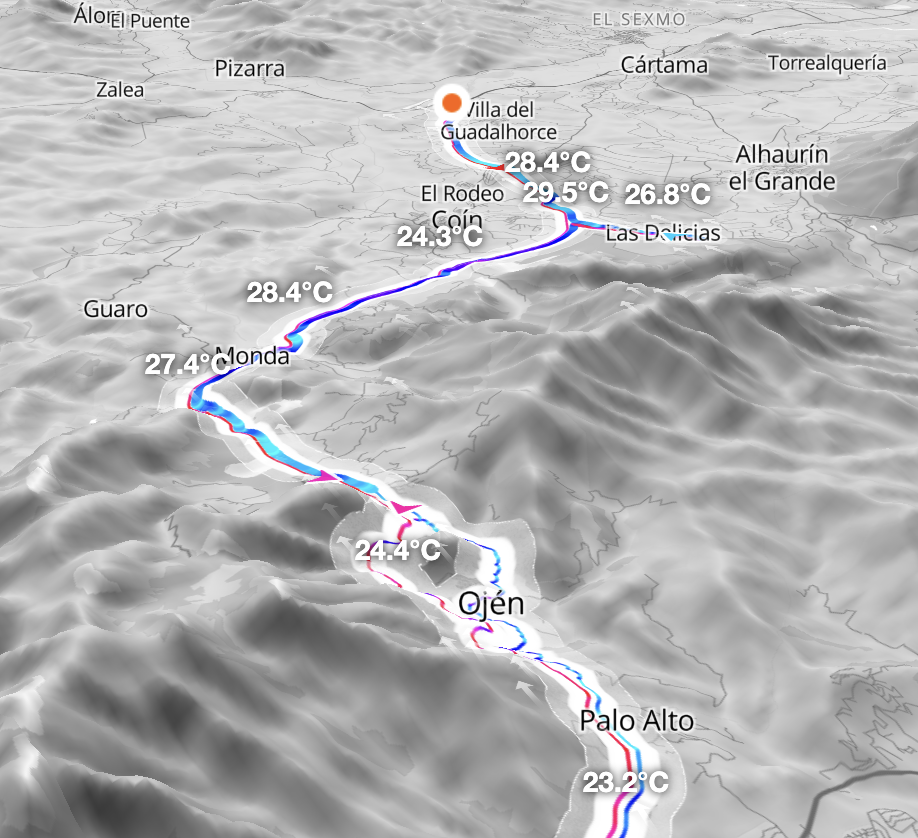
This year, the IRONMAN 70.3 World Championships take place in the Spanish seaside town of Marbella. 2025 is the year of “Carbs before Marbs” and you’re going to need it in order to get round this monstrosity of a bike course – with 20m of climbing per kilometre it’s got to be the hardest 70.3 World’s course in history. The course map really doesn’t look that bad but it has 1.5 times the amount of elevation per mile than the “mountainous” IRONMAN World Championships course in Nice – it’s way harder. Of course, myWindsock is the only acceptable tool to quantify exactly how hard this course is.
The course doesn’t look too bad on paper as the climbs are quite low altitude, but there’s steep pinches and it starts right at sea level so it’s a tough slog up to the peak at 600m.
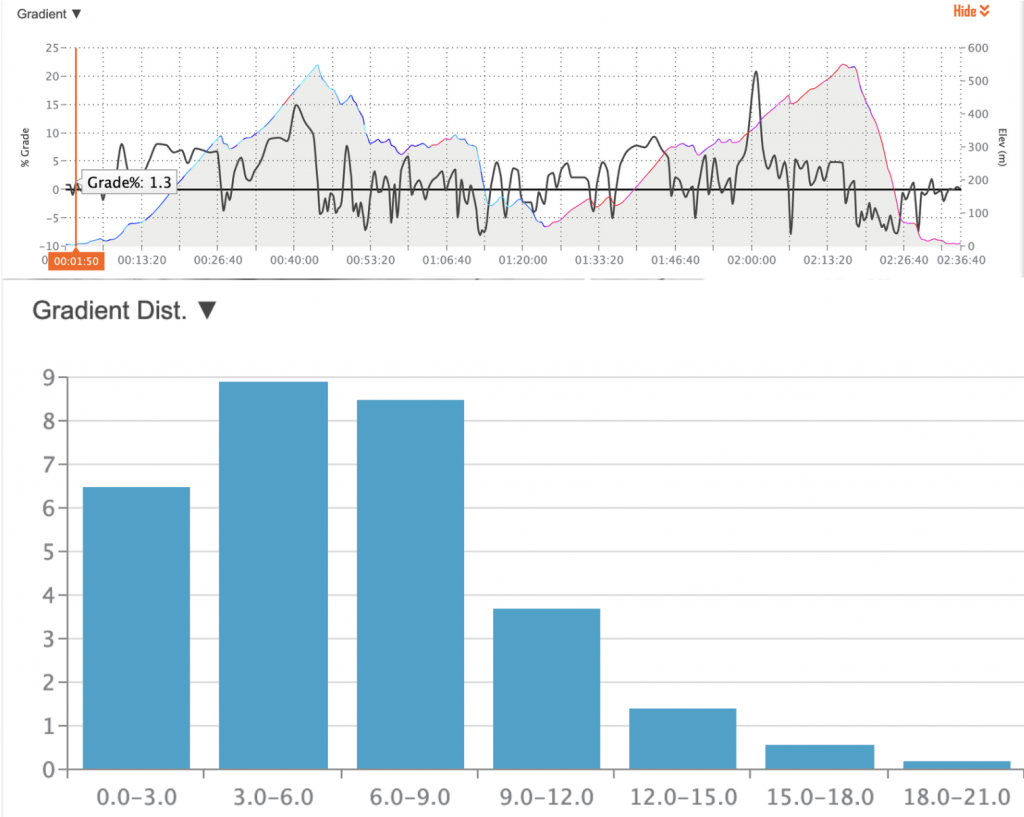
The hardest thing about this course is the fact there’s long climbs with vicious pinches in gradient that peak over 20%. We can look at the gradient plot and distribution of gradients here.
Using the two myWindsock gradient plots, we can see that riders spend the majority of their time between 3 and 9% – moderate gradients, however the trouble comes above this. For most riders to keep their cadence over 80, they’ll need a gear ratio of at least 34-40. There’s likely an argument for a gravel rear mech at this race to allow a much larger cassette and still maintain a decently large front ring for the descent.
How to think of the course?
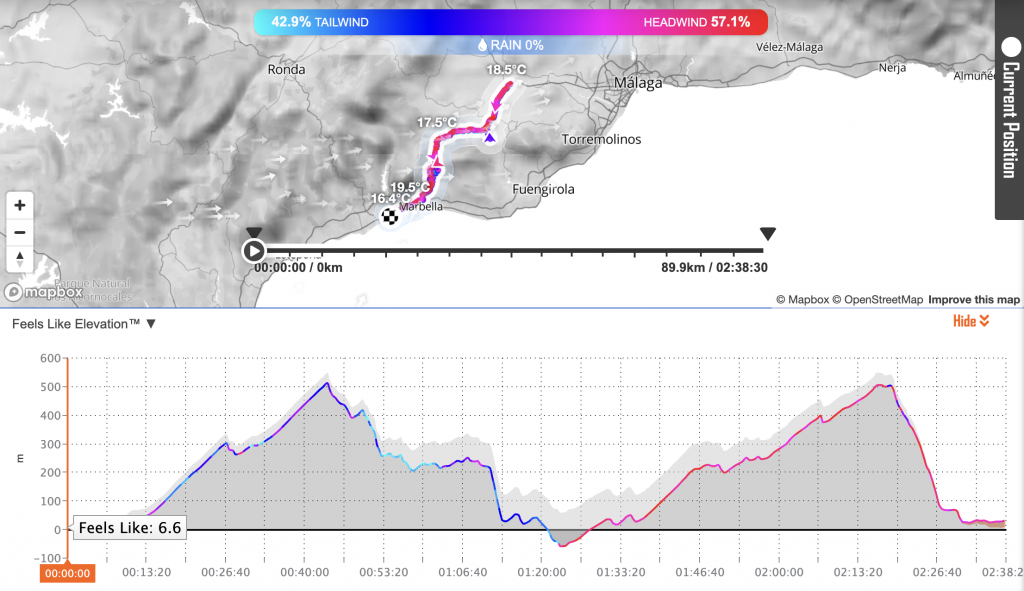
The course leaves Marbella toward the hills behind it, passing Palo Alto, Ojen and surrounding villages to a turnaround – where you go back on yourself a couple of times before descending into Marbella itself. The most likely scenario is a stiff wind blowing off the sea helping you up the first climb before a more open section where anything could happen!
Here at myWindsock we care about two things – predicting how the weather will impact your speed on the bike and riding fast time trials. That’s it. Today we have three tips for you that will help you, backed with some myWindsock science, ride a faster TT without simply pedalling harder.
Step 1: get aero.
Hold your position
Staying in the aero bars during a time trial sounds like a trivial piece of advice but it’s something that was recently demonstrated by Red Bull Bora riders at the 2025 Tour de France – riding uphill in the aero bars during the mountain time trial to some pretty good success. Being more aerodynamic is typically faster even when speeds are pretty low.
How much difference does it make?
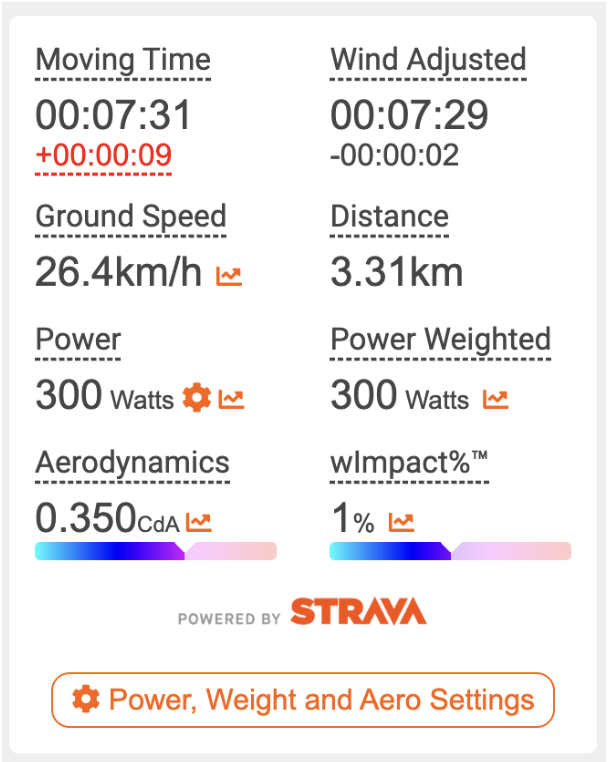
For this we’ll take the sort of segment you might find in a TT in the UK, a 3.3km drag of around 3%. For a 70kg rider on an 8kg bike with a typical “sat up” cda of 0.35 doing 300W this gives us a ground speed of 26.4km/h and time on the segment of 7:31.
What happens if we put that same rider in the TT bars and drop their cda to 0.23? Good position discipline comes down to one thing, training. Ride your TT bike a lot, on hard days and easy days – if your time trialing is your primary goal then it shouldn’t even matter if you can do less power, as you’re training the muscles you’re going to use on race day. One of our favourite sessions is to go and ride up the longest climb you can find in the TT bars at a low cadence to really practice recruiting all of those TT muscles. Let’s take a look at what happens on that climb if the rider stayed in the bars…
That same rider goes up the climb 30s faster, that’s a huge saving on a 7.5 minute section of course. In fact, the time savings are so great that our rider would have to pedal at 30W less in the TT bars before it became slower on this particular segment.
Pacing
The old adage of riding fast is about minimising the amount of time you’re riding slowly for is as true now as it ever was. Efficient pacing is a game of energy investment – put more energy in when the resistive forces are lower and you’ll get more seconds back for your power investment.
How much difference does it make?
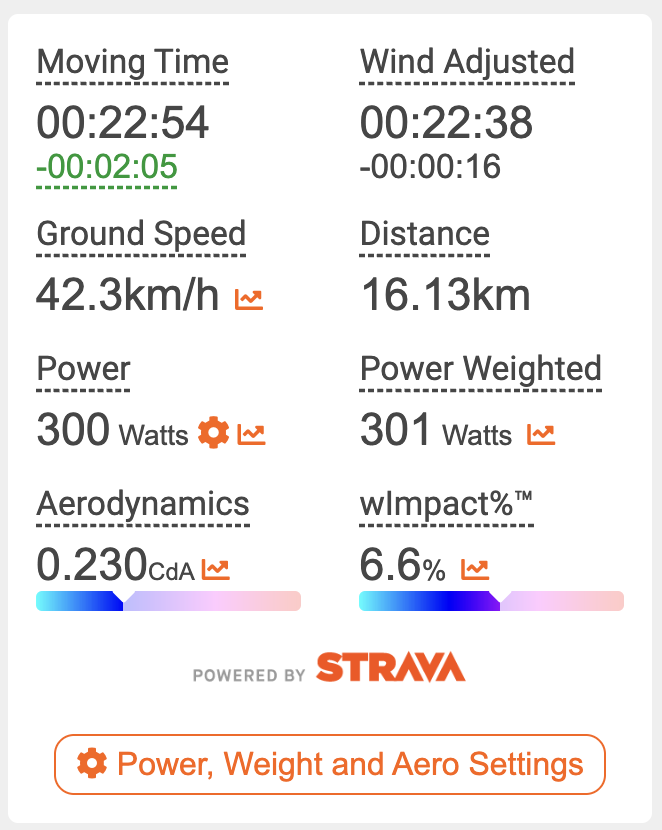
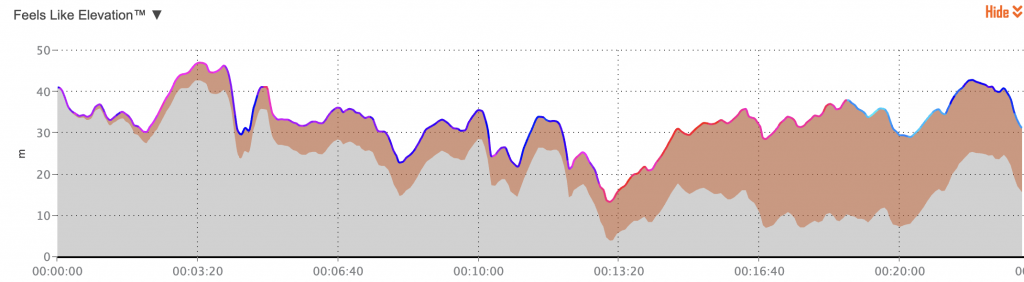
For this example we’ll use the world famous (well, moderately well known in Hampshire) P164 time trial course. It’s a rolling 10 in the New Forest with 130m of climbing over 16.1km.
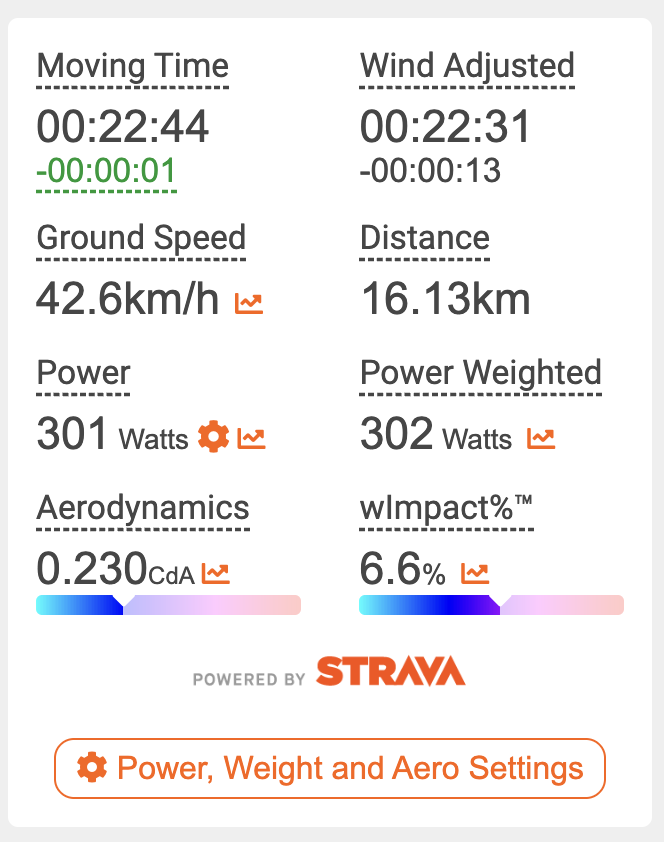
A smooth power of 300W yields a time of 22:54.
This course doesn’t suit a smooth power output as we used in the example above, as you can see by the elevation profile…
We can even see the headwind into the finish makes the elevation feel much worse than it actually is, massively increasing the importance of pacing on this course.
Let’s input a series of pacing rules, that yields the same normalised power but distributing our power slightly differently. myWindsock settings allow us to do this and we’ll impose a series of pacing rules (like “if speed > 60kph, power goes to 0W”).
Suddenly, by pacing our ride properly rather than a smooth power, we’ve managed to save 10s over the course of the TT for 1W more – saving one Watt on our set up would not yield 10s worth of savings. This 10 seconds can easily be a margin of victory in an open 10.
How to do it?
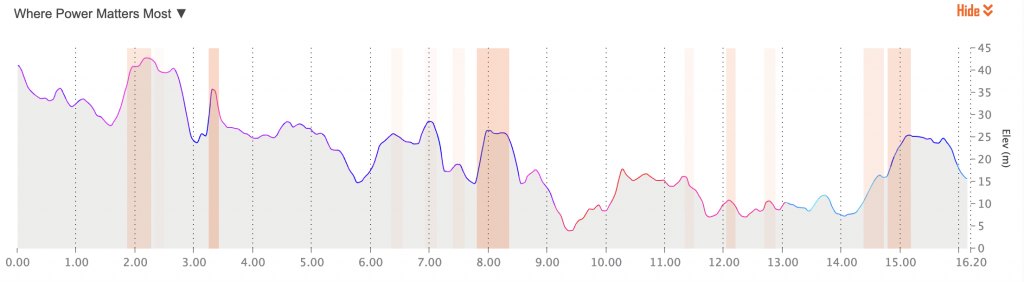
Make use of the “Where Power Matters Most” graph on your event myWindsock forecast and avoid just doing a flat, smooth power.
The shaded areas on this plot are where you should squeeze the pedals a little harder – the darker the shading, the harder you should squeeze the pedals.
Tyres, chains and gears
A clean bike is a fast bike, and a bike with a waxed chain and ceramic bearings is a slightly faster bike on top of that. This final tip is often marginal, but time trials often come down to small margins and that’s half the fun. Let’s delve into the myWindsock advanced settings and see how it impacts our TT on the P164 remembering our well paced effort yielded a time of 22:44, what happens if we fully optimise our tyres and chain?
Spending upward of £500 going from “good” to “great” with rolling resistance and drive train efficiency can save us 37 seconds over a 10 mile TT.
That’s it then, riding a fast TT is simple – good pacing, good position discipline and spend money. The most efficient pound per second save expenditure you can make is a myWindsock subscription. With this, you can test your pacing and equipment strategy on a given course to help you plan race day down to the second.