History

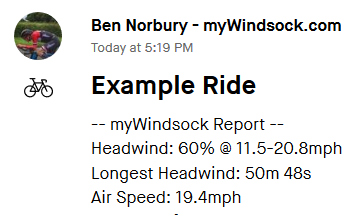
View myWindsock data, analysis and experiments.

Connect more services

Close

Add to Planner

Create your free account
I have an account. Log me in.
  • Athlete
  • Coach

I accept the Privacy Policy

Your privacy

myWindsock.com does not share your information with third parties. From time to time myWindsock.com may contact you with product updates and other material that may be of interest to you.

You have the right to remove your information at any time.

View our full Privacy Policy

Already have an account? Log in.
Login

Welcome back...

I want a new account
  • ...
Assistant Chat Preview

Start plotting
Or open an Activity or Route

Plot and go...
A quick wind check before you leave. Create route

Or open Activities & Routes

When I upload a ride to Strava...

  • myWindsock Report

    Add myWindsock data to my Strava Activity description.

  • Email Notification

    Send me an email with summary data and a link to the Activity's Analysis on myWindsock.


I can get you set up.

How would you like to proceed?


'

Turbo or Road?

Choose 'Turbo Trainer' to simulate your activity with Feels Like Elevation™

Turbo Trainer On the Road

Premium feature, your trial ends in . Upgrade now
Would you like to add your myWindsock Report to this Strava Activity?

Create race plan notes

Ensure you know the plan. Course notes allow you to add extra information about the race plan on to the course.
Learn more about premium

Upgrade to Filter Segments

Find segments with tailwinds and headwinds with .
View Premium Options

Premium Feature

Unlock all leaderboard efforts with Premium membership.
Learn more about premium

Premium Feature

Experiment with pacing and create intervals with Premium membership.
Learn more about premium

Download your VP now

This feature is available with .

View your upgrade options

Access this Chart Now

This chart is available with .

View your upgrade options

Maximum Profiles Reached

Your current plan is limited to .
View Your Plan Options

Upgrade for more Weather

Premium Spatial3 weather engine sources weather by elevation, distance and time for super high definition weather data. Learn more

Premium Feature

The Play feature is one of the many great features of myWindsock Premium.
Learn more about premium

Free Play, Premium Feature

We'd like to show you this feature before you sign up to Premium. If you like it please upgrade and enjoy this and many more features.
Learn more about premium

Use Your Activities Watts

Repeat your Activities performance in these conditions with a Premium account.
Learn more about premium


Educate your AI Athlete

Select past activites for your AI Athlete to learn from.
Learn more about premium

AI Athlete Perfomance

Watts
CdA
Kg

Note

Scope of Interval

Data Range

-
Delete
Save Interval Save and Apply
Apply Changes
Hide Summary Data
  • Metrics
  • Weather
  • Guide
Hide
Weather Summary
Weather data from around the route for time and locations.
Weather data for the anticipated time at locations around the route.
  • Temperature Range
  • Wind Speed Range
  • Rain %%
  • Rain Intensityinch/hr
  • Total Rainfallinches
  • Air Densitykg/m3
  • Sunrise
  • Sunset

Activate Weather Trends.

Weather Trends keeps all the weather data for your analysis.

Start recording data

Course Guide

Things that we think you'll find interesting appear here!

    Charts
    • Interval Designer
    • Experiments
    • Where Power Matters Most
    • Last Change Comparison
    • Delta
    • Delta Variance
    • Weather
    • Weather Overview
    • Wind Direction
    • Wind Speed
    • Feels Like Elevation™
    • Feels Like Elevation™
    • Gradient
    • 3D Perspective
    • Dynamics
    • Air Penalty
    • Air Speed
    • Crosswind
    • Ground Speed
    • Ground Speed Dist.
    • Ground vs Air Speed
    • Head/Tail Wind
    • Rolling Average Speed
    • wImpact%
    • Yaw
    • Yaw Dist.
    • Aerodynamics
    • CdA Profile
    • Distribution
    • Detected Braking Points
    • Run Power
    • Energy Requirement
    • Power Profile
    • Rolling Average Power
    • Power Duration
    • W' Bal [BETA]
    • Rolling Weighted Power
    • Course
    • Gradient
    • Gradient Dist.
    • Resistance

    View this Chart with Premium

    Learn more about Premium
    Aero
    Course Data
    Segment Effort
    • Athlete
    • Position
    • Time
    • Date
    • Moving Time
    • Wind Adjusted
    • Ground Speed
    • Distance
    • Run Power Watts
    • Power Weighted Watts
    • AerodynamicsCdA
    • wImpact%™%

    Power, Weight and Aero Settings

    Feels Like Elevation™
    Your wind adjusted elevation.
    • Gradient%
    • Elev Difference
    Total 'Feels Like' Gain
    • Hills
    • Wind
    • Feels Like

    Feels Like Elevation Chart

    7 Day Trial 'Feels Like' data is how the wind feels in gradient. Learn more about Premium.
    Aerodynamics
    Your efficiency moving through the air. As CdA decreases, speed increases for the same power.
    • 100
    • 180
    • 260
    • 340
    • 420
    • Aerodynamics CdA
    • Variance CdA
    • Yaw Angle
    • Air Resistance %

    View the CdA Chart

    7 Day Trial Aerodynamic analysis reveals how efficient you are at moving through air. Learn more about Premium.
    Elevation
    • Gain
    • Loss
    • Total
    • Average Grade %
    • Time Ascending
    • Power Climbing Watts
    • Climb Rate M/HR
    • Gravity Resistance %

    View the Gradient Chart

    Wind Analysis
    Air speeds are estimated from the prevailing wind angle and adjusting the wind speed for the terrain.
    • Longest Headwind
    • Headwind Time
    • Tailwind Time
    • Air Distance
    • Air Speed
    • Max Headwind ()
    • Max Gust
    • Max Crosswind ()
    • Max Air Speed
    • Air Penalty
    Resistance
    • Air%
    • Gravity%
    • Rolling%
    • Acceleration%
    Totals
    • Elapsed Time
    • EAS Time
    • wImpact%%
    • Longest Headwind
    • Headwind Time
    • Tailwind Time
    • Ground Distance
    • Air Distance
    • EnergykJ
    • Elevation
    • Elev. Gain
    • Elev. Loss
    • Time Braking
    • Time Ascending
    • CdA Var
    Afternoon Ride is a course in . The course length is 0km in length with m of elevation gain. The 'Afternoon Ride' course has a maximum gradient of % with and average course gradient of %.
    Cancel
    Ok

    Would you like to connect Strava?

    • Enhance your Strava Activity data with in-depth weather and analysis.
    • Forecast your next ride using past Strava Activity data, with myWindsock AI.
    • Find segments with the optimum conditions and discover how to take the KOM or QOM.
    Loading...

    Best Cycling Apps 2025
    "Totally nerdy, totally brilliant."

    Hide Current Position

    Current Marker Location

    Close
    Speeds not adjusted for shear
    • Brake
    • Roll
    • Gravity %
    • Air Resistance
    Feels Like %

    Play segment

    • rpm
    AI Athlete
    Elapsed To Finish
    Time Time
    Dist. Dist.
    kJ kJ

    Speed

    • Ground Speed
    • Air Speed
    • Rolling Avg.

    Metrics

    • Run PowerWatts
    • Power Avg.Watts
    • Cadencerpm
    • Yaw
    • Gradient%
    • CdA
    • Brakes%

    Weather

    • Surface
    • Temperature
    • Precip. Chance%
    • Air Densitykg/m3
    • Humidity%

    Time Stopped

    Hours Mins Secs

    Description

    Delete Stop

    Close
    View Weather Map & Charts
    Segments
    • wImpact%

      Tailwind
      Headwind
    • Distance ()

    • Time

    • Average Watts

    • Average Speed ()

    • Gradient %

    Headwind
    Tailwind
    RAIN SNOW %
      You have Intervals that will affect this athlete's performance.
      Help set my power...
      • Use Activity Power
        Power CdA
        Flat


        Ascending


        Descending


        Performance Rules

        Adjust the Virtual Athlete's Power and CdA when the specified conditions are fulfilled.

        + New rule

      Athlete's Gender

      Bike & Rider Weight (KG) Weight (KG)

      Height (CM)

      Advanced Options

      Create a power plan Learn how
      Apply Settings


      Aero Config

      These parameters affect how the CdA calculations are made

      Loop Sensor Configuration

      Remove Braking

      Moments of braking will be removed from the CdA calculaton.

      Minimum Loop Distance

      Prevent small loops on out and back courses.

      Metres

      Loop Tolerance

      A high number will produce the most accurate measurement. If your loops have not been detected reduce the number. Tip: Enabling GLONASS + GPS produces the best results.

      Test Detection

      Sensitivity of the detection of test changes. This is the length of time stationary.

      Seconds

      Loop Filter

      How aggressive should the filter be at removing outlier loops.

      Speed

      Which measurement of speed should be used.

      Don't break loops for stops

      If you had a stop during a loop and you wish to measure the loop.

      Display Loop Markers

      View on the map where Loops have been detected.

      Discount First Loop

      Do not include the first loop of each test in averages.

      Discount Last Loop

      Do not include the last loop of each test in averages.

      Force Same End and Start Point

      Only applies when no loops found. If elevation data is incorrect and your activity finishes close to the start.

      Settings are saved for your next visit

      Offset Wind Lines

      Metres

      Out and back courses can be offset to separate the Wind Lines. Pick the side of road and distance to offset.

      Wind Shear

      For the best results pick a landscape that would describe the locality of your course. This is used to adjust the wind speeds for wind gradient/shear. This is the slowing of air flow due to surface frictions.

      Laps

      Starting Speed

      As default your starting speed will be estimated using your performance settings. If you are starting this course from stationary select 'Zero'.

      Course Direction

      Unit Preference

      Averages

      Appearance of Charts and Map

      Apply Settings
      View Weather Data
      Close