It’s January which means one thing only – TT season is round the corner (ok maybe it also means other things). Races are popping up from mid February which means some early season form testing is on the cards. You might find that, as a result of a really consistent winter, your power numbers are really good this time of year yet you churn out a couple of slow time trials before it warms up. New kit, new bike fit, more watts and still going slower, but why? Winter time trials are slow!
Rest assured, it’s probably nothing to do with how powerful or inherently aero you actually are yourself and is more to do with the conditions. Of course, by subscribing to myWindsock you will have confidence in knowing this as the conditions are taken into account and you’ll know it was a slow day with high Weather Impact.
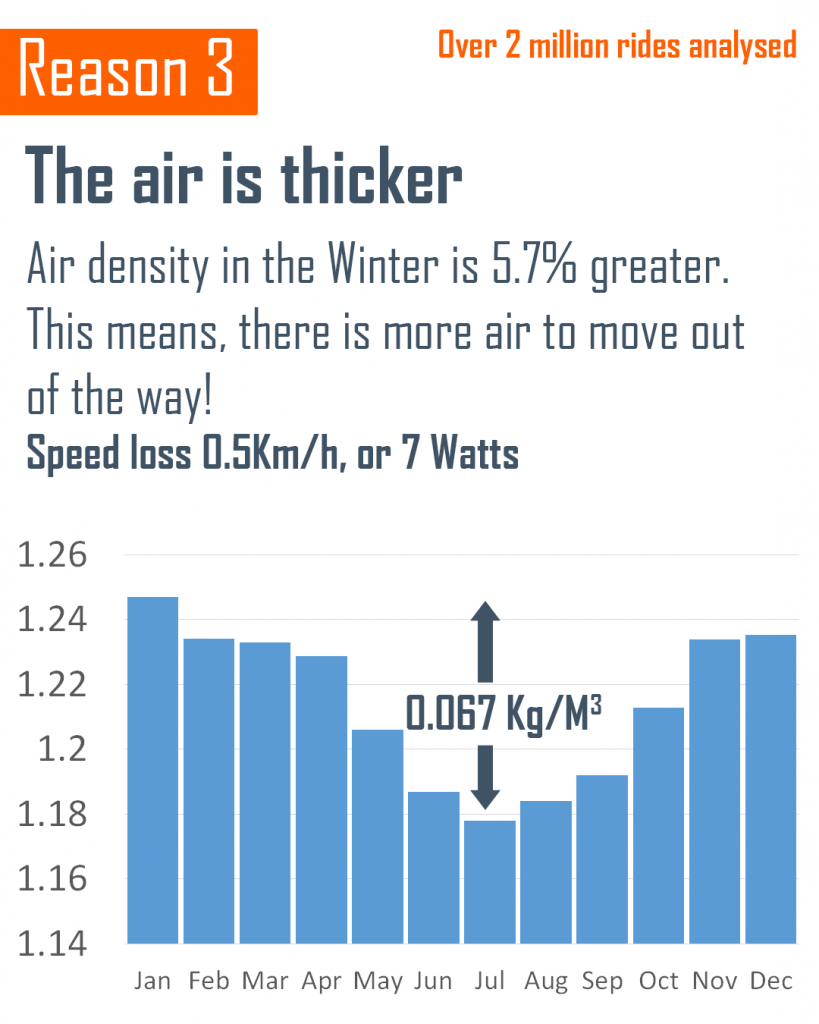
Cold is slow!
The speed you ride at for a given power on a given day with some given cda is proportional to one over the square root of the density of the air that you’re riding through. This basically means that as air density goes up, our speed will go down. Air density is impacted primarily by temperature. Hot molecules move faster and spread out more. This means more air occupies some given space when it’s cold compared to when it’s hot. In a time trial, the amount of space we need to pass through is fixed at the distance of the race, but the amount of air occupying this space varies quite a lot from one day to the next.
If you have left your house at any point since October, you might have noticed it’s become rather chilly. As time trialists, we think “gosh, the air is rather dense today” and people look at us like we have just started speaking Spanish. Cold days are slow days. It’s just the laws of physics.
If it’s slow, what’s the point of racing in February?
Time trialing is part art, part science. The ratio of art to science will vary depending on who you ask but everyone agrees, to get good at time trials you have to do them. As with anything though, blind practice only gets you so far. Practising with purpose is the key.
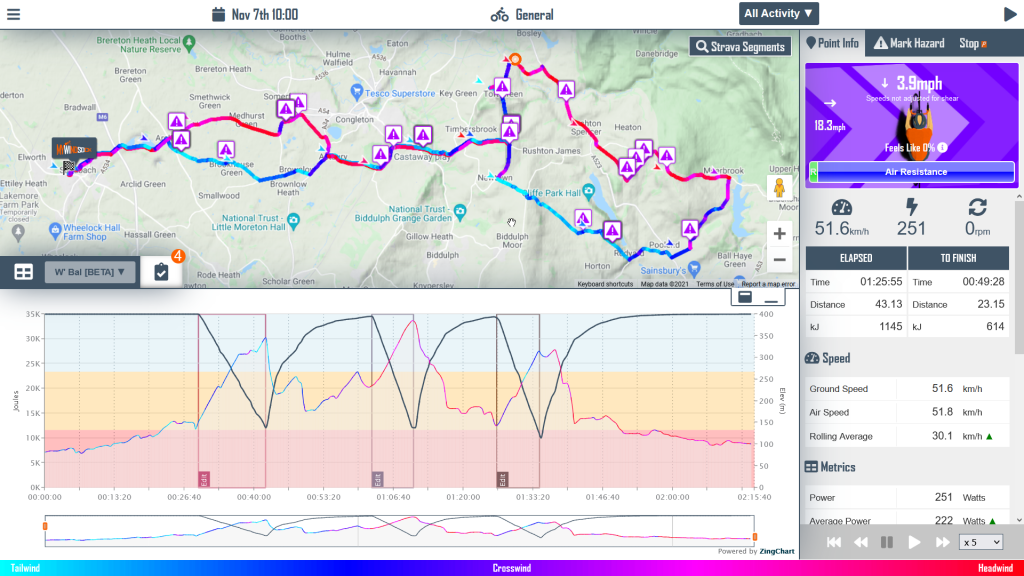
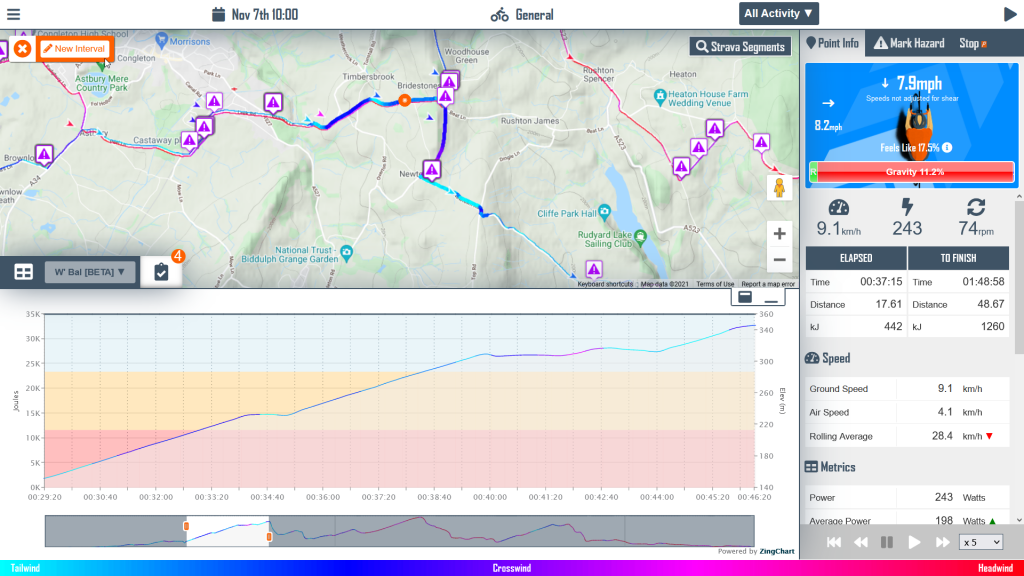
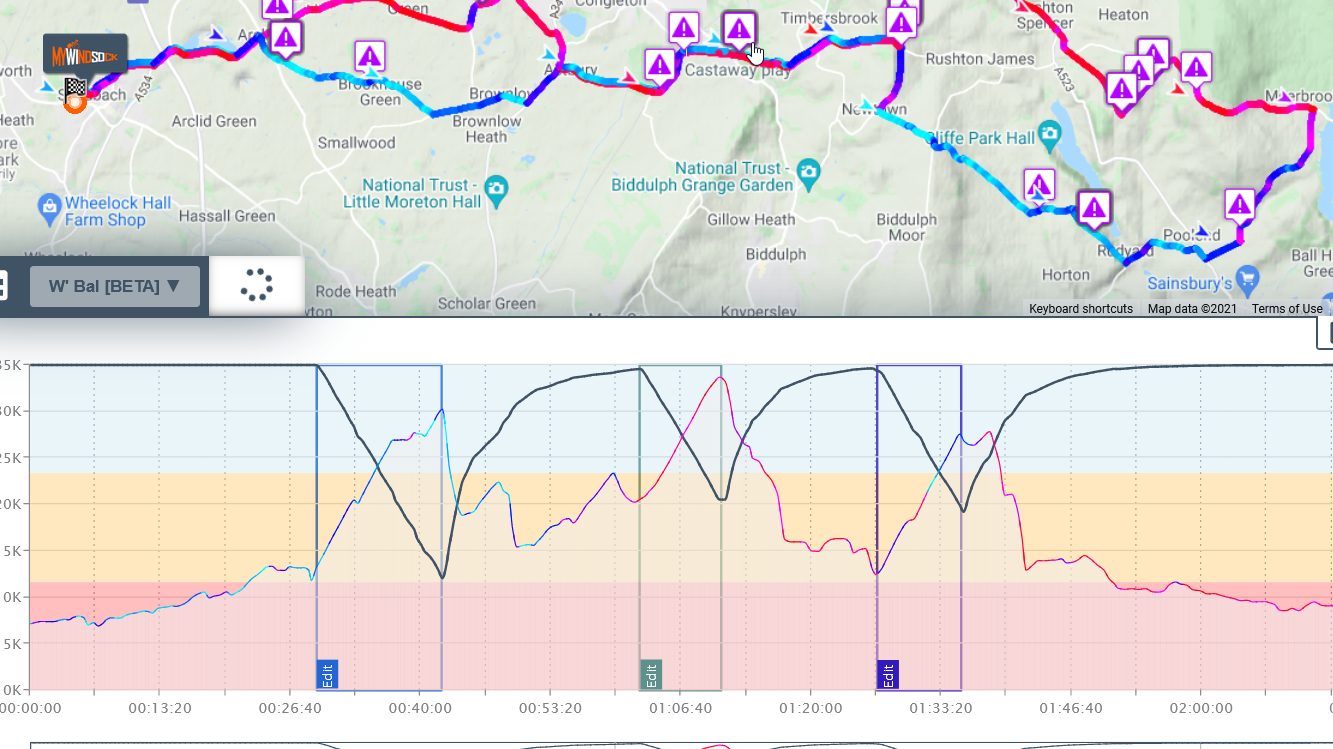
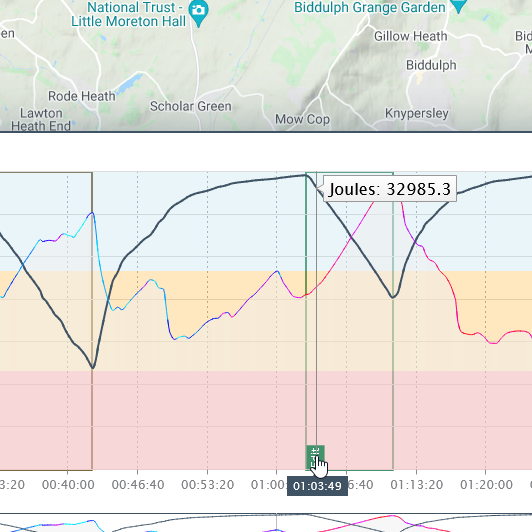
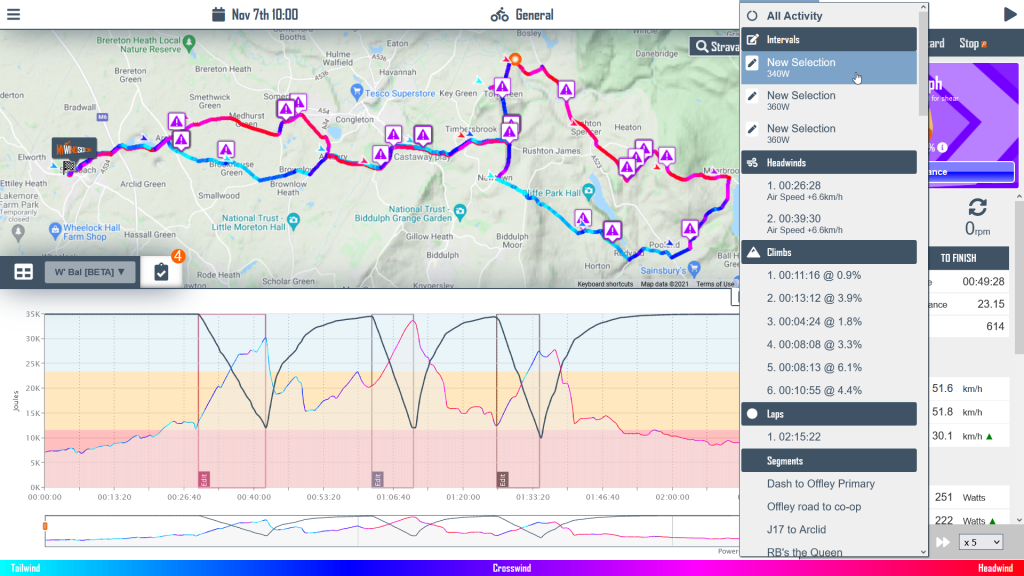
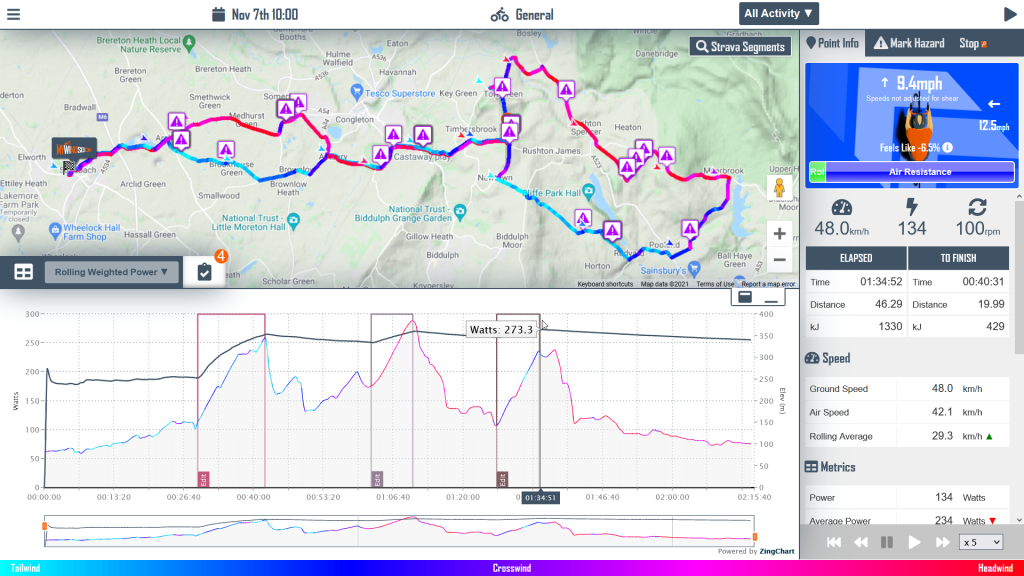
What would be handy is some kind of service which analyses your winter time trials and tells you how much impact the weather would have and how aero you are. Of course, you can see all of that information here.
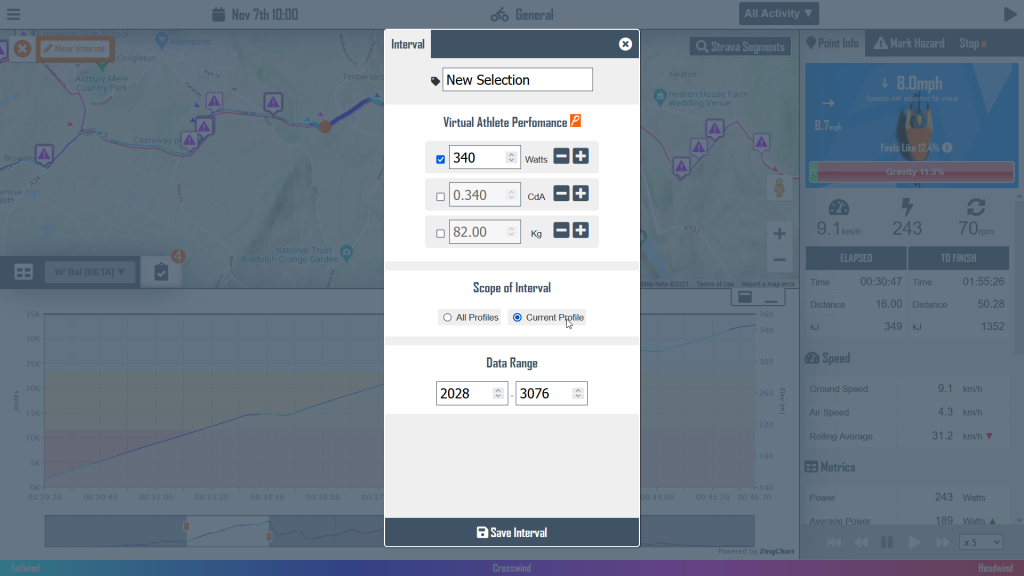
Use myWindsock to dial in your pacing and kit choices so that by the time summer comes around you’re dropping massive PB performances with confidence.