 UK Time Trial Events
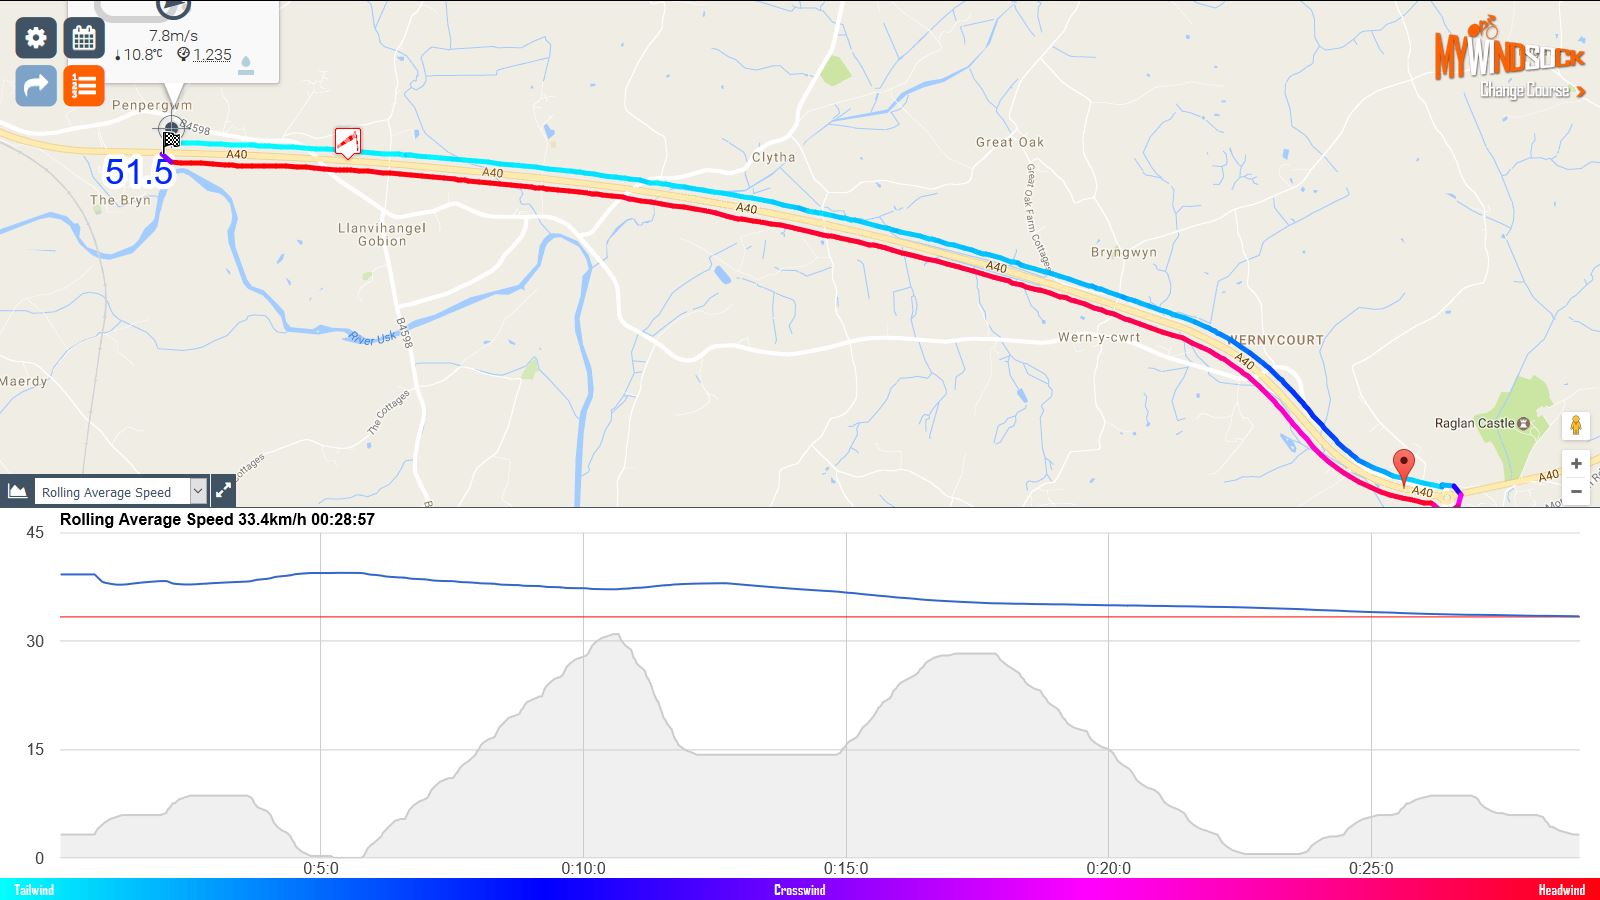
The Rolling Average Speed graph depicts how your average speed evolves over the ride duration.
Knowing how you are doing against your target time can help with mental focus and morale during a hard effort. For example, an out and back course in which the out bound leg has a headwind and the return a tailwind. The outbound headwind leg will have a lower average speed than the target average. Knowing what the target speed at any point on the course is gives you encouragement that the target time is achievable.
The below image depicts the opposite of tail out, headwind back.